Ensembler: Enabling High-Throughput Molecular Simulations at the Superfamily Scale - PubMed (original) (raw)
Ensembler: Enabling High-Throughput Molecular Simulations at the Superfamily Scale
Daniel L Parton et al. PLoS Comput Biol. 2016.
Abstract
The rapidly expanding body of available genomic and protein structural data provides a rich resource for understanding protein dynamics with biomolecular simulation. While computational infrastructure has grown rapidly, simulations on an omics scale are not yet widespread, primarily because software infrastructure to enable simulations at this scale has not kept pace. It should now be possible to study protein dynamics across entire (super)families, exploiting both available structural biology data and conformational similarities across homologous proteins. Here, we present a new tool for enabling high-throughput simulation in the genomics era. Ensembler takes any set of sequences-from a single sequence to an entire superfamily-and shepherds them through various stages of modeling and refinement to produce simulation-ready structures. This includes comparative modeling to all relevant PDB structures (which may span multiple conformational states of interest), reconstruction of missing loops, addition of missing atoms, culling of nearly identical structures, assignment of appropriate protonation states, solvation in explicit solvent, and refinement and filtering with molecular simulation to ensure stable simulation. The output of this pipeline is an ensemble of structures ready for subsequent molecular simulations using computer clusters, supercomputers, or distributed computing projects like Folding@home. Ensembler thus automates much of the time-consuming process of preparing protein models suitable for simulation, while allowing scalability up to entire superfamilies. A particular advantage of this approach can be found in the construction of kinetic models of conformational dynamics-such as Markov state models (MSMs)-which benefit from a diverse array of initial configurations that span the accessible conformational states to aid sampling. We demonstrate the power of this approach by constructing models for all catalytic domains in the human tyrosine kinase family, using all available kinase catalytic domain structures from any organism as structural templates. Ensembler is free and open source software licensed under the GNU General Public License (GPL) v2. It is compatible with Linux and OS X. The latest release can be installed via the conda package manager, and the latest source can be downloaded from https://github.com/choderalab/ensembler.
Conflict of interest statement
I have read the journal’s policy and the authors of this manuscript have the following competing interests: JDC is a member of the Scientific Advisory Board for Schrödinger.
Figures
Fig 1. Diagrammatic representation of the stages of the Ensembler pipeline and illustrative statistics for modeling all human tyrosine kinase catalytic domains.
On the left, the various stages of the Ensembler pipeline are shown. The red labels indicate the corresponding text description provided for each stage in the Design and Implementation section. On the right, the number of viable models surviving each stage of the pipeline is shown for the 93 target TK domains and for two representative individual TK domains (SRC and ABL). Typical timings on a computer cluster (containing Intel Xeon E5-2665 2.4GHz hyperthreaded processors and NVIDIA GTX-680 or GTX-Titan GPUs) is reported to illustrate resource requirements per model for modeling the entire set of tyrosine kinases. Note that CPU-h denotes the number of hours consumed by the equivalent of a single CPU hyperthread and GPU-h on a single GPU—parallel execution via MPI reduces wall clock time nearly linearly.
Fig 2. Number of PDB structures available for each TK target.
Data is shown for each of the 93 TK kinase domains, sorted in order of the number of available PDB structures for each domain. The labels indicate the UniProt name for the target protein plus an index for the kinase domain (three of the selected proteins have two kinase domains). Each PDB chain is counted individually, and only chains which contain the target domain are counted.
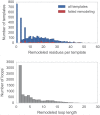
Fig 3. Distributions for the number of missing residues in the TK templates.
Upper: The number of missing residues per template, for all templates (blue) and for only those templates for which template remodeling with the
loopmodel
subcommand failed (red). Templates for which remodeling failed had a median of 20 missing residues, compared to a median of 14 missing residues for templates for which remodeling was successful. Lower: The number of residues in each missing loop, for all templates.
Fig 4. Template-target sequence identity distribution for human tyrosine kinase catalytic domains.
Sequence identities are calculated from all pairwise target-template alignments, where targets are human kinase catalytic domain sequences and templates are all kinase catalytic domains from any organism with structures in the PDB, as described in the text. A kernel density estimate of the target-template sequence identity probability density function is shown as a solid line with shaded region, while the corresponding cumulative distribution function is shown as a dashed line.
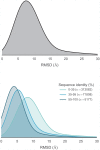
Fig 5. Distribution of RMSDs to all TK catalytic domain models relative to the model derived from the highest sequence identity template.
Distributions are built from data from all 93 TK domain targets. To better illustrate how conformational similarity depends on sequence identity, the lower plot illustrates the distributions as stratified into three sequence identity classes: high identity (55–100%), moderate identity (35–55%), and remote identity (0–35%). The plotted distributions have been smoothed using kernel density estimation.
Fig 6. Distribution of final energies from implicit solvent MD refinement of TK catalytic domain models.
To illustrate how the energies are affected by sequence identity, the models are separated into three sequence identity classes: high identity (55–100%), moderate identity (35–55%), and remote identity (0–35%). The plotted distributions have been smoothed using kernel density estimation. Refinement simulations were carried out at the default temperature of 300 K.
Fig 7. Superposition of clustered models of Src and Abl1.
Superposed renderings of nine models each for Src and Abl1, giving some indication the diversity of conformations generated by Ensembler. The models for each target were divided into three sequence identity ranges (as in Fig 5), and RMSD-based _k_-medoids clustering was performed (using the msmbuilder clustering package [18]) to select three clusters from each. The models shown are the centroids of each cluster. Models are colored and given transparency based on their sequence identity, so that high sequence identity models are blue and opaque, while lower sequence identity models are transparent and red.
Fig 8. Two structures of Src, indicating certain residues involved in activation.
In the inactive state, E310 forms a salt bridge with R409. During activation, the _α_C-helix (green) moves and rotates, orienting E310 towards the ATP-binding site and allowing it to instead form a salt bridge with K295. This positions K295 in the appropriate position for catalysis. Note that ANP (phosphoaminophosphonic acid-adenylate ester; an analog of ATP) is only physically present in the 2SRC structure. To aid visualization of the active site in 1Y57, it has been included in the rendering by structurally aligning the surrounding homologous protein residues.
Fig 9. Src, Abl1, and Flt4 models projected onto the distances between two conserved residue pairs, colored by sequence identity.
Two Src structures (PDB entries 1Y57 [57] and 2SRC [56]) are projected onto the plots for reference, representing active and inactive states respectively. These structures and the residue pairs analyzed here are depicted in Fig 8. Distances are measured between the center of masses of the three terminal sidechain heavy atoms of each residue. The atom names for these atoms, according to the PDB coordinate files for both reference structures, are—Lys: NZ, CD, CE (ethylamine); Glu: OE1, CD, OE2 (carboxylate); Arg: NH1, CZ, NH2 (part of guanidine).
Similar articles
- Atomistic view of the conformational activation of Src kinase using the string method with swarms-of-trajectories.
Gan W, Yang S, Roux B. Gan W, et al. Biophys J. 2009 Aug 19;97(4):L8-L10. doi: 10.1016/j.bpj.2009.06.016. Biophys J. 2009. PMID: 19686639 Free PMC article. - Building a virtual ligand screening pipeline using free software: a survey.
Glaab E. Glaab E. Brief Bioinform. 2016 Mar;17(2):352-66. doi: 10.1093/bib/bbv037. Epub 2015 Jun 20. Brief Bioinform. 2016. PMID: 26094053 Free PMC article. Review. - Imprint of evolutionary conservation and protein structure variation on the binding function of protein tyrosine kinases.
Verkhivker GM. Verkhivker GM. Bioinformatics. 2006 Aug 1;22(15):1846-54. doi: 10.1093/bioinformatics/btl199. Epub 2006 May 23. Bioinformatics. 2006. PMID: 16720585 - Ensembler: A Simple Package for Fast Prototyping and Teaching Molecular Simulations.
Ries B, Linker SM, Hahn DF, König G, Riniker S. Ries B, et al. J Chem Inf Model. 2021 Feb 22;61(2):560-564. doi: 10.1021/acs.jcim.0c01283. Epub 2021 Jan 29. J Chem Inf Model. 2021. PMID: 33512157 - High-throughput modeling and analysis of protein structural dynamics.
Liu X, Karimi HA. Liu X, et al. Brief Bioinform. 2007 Nov;8(6):432-45. doi: 10.1093/bib/bbm014. Epub 2007 May 7. Brief Bioinform. 2007. PMID: 17485424 Review.
Cited by
- A deep learning framework to predict binding preference of RNA constituents on protein surface.
Lam JH, Li Y, Zhu L, Umarov R, Jiang H, Héliou A, Sheong FK, Liu T, Long Y, Li Y, Fang L, Altman RB, Chen W, Huang X, Gao X. Lam JH, et al. Nat Commun. 2019 Oct 30;10(1):4941. doi: 10.1038/s41467-019-12920-0. Nat Commun. 2019. PMID: 31666519 Free PMC article. - SOURSOP: A Python Package for the Analysis of Simulations of Intrinsically Disordered Proteins.
Lalmansingh JM, Keeley AT, Ruff KM, Pappu RV, Holehouse AS. Lalmansingh JM, et al. J Chem Theory Comput. 2023 Aug 22;19(16):5609-5620. doi: 10.1021/acs.jctc.3c00190. Epub 2023 Jul 18. J Chem Theory Comput. 2023. PMID: 37463458 Free PMC article. - A Hybrid Structure-Based Machine Learning Approach for Predicting Kinase Inhibition by Small Molecules.
Liu C, Kutchukian P, Nguyen ND, AlQuraishi M, Sorger PK. Liu C, et al. J Chem Inf Model. 2023 Sep 11;63(17):5457-5472. doi: 10.1021/acs.jcim.3c00347. Epub 2023 Aug 18. J Chem Inf Model. 2023. PMID: 37595065 Free PMC article. - Heterogeneous folding landscapes and predetermined breaking points within a protein family.
Pechmann S. Pechmann S. Protein Sci. 2024 Dec;33(12):e5205. doi: 10.1002/pro.5205. Protein Sci. 2024. PMID: 39555686 - The dynamic conformational landscape of the protein methyltransferase SETD8.
Chen S, Wiewiora RP, Meng F, Babault N, Ma A, Yu W, Qian K, Hu H, Zou H, Wang J, Fan S, Blum G, Pittella-Silva F, Beauchamp KA, Tempel W, Jiang H, Chen K, Skene RJ, Zheng YG, Brown PJ, Jin J, Luo C, Chodera JD, Luo M. Chen S, et al. Elife. 2019 May 13;8:e45403. doi: 10.7554/eLife.45403. Elife. 2019. PMID: 31081496 Free PMC article.
References
- Shirts M, Pande VS. Screen Savers of the World Unite! Science. 2000. December;290(5498):1903–1904. - PubMed
- Pronk S, Larsson P, Pouya I, Bowman GR, Haque IS, Beauchamp K, et al. Copernicus: A New Paradigm for Parallel Adaptive Molecular Dynamics. In: Proceedings of 2011 International Conference for High Performance Computing, Networking, Storage and Analysis. SC’11. New York, NY, USA: ACM; 2011. p. 60:1–60:10.
Publication types
MeSH terms
Substances
LinkOut - more resources
Full Text Sources
Other Literature Sources


