The Microbiota of Breast Tissue and Its Association with Breast Cancer - PubMed (original) (raw)
The Microbiota of Breast Tissue and Its Association with Breast Cancer
Camilla Urbaniak et al. Appl Environ Microbiol. 2016.
Abstract
In the United States, 1 in 8 women will be diagnosed with breast cancer in her lifetime. Along with genetics, the environment contributes to disease development, but what these exact environmental factors are remains unknown. We have previously shown that breast tissue is not sterile but contains a diverse population of bacteria. We thus believe that the host's local microbiome could be modulating the risk of breast cancer development. Using 16S rRNA amplicon sequencing, we show that bacterial profiles differ between normal adjacent tissue from women with breast cancer and tissue from healthy controls. Women with breast cancer had higher relative abundances of Bacillus, Enterobacteriaceae and Staphylococcus Escherichia coli (a member of the Enterobacteriaceae family) and Staphylococcus epidermidis, isolated from breast cancer patients, were shown to induce DNA double-stranded breaks in HeLa cells using the histone-2AX (H2AX) phosphorylation (γ-H2AX) assay. We also found that microbial profiles are similar between normal adjacent tissue and tissue sampled directly from the tumor. This study raises important questions as to what role the breast microbiome plays in disease development or progression and how we can manipulate this for possible therapeutics or prevention.
Importance: This study shows that different bacterial profiles in breast tissue exist between healthy women and those with breast cancer. Higher relative abundances of bacteria that had the ability to cause DNA damage in vitro were detected in breast cancer patients, as was a decrease in some lactic acid bacteria, known for their beneficial health effects, including anticarcinogenic properties. This study raises important questions as to the role of the mammary microbiome in modulating the risk of breast cancer development.
Copyright © 2016 Urbaniak et al.
Figures
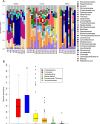
FIG 1
Breast tissue microbiota in 43 Canadian women identified by 16S rRNA amplicon sequencing. (A) The relative abundances of bacterial genera in different breast tissue samples were visualized by bar plots. Each bar represents a subject and each colored box, a bacterial taxon. The height of a colored box represents the relative abundance of that organism within the sample. Taxa present at less than 2% abundance in a given sample are displayed in the remaining fraction section at the top of the graph (gray boxes). As shown by the bar plots, a variety of bacteria was detected in breast tissue. The legend is read from bottom to top, with the bottom organism on the legend corresponding to the bottom colored box on the bar plot. (B) Box plots of the six phyla identified in breast tissue. The box signifies the 75% (upper) and 25% (lower) quartiles and thus shows where 50% of the samples lie. The black line inside the box represents the median. The whiskers represent the lowest datum still within 1.5 interquartile range (IQR) of the lower quartile and the highest datum still within 1.5 IQR of the upper quartile. Outliers are shown with open circles.
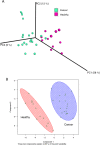
FIG 2
Comparison of bacterial profiles between breast cancer patients and healthy controls. Weighted UniFrac principal-coordinate (PCoA) plot (A) and K-means clusterplot of centered log ratio-transformed data (B). Each breast tissue sample, represented by a colored point, was plotted on a 3-dimensional, 3-axis plane representing 79% of the variation observed between all samples (A) or 44.85% of the variation on a 2-axis plane (B). Samples (points) that cluster together are similar in biota composition and abundance. The distinct separation between the two groups indicates that bacterial profiles differ between women with and without cancer. The PERMANOVA performed on the weighted UniFrac distances showed that the observed differences were statistically significant (10,000 permutations; pseudo F statistic, 14.4; P < 0.01).
FIG 3
Differences in relative abundances of taxa exist between healthy and cancer patients. The top panels show the bacteria that had statistically significant higher relative abundances in healthy patients than in those with cancer (i.e., normal adjacent tissue), and the bottom panels shows the bacteria that had statistically significant higher relative abundances in cancer patients than in healthy controls. The box in each graph signifies the 75% (upper) and 25% (lower) quartiles and thus shows where 50% of the samples lie. The black line inside the box represents the median. The whiskers represent the lowest datum still within 1.5 interquartile range (IQR) of the lower quartile and the highest datum still within 1.5 IQR of the upper quartile. Outliers are shown with open circles. Significance was based on the Benjamini-Hochberg corrected P value of the Wilcoxon rank test (significance threshold, P < 0.1).
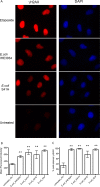
FIG 4
DNA damage ability of E. coli isolated from breast cancer patients. E. coli was isolated from normal adjacent tissue of 2 patients with breast cancer and tested for its ability to induce DNA double-stranded breaks. E. coli (isolates H and E) from subject 41, isolate L from subject 34, and strain IHE3034 were incubated with HeLa cells at an MOI of 100 for 4 h and then stained for γ-H2AX and DAPI. Etoposide, a chemical that induces DNA double-stranded breaks in eukaryotic cells, was used as a technical positive control. (A) Representative immunofluorescent images of HeLa cells at ×1,000 magnification. (B) Image J was used to measure the mean fluorescent intensity of γ-H2AX-positive cells from the digitally acquired images. (C) Percentages of total cells stained for γ-H2AX calculated from the immunofluorescent images. Data displayed in the bar graphs represent the mean and standard deviation of results from 3 experiments, representing a total of 48 fields of view and approximately 300 cells for each treatment group. **, P < 0.01.
Similar articles
- The Microbiome of Aseptically Collected Human Breast Tissue in Benign and Malignant Disease.
Hieken TJ, Chen J, Hoskin TL, Walther-Antonio M, Johnson S, Ramaker S, Xiao J, Radisky DC, Knutson KL, Kalari KR, Yao JZ, Baddour LM, Chia N, Degnim AC. Hieken TJ, et al. Sci Rep. 2016 Aug 3;6:30751. doi: 10.1038/srep30751. Sci Rep. 2016. PMID: 27485780 Free PMC article. - Characterization of the microbiome of nipple aspirate fluid of breast cancer survivors.
Chan AA, Bashir M, Rivas MN, Duvall K, Sieling PA, Pieber TR, Vaishampayan PA, Love SM, Lee DJ. Chan AA, et al. Sci Rep. 2016 Jun 21;6:28061. doi: 10.1038/srep28061. Sci Rep. 2016. PMID: 27324944 Free PMC article. - Gut microbiome compositional and functional differences between tumor and non-tumor adjacent tissues from cohorts from the US and Spain.
Allali I, Delgado S, Marron PI, Astudillo A, Yeh JJ, Ghazal H, Amzazi S, Keku T, Azcarate-Peril MA. Allali I, et al. Gut Microbes. 2015;6(3):161-72. doi: 10.1080/19490976.2015.1039223. Gut Microbes. 2015. PMID: 25875428 Free PMC article. - Resident bacteria in breast cancer tissue: pathogenic agents or harmless commensals?
O'Connor H, MacSharry J, Bueso YF, Lindsay S, Kavanagh EL, Tangney M, Clyne M, Saldova R, McCann A. O'Connor H, et al. Discov Med. 2018 Sep;26(142):93-102. Discov Med. 2018. PMID: 30399327 Review. - The microbiome and breast cancer: a review.
Chen J, Douglass J, Prasath V, Neace M, Atrchian S, Manjili MH, Shokouhi S, Habibi M. Chen J, et al. Breast Cancer Res Treat. 2019 Dec;178(3):493-496. doi: 10.1007/s10549-019-05407-5. Epub 2019 Aug 27. Breast Cancer Res Treat. 2019. PMID: 31456069 Review.
Cited by
- Gut microbial differences in breast and prostate cancer cases from two randomised controlled trials compared to matched cancer-free controls.
Smith KS, Frugé AD, van der Pol W, Caston NE, Morrow CD, Demark-Wahnefried W, Carson TL. Smith KS, et al. Benef Microbes. 2021 Jun 15;12(3):239-248. doi: 10.3920/BM2020.0098. Epub 2021 Apr 1. Benef Microbes. 2021. PMID: 33789551 Free PMC article. - A theoretic approach to the mode of gut microbiome translocation in SIV-infected Asian macaques.
Li W, Ma ZS. Li W, et al. FEMS Microbiol Ecol. 2020 Aug 1;96(8):fiaa134. doi: 10.1093/femsec/fiaa134. FEMS Microbiol Ecol. 2020. PMID: 32618338 Free PMC article. - Tissue Microbiome Associated With Human Diseases by Whole Transcriptome Sequencing and 16S Metagenomics.
Salihoğlu R, Önal-Süzek T. Salihoğlu R, et al. Front Genet. 2021 Mar 4;12:585556. doi: 10.3389/fgene.2021.585556. eCollection 2021. Front Genet. 2021. PMID: 33747035 Free PMC article. Review. - Cancer and the Microbiome of the Human Body.
Herrera-Quintana L, Vázquez-Lorente H, Lopez-Garzon M, Cortés-Martín A, Plaza-Diaz J. Herrera-Quintana L, et al. Nutrients. 2024 Aug 21;16(16):2790. doi: 10.3390/nu16162790. Nutrients. 2024. PMID: 39203926 Free PMC article. Review. - Multiomics insights on the onset, progression, and metastatic evolution of breast cancer.
Alvarez-Frutos L, Barriuso D, Duran M, Infante M, Kroemer G, Palacios-Ramirez R, Senovilla L. Alvarez-Frutos L, et al. Front Oncol. 2023 Dec 19;13:1292046. doi: 10.3389/fonc.2023.1292046. eCollection 2023. Front Oncol. 2023. PMID: 38169859 Free PMC article. Review.
References
Publication types
MeSH terms
Substances
LinkOut - more resources
Full Text Sources
Other Literature Sources
Medical


