Coelimination and Survival in Gene Network Evolution: Dismantling the RA-Signaling in a Chordate - PubMed (original) (raw)
Coelimination and Survival in Gene Network Evolution: Dismantling the RA-Signaling in a Chordate
Josep Martí-Solans et al. Mol Biol Evol. 2016 Sep.
Abstract
The bloom of genomics is revealing gene loss as a pervasive evolutionary force generating genetic diversity that shapes the evolution of species. Outside bacteria and yeast, however, the understanding of the process of gene loss remains elusive, especially in the evolution of animal species. Here, using the dismantling of the retinoic acid metabolic gene network (RA-MGN) in the chordate Oikopleura dioica as a case study, we combine approaches of comparative genomics, phylogenetics, biochemistry, and developmental biology to investigate the mutational robustness associated to biased patterns of gene loss. We demonstrate the absence of alternative pathways for RA-synthesis in O. dioica, which suggests that gene losses of RA-MGN were not compensated by mutational robustness, but occurred in a scenario of regressive evolution. In addition, the lack of drastic phenotypic changes associated to the loss of RA-signaling provides an example of the inverse paradox of Evo-Devo. This work illustrates how the identification of patterns of gene coelimination-in our case five losses (Rdh10, Rdh16, Bco1, Aldh1a, and Cyp26)-is a useful strategy to recognize gene network modules associated to distinct functions. Our work also illustrates how the identification of survival genes helps to recognize neofunctionalization events and ancestral functions. Thus, the survival and extensive duplication of Cco and RdhE2 in O. dioica correlated with the acquisition of complex compartmentalization of expression domains in the digestive system and a process of enzymatic neofunctionalization of the Cco, while the surviving Aldh8 could be related to its ancestral housekeeping role against toxic aldehydes.
Keywords: chordate.; evo–devo; gene coelimination; gene loss; regressive evolution; retinoic acid.
© The Author 2016. Published by Oxford University Press on behalf of the Society for Molecular Biology and Evolution. All rights reserved. For permissions, please e-mail: journals.permissions@oup.com.
Figures
Fig. 1
Schematic representation of the RA-MGN in vertebrates that establishes the levels of atRA, whose signaling regulates developmental genes (e.g., Hox1) through nuclear receptors (e.g., RAR and PPAR). The enzymes of the canonical pathway (in bold: Rdh10, Aldh1a, and Cyp26) regulate the synthesis of atRA from atROL (vitamin A) to atRAL precursors. In vertebrates, the RA-MGN is a robust system due to the presence of other redundant enzymes that bypass the canonical pathway (i.e., RdhE2, Rdh16, Adh1/4, Aldh8a1, and Cco).
Fig. 2
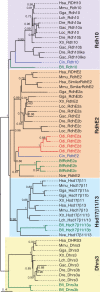
ML phylogenetic tree of the SDR-16C Rdh10 and RdhE2 subfamilies in chordates revealing the loss of Rdh10, and the surviving and lineage-specific duplication of RdhE2 in Oikopleura dioica. The sister SDR-16C subfamily of hydroxysteroid 17-β dehydrogenases 11 and 13 (Hsd17β11/13) and the basal dehydrogenases/reductases member 3 (Dhrs3) as outgroup were included to root the tree. Scale bar indicates amino acid substitutions. Values for the approximate likelihood-ratio test (aLRT) are only shown in nodes with support values greater than 0.7. Vertebrates: Danio rerio (Dre), Gasterosteus aculeatus (Gac), Gallus gallus (Gga), Homo sapiens (Hsa), Latimeria chalumnae (Lch), and Lepisosteus oculatus (Loc), Mus musculus (Mmu), Petromizus marinus (Pmr), Xenopus tropicalis (Xtr); Urochordates: Ciona intestinalis (Cin) and Oikopleura dioica (Odi); Cephalochordates: Branchiostoma floridae (Bfl); Cnidarians: Nematostella vectensis (Nve).
Fig. 3
ML phylogenetic tree of the Aldh8a1 family in chordates revealing the surviving of this gene to the dismantling of the RA-MGN in Oikopleura dioica. The sister Aldh9a1 and the Aldh2 outgroup were included to root the tree. Scale bar indicates amino acid substitutions. Values for the approximate likelihood-ratio test (aLRT) are only shown in nodes with support values greater than 0.7. Abbreviations are as in figure 2.
Fig. 4
ML phylogenetic tree of the Cco family (Bco1, Rpe65, and Bco2) in chordates revealing the loss of Bco1, and the surviving and lineage specific duplication of uro-Cco paralogs in Oikopleura dioica. Scale bar indicates amino-acid substitutions. The tree is unrooted because the absence of closely related gene family that could render a reliable sequence alignment. Values for the approximate likelihood-ratio test (aLRT) are shown in nodes. Abbreviations are as in figure 2. In addition to the Cco of the ascidian Ciona intestinalis, in silico survey of the genomes of five additional ascidian species in the Aniseed database (
, last accessed May 2016)—Botryllus schlosseri (Bsc), Ciona savignyi (Csa), Halocynthia roretzi (Hro), Halocynthia aurantium (Hau) and Phallusia fumigata (Pfu)—allowed us to identify and include 13 new Cco sequences in the phylogenetic analysis in order to increase the robustness of tree and to clarify the position of O. dioica Cco within the uro-Cco group, characterized by multiple lineage-specific duplicated paralogs in most analyzed species.
Fig. 5
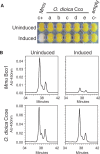
Oikopleura dioica Cco paralogs do not show β-carotene cleaving activity. (A) Induction of heterologous expression of O. dioica Cco enzymes (Ccoa to Ccoe) in p-orange Escherichia coli strain did not result in a color shift from yellow to white. In contrast, the mouse Bco1 that was used as positive control cleaved accumulated β-carotene and rendered pellets with an obvious white color in comparison to the uninduced condition. (B) HPLC analysis of β-carotene content of p-orange E. coli cultures expressing mouse Bco1 (positive control, top) and O. dioica Ccoe (bottom). While a 9-fold reduction in the β-carotene content was observed in the Mmu Bco1-expressing cultures, no reduction was observed in any of the O. dioica Cco-expressing cultures, as represented by Ccoe-induced cultures as an example. Thus, HPLC analysis supported the observation that none of the O. dioica Cco cleaves β-carotene to generate atRAL.
Fig. 6
HPLC analysis of the retinoid (A) and carotenoid (B) content of Oikopleura dioica samples from different stages, including unfertilized eggs, 7-hpf embryos, day-4 nonmature adults, and day-5 mature males and day-5 mature females. (A) Oikopleura dioica extracts analyzed in normal phase HPLC. Chromatogram extracted at 350 nm. No atRA or its 9-_cis_-, 11-_cis_-, or 13-_cis_-isomers were detected. Unidentified peak 2 eluted at 14.2 min, may represent an endogenous retinoid, while peak 1 eluted at 5.0 min, is an unrelated compound (see text and
supplementary file S4, Supplementary Material
online, for details). (B) Analysis of carotenoid content in O. dioica by reverse phase HPLC. Chromatograms extracted at 450 nm showed four peaks eluted at 25.8, 28.3, 31.3, and 33.8 min in most O. dioica samples. None of the peaks appeared to be β-carotene standard. Peaks 2,3 and 4 have absorbance spectra typical for carotenoids, while peak 1 represents a different compound. Carotenoids (peaks 2, 3, and 4) likely have a dietary origin (see
supplementary file S5, Supplementary Material
online, for the carotenoid content of the four microalgae species used in the O. dioica diet). The inverse relative abundance of peak 1 and the carotenoid peaks at different stages suggested that peak 1 might be derived from carotenoids and that O. dioica might have the ability to actively store carotenoids in eggs, and to metabolize them throughout their life cycle. The presence of β-carotene in the dietary algae (
supplementary file S5, Supplementary Material
online) suggests that the absence of atRA in O. dioica was not due to a dietary deficiency of β-carotene. The absence of a β-carotene in O. dioica samples could be explained by its transformation into astaxanthin, which appears to be the one of the major carotenoids found in larvaceans (Mojib et al. 2014).
Fig. 7
Developmental expression patterns of Oikopleura dioica Cco paralogs. Whole-mount in situ hybridization in O. dioica late tailbubs (A, E, I, N, and R), midhatchlings (B, F, K, O, and S), late hatchlings (C, G, L, P, and T), and tailshift juveniles (D, H, M, Q, and U). Ccoa first expression signal was observed in the stomach primordium by midhatch stage (B, arrowhead), and by late-hatch stage it was strong and restricted to the right wall of the left stomach lobe, in the connection between both stomach lobes, and in the ventral part of the right stomach lobe (C). Ccob expression signal appeared as a bilateral domain in the posterior pharynx, presumptively in the peripharyngeal bands (H and dorsal view in inset). Ccoc expression signal was first observed as a faint signal in few cells near the anterior tip of the notochord (yellow arrowheads) in tailbud embryos. This notochordal domain was temporarily maintained in early hatchlings (J), together with some broad expression signal in the trunk, with special intensity in epidermal cells symmetrically (pink arrowheads) (J). Ccoc expression appeared to be temporarily downregulated in midhatchlings (K), but it became again obvious in the vertical intestine of late-hatchlings and tailshift juveniles (L and M). In tailshift juveniles, Ccoc expression signal appeared in different epithelial oikoplastic fields (M; presumptively the posterior part of the field of Fol, the middle ventral surface, the anterior crescent and the posterior rosette, white arrowheads). Ccod was the only paralog that did not show any clear expression domain in the digestive system, but it was temporally detected in late tailbuds a bilateral pair of cells adjacent near the seventh notochordal cell (N inset), and at later stages in different epithelial oikoplastic fields (Q). Finally, Ccoe expression signal appeared in the vertical intestine of tailshift juveniles (U) also labeled by Ccoc, although the onset of the former seems to be later. Large image of each panel correspond to left lateral view oriented anterior toward the left and dorsal toward the top. Inset images are dorsal views of optical cross sections at the levels of the dashed lines. Black arrowheads label expression in the digestive system, yellow in the notochord, orange in a pair of bilateral cells adjacent to the notochord, pink in the epidermis, and white in the oikoplastic epithelium. In the printed version, color codes correspond to their equivalent intensity in the grey scale. Scale bar = 20 μm.
Fig. 8
Developmental expression patterns of Oikopleura dioica RdhE2 paralogs. Whole-mount in situ hybridization in O. dioica midhatchlings (A, D, G, and J), late hatchlings (B, E, H, and K), and tailshifts (C, F, I, and L) revealed RdhE2 expression domains in the digestive system (black arrowheads) and the oikoplastic epithelium (white arrowheads). RdhE2a expression signal was strong in the right stomach lobe and midintestine, and weak in the vertical intestine and the left stomach lobe (B, C). RdhE2b expression signal was detected in the right stomach lobe and in the midintestine (E, F). RdhE2c showed the earliest expression onset of all RdhE2 paralogs in the primordium of the stomach by mid hatchling (G), and it was detected in both stomach lobes in later stages (H, I). RdhE2d was the only paralog with no clear expression in the digestive system. Similar to Cco paralogs, different fields of the oikoplastic epithelium appears to have also recruited the expression of RdhE2a, RdhE2b, and RdhE2d in different fields (e.g., the field of Fol, the middle ventral surface, the anterior crescent and the posterior rosette). Large image of each panel correspond to left lateral view oriented anterior toward the left and dorsal toward the top. Inset images are dorsal views of optical cross sections at the levels of the dashed lines. Scale bar = 20 μm.
Fig. 9
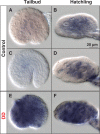
Developmental expression patterns of Oikopleura dioica Aldh8a1. Whole-mount in situ hybridization in O. dioica early tailbud stage (A and E), late tailbud stage (C) and midhatchling (B) and late-hatchling (D and F). Aldh8a1 expression signal did not show obvious tissue-specificity, but it appeared to be faintly and broadly distributed throughout the entire embryo in all analyzed developmental stages (A_–_D). Embryos treated with 0.25 μm/ml trans, _trans_-2,4-decadienal (DD), a model aldehyde for diatom-derived polyunsaturated aldehydes (PUAs), showed an obvious up-regulation of the signal throughout the embryo (E, F), suggesting a housekeeping role of the Aldh8a1 in aldehyde detoxification. Panels show left lateral views oriented anterior toward the left and dorsal toward the top. Scale bar = 20 μm.
Fig. 10
Functional biased pattern of gene loss by coelimination of genes of the retinoic acid metabolic gene network (RA-MGN). The losses of the genes Rdh10, Rdh16, Bco1, Aldh1a, and Cyp26 occurred in a context of low mutational robustness with no compensatory rerouting for the synthesis of atRA by any alternative pathway, and likely in an scenario of regressive evolution in which the loss of RA-signaling and its nuclear receptor genes (e.g., RAR, PPAR) did not imply major phenotypic changes related to RA-target genes, such as Hox1 that show the same expression pattern in Oikopleura dioica and ascidians.
Comment in
- The Telltale Heart of Chordate Evolution: New Study Shows Model Organism Making Do with Less.
Caspermeyer J. Caspermeyer J. Mol Biol Evol. 2016 Sep;33(9):2479-80. doi: 10.1093/molbev/msw156. Epub 2016 Aug 9. Mol Biol Evol. 2016. PMID: 27507841 No abstract available.
Similar articles
- Oikopleura dioica: An Emergent Chordate Model to Study the Impact of Gene Loss on the Evolution of the Mechanisms of Development.
Ferrández-Roldán A, Martí-Solans J, Cañestro C, Albalat R. Ferrández-Roldán A, et al. Results Probl Cell Differ. 2019;68:63-105. doi: 10.1007/978-3-030-23459-1_4. Results Probl Cell Differ. 2019. PMID: 31598853 Review. - Oikopleura dioica alcohol dehydrogenase class 3 provides new insights into the evolution of retinoic acid synthesis in chordates.
Cañestro C, Albalat R, Postlethwait JH. Cañestro C, et al. Zoolog Sci. 2010 Feb;27(2):128-33. doi: 10.2108/zsj.27.128. Zoolog Sci. 2010. PMID: 20141418 - Identification of Aldh1a, Cyp26 and RAR orthologs in protostomes pushes back the retinoic acid genetic machinery in evolutionary time to the bilaterian ancestor.
Albalat R, Cañestro C. Albalat R, et al. Chem Biol Interact. 2009 Mar 16;178(1-3):188-96. doi: 10.1016/j.cbi.2008.09.017. Epub 2008 Sep 24. Chem Biol Interact. 2009. PMID: 18926806 - Development of a chordate anterior-posterior axis without classical retinoic acid signaling.
Cañestro C, Postlethwait JH. Cañestro C, et al. Dev Biol. 2007 May 15;305(2):522-38. doi: 10.1016/j.ydbio.2007.02.032. Epub 2007 Mar 2. Dev Biol. 2007. PMID: 17397819 - Evolution of retinoic acid receptors and retinoic acid signaling.
Gutierrez-Mazariegos J, Schubert M, Laudet V. Gutierrez-Mazariegos J, et al. Subcell Biochem. 2014;70:55-73. doi: 10.1007/978-94-017-9050-5_4. Subcell Biochem. 2014. PMID: 24962881 Review.
Cited by
- ORTHOSCOPE: An Automatic Web Tool for Phylogenetically Inferring Bilaterian Orthogroups with User-Selected Taxa.
Inoue J, Satoh N. Inoue J, et al. Mol Biol Evol. 2019 Mar 1;36(3):621-631. doi: 10.1093/molbev/msy226. Mol Biol Evol. 2019. PMID: 30517749 Free PMC article. - Complete Inactivation of Sebum-Producing Genes Parallels the Loss of Sebaceous Glands in Cetacea.
Lopes-Marques M, Machado AM, Alves LQ, Fonseca MM, Barbosa S, Sinding MS, Rasmussen MH, Iversen MR, Frost Bertelsen M, Campos PF, da Fonseca R, Ruivo R, Castro LFC. Lopes-Marques M, et al. Mol Biol Evol. 2019 Jun 1;36(6):1270-1280. doi: 10.1093/molbev/msz068. Mol Biol Evol. 2019. PMID: 30895322 Free PMC article. - Origin and evolutionary landscape of Nr2f transcription factors across Metazoa.
Coppola U, Waxman JS. Coppola U, et al. PLoS One. 2021 Nov 22;16(11):e0254282. doi: 10.1371/journal.pone.0254282. eCollection 2021. PLoS One. 2021. PMID: 34807940 Free PMC article. - Diatom bloom-derived biotoxins cause aberrant development and gene expression in the appendicularian chordate Oikopleura dioica.
Torres-Águila NP, Martí-Solans J, Ferrández-Roldán A, Almazán A, Roncalli V, D'Aniello S, Romano G, Palumbo A, Albalat R, Cañestro C. Torres-Águila NP, et al. Commun Biol. 2018 Aug 24;1:121. doi: 10.1038/s42003-018-0127-2. eCollection 2018. Commun Biol. 2018. PMID: 30272001 Free PMC article. - The _Cis_-Regulatory Code for Kelch-like 21/30 Specific Expression in Ciona robusta Sensory Organs.
Coppola U, Kamal AK, Stolfi A, Ristoratore F. Coppola U, et al. Front Cell Dev Biol. 2020 Sep 11;8:569601. doi: 10.3389/fcell.2020.569601. eCollection 2020. Front Cell Dev Biol. 2020. PMID: 33043001 Free PMC article.
References
- Albalat R. 2009. The retinoic acid machinery in invertebrates: ancestral elements and vertebrate innovations. Mol Cell Endocrinol. 313:23–35. - PubMed
- Albalat R. 2012. Evolution of the genetic machinery of the visual cycle: a novelty of the vertebrate eye? Mol Biol Evol. 29:1461–1469. - PubMed
- Albalat R, Cañestro C. 2016. Evolution by gene loss. Nat Rev Genet. 17:379–391. - PubMed
Publication types
MeSH terms
Substances
LinkOut - more resources
Full Text Sources
Other Literature Sources


