DNMT3A and TET2 compete and cooperate to repress lineage-specific transcription factors in hematopoietic stem cells - PubMed (original) (raw)
. 2016 Sep;48(9):1014-23.
doi: 10.1038/ng.3610. Epub 2016 Jul 18.
Xiaotian Zhang 1 2 3, Mira Jeong 1 2, Myunggon Ko 5 6, Yun Huang 7, Hyun Jung Park 4, Anna Guzman 1 2, Yong Lei 1 2, Yung-Hsin Huang 1 2, Anjana Rao 5, Wei Li 4, Margaret A Goodell 1 2 3
Affiliations
- PMID: 27428748
- PMCID: PMC4957136
- DOI: 10.1038/ng.3610
DNMT3A and TET2 compete and cooperate to repress lineage-specific transcription factors in hematopoietic stem cells
Xiaotian Zhang et al. Nat Genet. 2016 Sep.
Abstract
Mutations in the epigenetic modifiers DNMT3A and TET2 non-randomly co-occur in lymphoma and leukemia despite their epistasis in the methylation-hydroxymethylation pathway. Using Dnmt3a and Tet2 double-knockout mice in which the development of malignancy is accelerated, we show that the double-knockout methylome reflects regions of independent, competitive and cooperative activity. Expression of lineage-specific transcription factors, including the erythroid regulators Klf1 and Epor, is upregulated in double-knockout hematopoietic stem cells (HSCs). DNMT3A and TET2 both repress Klf1, suggesting a model of cooperative inhibition by epigenetic modifiers. These data demonstrate a dual role for TET2 in promoting and inhibiting HSC differentiation, the loss of which, along with DNMT3A, obstructs differentiation, leading to transformation.
Figures
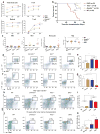
Figure 1. Phenotype of Dnmt3a-Tet2 DKO mice
a) Engraftment of donor-derived bone marrow cells after competitive bone marrow transplantation (BMT) of wild type, _Dnmt3a_−/−, _Tet2_−/− and DKO in WBC, myeloid, B cell and T cell compartments in the first 12 weeks. n=15 for each group. b) Kaplan-Meier survival of BMT recipients ***, p<0.001, Log-rank test. c) Complete blood counts of BMT recipients after 4 months. WBC, white blood cell. RBC, Red blood cell, MCV, Mean corpuscular volume. n=10 for each group. d–e) Donor-derived cells stained with myeloid markers Mac1 and Gr1 6 months after BMT. f–g) Donor-derived cells stained with the erythroid markers CD71 and Ter119 6 months after BMT. n=3 for each group. h) Hematopoietic progenitor analysis (Lineageneg Scal+cKit+) in representative mice 1 month after Poly(I:C) injection; (i) Quantification of myeloid progenitors (LK) in donor-derived cells from (h) n=3 for each group. (j,k) Percentage of hematopoietic progenitors (LSK) in donor-derived cells 4 months after BMT. n=3 for each group. All error bars show the mean±S.E.M. n.s, not significant; * p<0.05; ** p<0.01. Two tailed student T test.
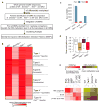
Figure 2. Synergistic dysregulation of HSC- and RBC-associated genes in DKO HSCs
a) Heatmap displaying all differentially expressed genes in each genotype relative to WT. b) Plot representing GSEA enrichment of Fingerprint lineage-specific genes among differentially expressed genes between the indicated genotypes. Normalized enrichment scores are plotted with FDR q value. HSC: Hematopoietic Stem Cell. NuRBC: nucleated Red Blood Cell. c) Expression levels of the indicated genes in HSCs. p<0.05. **, p<0.01. ***, p<0.001. Each group consist of 2 biological replicates. p value was calculated by cuffdiff in the RNA-seq analysis pipeline. d) Functional pathway enrichment analysis of genes up-regulated in DKO vs. _Tet2_−/− HSCs. e) Venn diagram depicting the overlap between genes upregulated in DKO vs. _Tet2_−/− HSCs compared with activated and repressed KLF1 targets. **, p<0.01. Fisher exact test. The indicated genes are members of the heme synthesis pathway. f) Box plot depicting the range of expression of KLF1 target genes from (e) which are activated in the DKO relative to the _Tet2_−/−. Boxplots represent the interquartile range (25% to 75%), with the median; whiskers correspond to 1.5 times the interquartile range. Each group consist of 2 biological replicates. Each * p<0.05. **, p<0.01. ns, not significant. p value was calculated by cuffdiff in RNA-seq analysis pipeline.
Figure 3. Knockdown of Klf1 and Epor reverses the abnormal self-renewal of DKO HSPCs in vitro
a) Replating assay with DKO Lin− cKit+ Sca1+ (LSK) HSPC cells transfected with shScramble, sh_Epor_, and sh_Klf1_ using M3434 methylcellulose medium. n=3 for each treatment group. b) ckit expression on plated DKO LSK HSPC cells transfected with shScramble, sh_Epor_, and sh_Klf1_ cells. c) Immunoblot shows the knockdown of Epor and the expression level of downstream targets of Epor after knockdown of Epor in DKO HSPCs. d) Replating assay with DKO whole bone marrow cell after treatment with the JAK2 inhibitor Ruxolitinib and Bcl-xL specific inhibitor WEHI-569. n=3 for each treatment group. e) ckit expression on plated DKO whole bone marrow cells treated with Jak2 inhibitor Ruxolitinib and Bcl-xL specific inhibitor WEHI-569. All error bars show the mean ± S.E.M. *, p<0.05, Student T-test.
Figure 4. DNA methylation across the genotypes are highly dynamic
a) Flowchart of DNA methylation analysis strategy. b) Heat map depicting differentially methylated regions (DMRs) of the 6 major dynamic DNA methylation alteration patterns (DMAPs). c) Numbers of hypermethylated and hypomethylated DMRs in HSCs of _Dnmt3a_−/−, _Tet2_−/− and DKO phenotype. d) Global DNA methylation levels of all DMRs in all 4 genotypes. Each group of genotype consisted of 2 biological replicates. e) DNA methylation levels in hematopoiesis-associated enhancers in different lineages and progenitors. Enhancers (left panel) as defined by H3K27Ac marks in B cell, RBC progenitors, ST- and LT-HSCs (from ref. 43), and (right panel) their DNA methylation levels.
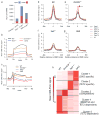
Figure 5. Hydroxymethylation (hmC) in HSCs is associated with active HSC genes and repressed RBC genes
a) Numbers of hypermethylated and hypomethylated DhMRs in HSCs of _Dnmt3a_−/−, _Tet2_−/− and DKO phenotype. b) Heat map depicting differentially hydroxylmethylated regions (DhMRs) of the 5 major dynamic DNA hydroxylmethylation alteration patterns (DhMAPs). c) Cytosine-5-methylenesulfonate (CMS) signal in HSCs displayed for DMR regions. d) CMS hmC signal in displayed in relationship to genic features. e–h) Differential CMS signal distribution in regions within the 6 major DMR classes in HSCs.
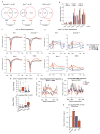
Figure 6. Hydroxymethylation (hmC) in HSCs is associated with active HSC genes and repressed RBC genes
a) Overlap between DMRs and DhMRs in _Dnmt3a_−/−, _Tet2_−/− and DKO HSCs. p value is calculated with Chi-square test. b) Relative overlap ratio of 6 different dynamic DMR patterns with 5 clusters of DhMRs in comparison with random overlap of DMR and DhMRs. The grey line indicates random DMR and DhMR global overlap ratio. Observed/Expected is plotted. c) Distribution of mC in genic regions of genes from low to high expression level in HSCs of all 4 genotypes. TSS: transcriptional start site. TTS: transcriptional termination site. d) Distribution of mC in genic regions of genes from low to high expression level in HSCs of all 4 genotypes. TSS: transcriptional start site. TTS: transcriptional termination site. e) Gene expression level (FPKM) of HSC Fingerprint genes (upper panel) analyzed in f and RBC Fingerprint genes (lower panel) analyzed in g. Each genotype group consisted of 2 biological replicates. f) hmC signal distribution on HSC-Fingerprint genes down-regulated in DKO HSCs. Each genotype group consisted of 2 biological replicates. g) hmC signal on RBC-Fingerprint genes associated with up-regulation in DKO HSCs. Each genotype consisted of 2 biological replicates. h) The hmC signal distribution of the blue shaded area from (g) containing the TSS±200bp region *, p<0.05. Student t-test.
Figure 7. DNMT3A and TET2 cooperate to prevent activation of lineage-specific transcription factors in HSCs
a) Comprehensive epigenomic dynamics at the Mpl locus in HSCs with tracks WGBS, CMS, H3K27me3 and gene expression (RNAseq). Blue shaded area shows the cluster 5 DhMR located in the gene body of Mpl. b) Comprehensive epigenomic dynamics at the Klf1 locus in HSCs. Blue shaded area shows the Type III DMR located in the promoter and 5′UTR regions of Klf1. Red shaded area shows the Cluster 4 DhMR located in the TSS and 5′UTR region in which hmC increases in _Dnmt3a_−/− HSC and decrease in _Tet2_−/− and DKO HSCs. The y axis of CMS and H3K27me3 sections shows signal of ChIP-seq occupancy in units of reads per million mapped reads per base pair (rpm/bp) in a and b. c, d) Model shows the action mode of DNMT3A and TET2 in activating HSC gene expression and repressing lineage-specific transcription factor expression.
Similar articles
- Aid is a key regulator of myeloid/erythroid differentiation and DNA methylation in hematopoietic stem/progenitor cells.
Kunimoto H, McKenney AS, Meydan C, Shank K, Nazir A, Rapaport F, Durham B, Garrett-Bakelman FE, Pronier E, Shih AH, Melnick A, Chaudhuri J, Levine RL. Kunimoto H, et al. Blood. 2017 Mar 30;129(13):1779-1790. doi: 10.1182/blood-2016-06-721977. Epub 2017 Jan 11. Blood. 2017. PMID: 28077417 Free PMC article. - Divergent Effects of Dnmt3a and Tet2 Mutations on Hematopoietic Progenitor Cell Fitness.
Ostrander EL, Kramer AC, Mallaney C, Celik H, Koh WK, Fairchild J, Haussler E, Zhang CRC, Challen GA. Ostrander EL, et al. Stem Cell Reports. 2020 Apr 14;14(4):551-560. doi: 10.1016/j.stemcr.2020.02.011. Epub 2020 Mar 26. Stem Cell Reports. 2020. PMID: 32220332 Free PMC article. - DNMT3A(R882H) mutant and Tet2 inactivation cooperate in the deregulation of DNA methylation control to induce lymphoid malignancies in mice.
Scourzic L, Couronné L, Pedersen MT, Della Valle V, Diop M, Mylonas E, Calvo J, Mouly E, Lopez CK, Martin N, Fontenay M, Bender A, Guibert S, Dubreuil P, Dessen P, Droin N, Pflumio F, Weber M, Gaulard P, Helin K, Mercher T, Bernard OA. Scourzic L, et al. Leukemia. 2016 Jun;30(6):1388-98. doi: 10.1038/leu.2016.29. Epub 2016 Feb 15. Leukemia. 2016. PMID: 26876596 Free PMC article. - TET2: A cornerstone in normal and malignant hematopoiesis.
Kunimoto H, Nakajima H. Kunimoto H, et al. Cancer Sci. 2021 Jan;112(1):31-40. doi: 10.1111/cas.14688. Epub 2020 Nov 18. Cancer Sci. 2021. PMID: 33048426 Free PMC article. Review. - Epigenetic modifiers in normal and malignant hematopoiesis.
Haladyna JN, Yamauchi T, Neff T, Bernt KM. Haladyna JN, et al. Epigenomics. 2015;7(2):301-20. doi: 10.2217/epi.14.88. Epigenomics. 2015. PMID: 25942537 Review.
Cited by
- MIR retrotransposons link the epigenome and the transcriptome of coding genes in acute myeloid leukemia.
Telonis AG, Yang Q, Huang HT, Figueroa ME. Telonis AG, et al. Nat Commun. 2022 Oct 31;13(1):6524. doi: 10.1038/s41467-022-34211-x. Nat Commun. 2022. PMID: 36316347 Free PMC article. - TET2 and DNMT3A mutations and exceptional response to 4'-thio-2'-deoxycytidine in human solid tumor models.
Yang SX, Hollingshead M, Rubinstein L, Nguyen D, Larenjeira ABA, Kinders RJ, Difilippantonio M, Doroshow JH. Yang SX, et al. J Hematol Oncol. 2021 May 26;14(1):83. doi: 10.1186/s13045-021-01091-5. J Hematol Oncol. 2021. PMID: 34039392 Free PMC article. - Impact of Epigenomic Hypermethylation at TP53 on Allogeneic Hematopoietic Cell Transplantation Outcomes for Myelodysplastic Syndromes.
Wang W, Auer P, Zhang T, Spellman S, Carlson KS, Nazha A, Bolon YT, Saber W. Wang W, et al. Transplant Cell Ther. 2021 Aug;27(8):659.e1-659.e6. doi: 10.1016/j.jtct.2021.04.027. Epub 2021 May 13. Transplant Cell Ther. 2021. PMID: 33992829 Free PMC article. - Environmental influences on clonal hematopoiesis.
King KY, Huang Y, Nakada D, Goodell MA. King KY, et al. Exp Hematol. 2020 Mar;83:66-73. doi: 10.1016/j.exphem.2019.12.005. Epub 2019 Dec 29. Exp Hematol. 2020. PMID: 31893524 Free PMC article. Review. - RNA splicing factor Rbm25 underlies heterogeneous preleukemic clonal expansion in mice.
Bramlett C, Eerdeng J, Jiang D, Lee Y, Garcia I, Vergel-Rodriguez M, Condie P, Nogalska A, Lu R. Bramlett C, et al. Blood. 2023 Jun 15;141(24):2961-2972. doi: 10.1182/blood.2023019620. Blood. 2023. PMID: 36947858 Free PMC article.
References
- Grossmann V, et al. The molecular profile of adult T-cell acute lymphoblastic leukemia: mutations in RUNX1 and DNMT3A are associated with poor prognosis in T-ALL. Genes Chromosomes Cancer. 2013;52:410–22. - PubMed
MeSH terms
Substances
Grants and funding
- R01 CA193466/CA/NCI NIH HHS/United States
- R56 DK092883/DK/NIDDK NIH HHS/United States
- S10 RR027366/RR/NCRR NIH HHS/United States
- R35 CA210043/CA/NCI NIH HHS/United States
- P50 CA126752/CA/NCI NIH HHS/United States
- P30 CA125123/CA/NCI NIH HHS/United States
- R01 CA151535/CA/NCI NIH HHS/United States
- R01 CA183252/CA/NCI NIH HHS/United States
- R01 HG007538/HG/NHGRI NIH HHS/United States
- Wellcome Trust/United Kingdom
- R01 DK092883/DK/NIDDK NIH HHS/United States
LinkOut - more resources
Full Text Sources
Other Literature Sources
Medical
Molecular Biology Databases


