Automated tilt series alignment and tomographic reconstruction in IMOD - PubMed (original) (raw)
Automated tilt series alignment and tomographic reconstruction in IMOD
David N Mastronarde et al. J Struct Biol. 2017 Feb.
Abstract
Automated tomographic reconstruction is now possible in the IMOD software package, including the merging of tomograms taken around two orthogonal axes. Several developments enable the production of high-quality tomograms. When using fiducial markers for alignment, the markers to be tracked through the series are chosen automatically; if there is an excess of markers available, a well-distributed subset is selected that is most likely to track well. Marker positions are refined by applying an edge-enhancing Sobel filter, which results in a 20% improvement in alignment error for plastic-embedded samples and 10% for frozen-hydrated samples. Robust fitting, in which outlying points are given less or no weight in computing the fitting error, is used to obtain an alignment solution, so that aberrant points from the automated tracking can have little effect on the alignment. When merging two dual-axis tomograms, the alignment between them is refined from correlations between local patches; a measure of structure was developed so that patches with insufficient structure to give accurate correlations can now be excluded automatically. We have also developed a script for running all steps in the reconstruction process with a flexible mechanism for setting parameters, and we have added a user interface for batch processing of tilt series to the Etomo program in IMOD. Batch processing is fully compatible with interactive processing and can increase efficiency even when the automation is not fully successful, because users can focus their effort on the steps that require manual intervention.
Keywords: Automated processing; Electron tomography; Tilt series alignment; Tomographic reconstruction.
Copyright © 2016 Elsevier Inc. All rights reserved.
Figures
Fig 1
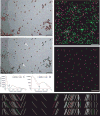
Automatic selection of seed points for fiducial tracking. (A, B) Subarea from 0° image of tilt series from frozen-hydrated cell infected with bovine papilloma virus, acquired by Mary Morphew. Scale bars are 100 nm. A shows all beads found in the first step of the procedure; B shows the ones selected for the seed model. Arrows mark some partially overlapping, paired beads that were not selected because of their elongated appearance. (C, D) Smoothed histograms of the distribution of correlation peak strengths when finding beads in the tilt series used for parts (A) and (E), respectively. Histograms are smoothed by convolving with a kernel (1 − (x/h)2)3/(0.9143 h), where h is the half-width of the kernel. A dip between two maxima is first sought in a histogram with an h of 0.2 (blue curves) then its final location (arrow) is picked in a less smoothed histogram with an h of 0.05 (red curves). The histograms in (C) are atypical in having comparable area in the two modes because of the large clumps of gold; the histograms in (D) are typical and require a logarithmic scaling to show the mode for true beads clearly. (E) Side view of bead positions tracked through the same set of 11 images, but starting with beads found at three different tilt angles. Beads present in only one or two of the tracks are shown in green and magenta, respectively. The cryo tilt series of a Giardia cell was acquired by Cindi Schwartz. (F, G) Identified beads (F) and ones selected for the seed model (G) from a 3 × 3 montaged tilt series of a high-pressure frozen, freeze-substituted SVG-A cell infected by JC polyomavirus, acquired by Kimberly Erickson. Fig. S1 shows these points overlaid on tilt series images. Scale bars are 1 μm. In (F), beads have been identified as being on the bottom (green) or top (magenta) of the section using the Z positions solved during tracking through 11 images. In (E), the selected beads are well-distributed on both surfaces.
Fig 2
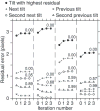
Progression of errors during the first 4 iterations of robust fitting for some incorrectly placed points in the IMOD tutorial data set. Filled circles are for points with high residual errors that were given a weight of zero in the robust fitting. Crosses and X’s are for the points from the same bead at the adjacent tilt angles; circles and triangles are from points two tilt increments away. The point at iteration 0 is the result from the non-robust fit. The number above the point at iteration 3 is the weight after that iteration, shown for all points with weights less than 1.
Fig 3
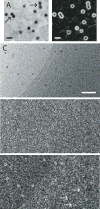
Sobel filtering to enhance edges of gold particles and allow better localization. (A) Subarea with 15-nm gold from a tilt series of Chlamydomonas acquired by Eileen O’Toole. In both cases where two beads appear to touch (arrows), they are on opposite sides of the section and appear isolated at most tilt angles. Scale bar is 25 nm. (B) Sobel filter applied to image in (A). In (A) and (B), images were captured with a zoom of 4 and pixel interpolation; the beads are actually 5.3 pixels. (C) Subarea from a tilt series of frozen-hydrated_Vibrio cholerae_ acquired by Yi-Wei Chang in Grant Jensen’s laboratory. Scale bar is 100 nm. (D) Sobel filtering of unscaled image fails shows weak signal from the beads. (E) Sobel filtering after scaling the image so that beads are 8 pixels gives a strong signal over the background and a recognizable annular signal even over the denser areas of the cell (arrows).
Fig 4
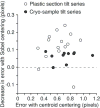
Reduction in mean residual error by refinement of positions with Sobel filtering, plotted against the mean residual of alignment solution, for tilt series from plastic sections (open circles) and frozen-hydrated samples (closed circles). The one poor result for a plastic section was observed recently and prompted a modification of Beadtrack so that it falls back to centering with the centroid when Sobel centering gives a worse mean residual.
Fig 5
Detection of structure to automate the alignment of tomograms from tilt series taken around two axes. (A) X/Y slice through tomogram for one axis, acquired by Mary Morphew from a high-pressure frozen, freeze substituted melanoma cell. The boundary contour was drawn to exclude regions without sufficient structure for correlations between the two tomograms. Density is shown as positive to match the polarity of the SD display in (B). (B) X/Z slice through the middle of a volume of local standard deviations, where each voxel has the SD of an 8 × 8 × 2 box of voxels after binning the tomogram isotropically by 4, and the boxes are spaced 4 × 4 × 1 voxels apart. The rectangle indicates the size of a patch that would be correlated in 3D between the two tomograms. (C) Corresponding X/Z slice through the tomogram. (D) Distribution of box SD values from the unbinned and binned tomograms, showing better separation between the modes representing background and structure with binning by 4. The arrow indicates the threshold that would be chosen between structure and background. (E, F) 3-D displays of the tomographic volume showing the vectors of local shifts between the two volumes; lengths are exaggerated by 5. (E) Shifts between patches when correlating with neither the boundary contour model nor limits in Z as constraints (F) Shifts when the correlation search program skips all patches with a structure score of less than 50%. All scale bars are 200 nm.
Fig 6
Structure detection for finding specimen surfaces. (A) Boundary points found by Findsection for an X/Z slice through a tomogram of a budding yeast mitotic cell acquired by Janet Meehl. The various robust procedures described in the text succeeded in excluding gold particles. A model like this is needed for flattening such a highly warped section, and starting with a model from Findsection greatly reduces the labor of preparing such a model. (B, C) X/Z slices through a tomogram of frozen-hydrated bovine papilloma virus, acquired by Mary Morphew. (D, E) Corresponding slices through a volume of box SDs. Arrows indicate the apparent surfaces of the ice. The virus particles show up clearly enough, but the ray artifacts extending outside the ice from the clump of gold in C have comparable strength and dominate the box SD values in (E). (F) Isosurface display of the box SD volume at a threshold that shows the virus particles. The volume has been rotated in X and Y to make the ice surfaces parallel to the direction of view. (G, H) Slices through a box SD volume from a tomogram generated after erasing gold and other high densities from the tilt series images. (I) Isosurface display of the erased volume, at a threshold that shows the surface of the ice. All scale bars are 200 nm.
Fig 7
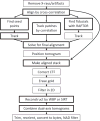
Steps in tilt series processing automated by the program Batchruntomo. The available alternative alignment pathways are shows. Boxes are drawn lighter for optional steps than for required ones. WBP is weighted back-projection, SIRT is Simultaneous Iterative Reconstruction Technique (Gilbert, 1972), NAD is nonlinear anisotropic diffusion (Frangakis and Hegerl, 2001), and CTF correction refers to measuring defocus and correcting the phases from the microscope contrast transfer function (Xiong et al., 2009).
Fig 8
Three tabs of the batch interface in the Etomo program. (A) The Stacks tab allows one to enter the tilt series to process and set some basic properties of them. (B) The Dataset Values tab presents the choices and most commonly needed parameters for processing. (C) The Run tab has a Resources table at the top for selecting computer cores and graphics processors to use, choices for stopping and restarting all data sets at certain points, and a table showing the status of each data set.
Similar articles
- Automated fiducial-based alignment of cryo-electron tomography tilt series in Dynamo.
Coray R, Navarro P, Scaramuzza S, Stahlberg H, Castaño-Díez D. Coray R, et al. Structure. 2024 Oct 3;32(10):1808-1819.e4. doi: 10.1016/j.str.2024.07.003. Epub 2024 Jul 29. Structure. 2024. PMID: 39079528 - A novel fully automatic scheme for fiducial marker-based alignment in electron tomography.
Han R, Wang L, Liu Z, Sun F, Zhang F. Han R, et al. J Struct Biol. 2015 Dec;192(3):403-417. doi: 10.1016/j.jsb.2015.09.022. Epub 2015 Oct 1. J Struct Biol. 2015. PMID: 26433028 - Alignator: a GPU powered software package for robust fiducial-less alignment of cryo tilt-series.
Castaño-Díez D, Scheffer M, Al-Amoudi A, Frangakis AS. Castaño-Díez D, et al. J Struct Biol. 2010 Apr;170(1):117-26. doi: 10.1016/j.jsb.2010.01.014. Epub 2010 Feb 1. J Struct Biol. 2010. PMID: 20117216 - Subtomogram averaging from cryo-electron tomograms.
Leigh KE, Navarro PP, Scaramuzza S, Chen W, Zhang Y, Castaño-Díez D, Kudryashev M. Leigh KE, et al. Methods Cell Biol. 2019;152:217-259. doi: 10.1016/bs.mcb.2019.04.003. Epub 2019 May 15. Methods Cell Biol. 2019. PMID: 31326022 Review. - Cryo-Electron Tomography and Subtomogram Averaging.
Wan W, Briggs JA. Wan W, et al. Methods Enzymol. 2016;579:329-67. doi: 10.1016/bs.mie.2016.04.014. Epub 2016 Jun 22. Methods Enzymol. 2016. PMID: 27572733 Review.
Cited by
- Stable coexistence between an archaeal virus and the dominant methanogen of the human gut.
Baquero DP, Medvedeva S, Martin-Gallausiaux C, Pende N, Sartori-Rupp A, Tachon S, Pedron T, Debarbieux L, Borrel G, Gribaldo S, Krupovic M. Baquero DP, et al. Nat Commun. 2024 Sep 4;15(1):7702. doi: 10.1038/s41467-024-51946-x. Nat Commun. 2024. PMID: 39231967 Free PMC article. - Infection-induced peripheral mitochondria fission drives ER encapsulations and inter-mitochondria contacts that rescue bioenergetics.
Hofstadter WA, Cook KC, Tsopurashvili E, Gebauer R, Pražák V, Machala EA, Park JW, Grünewald K, Quemin ERJ, Cristea IM. Hofstadter WA, et al. Nat Commun. 2024 Aug 27;15(1):7352. doi: 10.1038/s41467-024-51680-4. Nat Commun. 2024. PMID: 39187492 Free PMC article. - Cryo-Electron Tomography of Reconstituted Biomolecular Condensates.
Tollervey F, Zhang X, Bose M, Sachweh J, Woodruff JB, Franzmann TM, Mahamid J. Tollervey F, et al. Methods Mol Biol. 2023;2563:297-324. doi: 10.1007/978-1-0716-2663-4_15. Methods Mol Biol. 2023. PMID: 36227480 - The Evolution of Interdependence in a Four-Way Mealybug Symbiosis.
Garber AI, Kupper M, Laetsch DR, Weldon SR, Ladinsky MS, Bjorkman PJ, McCutcheon JP. Garber AI, et al. Genome Biol Evol. 2021 Aug 3;13(8):evab123. doi: 10.1093/gbe/evab123. Genome Biol Evol. 2021. PMID: 34061185 Free PMC article. - Structure and activity of particulate methane monooxygenase arrays in methanotrophs.
Zhu Y, Koo CW, Cassidy CK, Spink MC, Ni T, Zanetti-Domingues LC, Bateman B, Martin-Fernandez ML, Shen J, Sheng Y, Song Y, Yang Z, Rosenzweig AC, Zhang P. Zhu Y, et al. Nat Commun. 2022 Sep 5;13(1):5221. doi: 10.1038/s41467-022-32752-9. Nat Commun. 2022. PMID: 36064719 Free PMC article.
References
- Amat F, Moussavi F, Comolli LR, Elidan G, Downing KH, Horowitz M. Markov random field based automatic image alignment for electron tomography. J Struct Biol. 2008;161:260–275. - PubMed
- Asano S, Engel BD, Baumeister W. In Situ Cryo-Electron Tomography: A Post-Reductionist Approach to Structural Biology. Journal of molecular biology. 2016;428:332–343. - PubMed
- Beaton AE, Tukey JW. The fitting of power series, meaning polynomials, illustrated on band-spectroscopic data. Technometrics. 1974;16:147–185.
- Brandt S, Heikkonen J, Engelhardt P. Automatic alignment of transmission electron microscope tilt series without fiducial markers. Journal of structural biology. 2001;136:201–213. - PubMed
Publication types
MeSH terms
LinkOut - more resources
Full Text Sources
Other Literature Sources
