An evolutionarily conserved pathway controls proteasome homeostasis - PubMed (original) (raw)
An evolutionarily conserved pathway controls proteasome homeostasis
Adrien Rousseau et al. Nature. 2016.
Abstract
The proteasome is essential for the selective degradation of most cellular proteins, but how cells maintain adequate amounts of proteasome is unclear. Here we show that there is an evolutionarily conserved signalling pathway controlling proteasome homeostasis. Central to this pathway is TORC1, the inhibition of which induced all known yeast 19S regulatory particle assembly-chaperones (RACs), as well as proteasome subunits. Downstream of TORC1 inhibition, the yeast mitogen-activated protein kinase, Mpk1, acts to increase the supply of RACs and proteasome subunits under challenging conditions in order to maintain proteasomal degradation and cell viability. This adaptive pathway was evolutionarily conserved, with mTOR and ERK5 controlling the levels of the four mammalian RACs and proteasome abundance. Thus, the central growth and stress controllers, TORC1 and Mpk1/ERK5, endow cells with a rapid and vital adaptive response to adjust proteasome abundance in response to the rising needs of cells. Enhancing this pathway may be a useful therapeutic approach for diseases resulting from impaired proteasomal degradation.
Conflict of interest statement
Author Information The authors declare no competing financial interests.
Figures
Extended Data Figure 1. Adc17 induction is increased in mrs6-DAmp cells and occurs when Sfp1 is cytosolic.
a, Immunoblots of the indicated proteins in lysates of WT and Mrs6-hypomorphic (mrs6-DAmP) strains ± 5 µg/ml tunicamycin (Tm) for 4 hours. b, Representative images of yeast cells carrying a GFP-tagged SFP1 at the endogenous locus, ±5 µg/ml tunicamycin (Tm) for 4 hours. Scale bar: 5 µm. Representative results of at least three independent experiments (biological replicates) are shown.
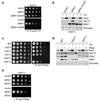
Extended Data Figure 2. Mpk1 is essential for tunicamycin and rapamycin survival and Adc17 induction.
a, mpk1Δ cells transformed with wild-type MPK1 or a kinase-dead allele (MPK1-K52R) or empty vector were spotted in a 6-fold dilution and grown on plates containing or lacking tunicamycin (Tm). b, Immunoblots of lysates of strains shown in (a), cultured for 4 hours ± 5 µg/ml Tm. c, Cells of the indicated genotype were spotted in a 6-fold dilution and grown for 3 days at 30°C on plates containing or lacking rapamycin (Rapa). d, Immunoblots of lysates from wild-type (WT) and MAPK gene-deletion mutant cells cultured for 4 hours ± 5 µg/ml Tm or 0.2 µg/ml Rapa. e, Same as in (a) using mpk1Δ cells transformed with empty vector or a vector encoding MPK1 or HOG1. Representative results of at least three independent experiments (biological replicates) are shown.
Extended Data Figure 3. Mpk1 MAPK pathway is essential for stress-mediated RACs induction.
a and b, Immunoblots of the indicated proteins in lysates of wild-type (WT) cells ± 5 µg/ml tunicamycin (Tm) (a) or 0.2 µg/ml rapamycin (Rapa) (b) for the indicated time. c and g, Immunoblots of the indicated proteins in lysates of WT and _bck1_Δ cells cultured ± 5 µg/ml Tm or 0.2 µg/ml Rapa for 4 hours. d and h, Immunoblots of the indicated proteins in lysates of WT and mkk1/2Δ cells cultured ± 5 µg/ml Tm or 0.2 µg/ml Rapa for 4 hours. e and f, Immunoblots of the indicated proteins in lysates of WT or mpk1Δ cells ± 50 µg/ml Congo red (CR) for 4 hours. Representative results of at least three independent experiments (biological replicates) are shown.
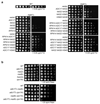
Extended Data Figure 4. Induction of RACs under challenging conditions is an important function of Mpk1.
a, WT cells or mpk1Δ cells transformed with one or combinations of two or three RACs were spotted in a 6-fold dilution and grown on plates containing or lacking Tm, where indicated. b, Multiple-deletion strains of different RACs were spotted in a 6-fold dilution and grown on plates containing or lacking rapamycin (Rapa). Representative results of at least three independent experiments (biological replicates) are shown.
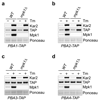
Extended Data Figure 5. Pba1-2 are induced by tunicamycin in a Mpk1-independent manner.
a-d, Immunoblots of the indicated proteins in lysates of WT cells carrying a TAP-tagged Pba1 (a), Pba2 (b), Pba3 (c) and Pba4 (d) at the endogenous locus ± 5 µg/ml tunicamycin (Tm) for 3 hours. Representative results of at least three independent experiments (biological replicates) are shown.
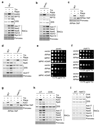
Extended Data Figure 6. Mpk1 regulates proteasome subunits and RACs post-transcriptionally.
a and b, Immunoblots of the indicated proteins in lysates of wild-type (WT) (a) and rpn4Δ (b) cells ± 5 µg/ml tunicamycin (Tm) or 0.2 µg/ml rapamycin (Rapa) for 4 hours. c, Immunoblots of the indicated proteins in lysates of WT cells carrying a TAP-tagged RPN4 at the endogenous locus ± 5 µg/ml tunicamycin (Tm) or 0.2 µg/ml rapamycin (Rapa) for 4 hours. d, Immunoblots of the indicated proteins in lysates of wild-type (WT) and mpk1Δ cells ± 5 µg/ml Tm or 0.2 µg/ml Rapa for 4 hours. e, rpn4Δ cells transformed with RPN4, MPK1, a kinase-dead allele of MPK1 (MPK1-K52R) or empty vector were spotted in a 6-fold dilution and grown on plates containing or lacking tunicamycin (Tm). f, mpk1Δ cells transformed with MPK1, RPN4 or empty vector were spotted in a 6-fold dilution and grown on plates containing or lacking tunicamycin (Tm) where indicated. g, Immunoblots of the indicated proteins in lysates of WT and mpk1Δ cells carrying a TAP-tagged RPN4 at the endogenous locus ± 5 µg/ml Tm or 0.2 µg/ml Rapa for 4 hours. h and i, Immunoblots of the indicated proteins in lysates of WT (h and i) and mpk1Δ (i) cells treated with different combinations of drugs: 5 µg/ml Tm, 0.2 µg/ml Rapa and 35 µg/ml cycloheximide (CHX), where indicated for 4 hours. Representative results of at least three independent experiments (biological replicates) are shown.
Extended Data Figure 7. Mpk1 maintains the adequate levels of proteasome required to sustain protein degradation.
a and c, Cells of the indicated genotype expressing GFP-tagged Ura3-3 proteins were treated with cycloheximide and incubated at 37°C for the indicated time. b and d, Quantifications from three independent experiments (biological replicates) such as the one shown in (a and c). e and g, Cells of the indicated genotype expressing CPY*-HA (e) or Δss-CPY*-GFP (g) proteins were treated with tunicamycin (Tm) for 4 hours. f and h, Quantifications from three independent experiments (biological replicates) such as the one shown in (e and g). i and k, Cells of the indicated genotype expressing CPY*-HA (i) or Δss-CPY*-GFP (k) proteins were treated with rapamycin (Rapa) for 4 hours. j and l, Quantifications from three independent experiments (biological replicates) such as the one shown in (i and k). b, d, f, h, j and l, Data are means ± SD. n=3 biological replicates. *P≤0.05; **P≤0.01; ***P≤0.001; n.s., not significant (two-way ANOVA).
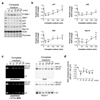
Extended Data Figure 8. Starvation inhibits TORC1 signaling, induces mammalian RACs and increases proteasome abundance.
a and b, Immunoblots (a) and quantification (b) of the indicated proteins in lysates of HeLa cells after EBSS treatment for the indicated time. c, HeLa cell extracts following EBSS treatment for the indicated time were resolved on Native-PAGE (4.2%) and revealed with the fluorogenic substrate Suc-LLVY-AMC or by immunoblots. d, Quantification of the 26S proteasome activity (RPCP and RP2CP) of experiments such as the one shown in (c). b and d, Data are means ± SD. n=3 biological replicates. *P≤0.05; **P≤0.01; ***P≤0.001; n.s., not significant (one-way ANOVA). Representative results of at least three independent experiments (biological replicates) are shown.
Extended Data Figure 9. TORC1 activation by nutrient replenishment decreases the abundance of RACs as well as 26S proteasome.
a and b, Immunoblots (a) and quantification (b) of the indicated proteins in lysates of HeLa cells after replenishment with rich complete medium for the indicated time. c, Native-PAGE (4.2%) of cell extracts from HeLa cells following media replenishment as in (a), revealed with the fluorogenic substrate Suc-LLVY-AMC or by immunoblots. d, Quantification of the 26S proteasome activity (RPCP and RP2CP) of experiments such as the one shown in (c). b and d, Data are means ± SD. n=3 biological replicates. *P≤0.05; **P≤0.01; ***P≤0.001; n.s., not significant (one-way ANOVA). Representative results of at least three independent experiments (biological replicates) are shown.
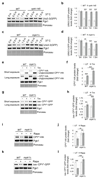
Extended Data Figure 10. mTORC1 inhibition by Torin-1 and rapamycin acutely induced the RACs.
a and b, Immunoblots (a) and quantification (b) of the indicated proteins in lysates of HeLa cells treated with 250 nM Torin-1 or 200 nM rapamycin for the indicated time. Data are means ± SD. n=3 biological replicates. *P≤0.05; **P≤0.01; ***P≤0.001; n.s., not significant (two-way ANOVA). Representative results of at least three independent experiments (biological replicates) are shown.
Figure 1. TORC1 inhibition induces the proteasome assembly chaperone Adc17 and increases proteasome levels.
a-c, Immunoblots of lysates from cells treated ± 5 µg/ml tunicamycin (Tm) for 4 hours. d, Immunoblots of lysates from cells treated ± 0.2 µg/ml rapamycin (Rapa) for 4 hours. e, Immunoblots of cell lysates after treatment ± 5 µg/ml Tm or 0.2 µg/ml Rapa for 4 hours. f, Cartoon depicting the relationship between Sfp1, TORC1 and Adc17. g, Immunoblots from cells cultured at 30 or 37°C for 4 hours. h, Native-PAGE (4.2%) of yeast extracts from cells treated with 5 µg/ml Tm or 0.2 µg/ml Rapa, revealed with the fluorogenic substrate Suc-LLVY-AMC and by immunoblots. i, Quantification of the 26S proteasome activity (RP-CP and RP2-CP) in four independent experiments such as the one shown in (h). Data are means ± SD; n = 4 biological replicates. ***P≤0.001; n.s., not significant (one-way ANOVA).
Figure 2. The MAPK Mpk1 is a master regulator of the stress-inducible proteasome assembly chaperone Adc17.
a and b, Cells spotted in a 6-fold dilution and grown for 3 days on plates ± tunicamycin (Tm). c, Immunoblots from cells grown ± 5 µg/ml Tm for 4 hours. d and f, Cells transformed with empty vector or with MPK1 or HOG1 spotted in a 6-fold dilution and grown on plates ± 0.75 µg/ml Tm for 3 days. e and g, Immunoblots of lysates from cells grown ± 5 µg/ml Tm for 4 hours. h, Cartoon depicting the signalling pathway to Adc17.
Figure 3. Mpk1 coordinates the expression of all yeast RACs to control proteasome abundance.
a, Immunoblots of lysates from cells cultured ± 5 µg/ml tunicamycin (Tm) or 0.2 µg/ml rapamycin (Rapa) for 4 hours. b, Native-PAGE (4.2%) of yeast cells cultured ± 5 µg/ml Tm or 0.2 µg/ml Rapa, revealed with Suc-LLVY-AMC and by immunoblots. Rpt5i (Rpt5 intermediates). c and d, Quantifications from experiments as in (b). Data are means ± SD of four biological replicates. **P≤0.01; ***P≤0.001; n.s., not significant (two-way ANOVA). e, Immunoblots from lysates of cells cultured ± 5 µg/ml Tm or 0.2 µg/ml Rapa for 4 hours. f, Immunoblots from lysates of cells cultured at 30 or 37°C for 4 hours. g, As in (e).
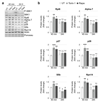
Figure 4. Post-transcriptional control of RAC and proteasome subunit abundance by Mpk1
a, Relative abundance of the indicated proteins in cells treated with rapamycin (Rapa) for 4 hours relative to untreated cells. b, Relative abundance of the indicated mRNA in cells treated with Rapa for 2 hours relative to untreated cells. rpl18a is used as a control. a and b, Data are means ± SD; n=3 biological replicates. *P≤0.05, **P≤0.01; n.s., not significant (two-way ANOVA).
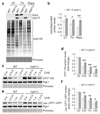
Figure 5. Mpk1 adjusts proteasome degradation to match the needs.
a, Immunoblots of lysates of cells cultured ± 5 µg/ml tunicamycin (Tm) or 0.2 µg/ml rapamycin (Rapa) for 4 hours. Poly-Ub: polyubiquitinated conjugates. c and e, Immunoblots from lysates of cells expressing CPY*-HA (c) or Δss-CPY*-GFP (e) treated with 35 µg/ml cycloheximide (CHX) for the indicated time. (b, d, f) Quantification of (a, c, e), respectively. Data are means ± SD; n=4 (b) and n=3 (d and f) biological replicates.*P≤0.05; **P≤0.01; ***P≤0.001; n.s., not significant (two-way ANOVA).
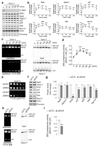
Figure 6. Evolutionary conservation of the pathway controlling RACs and proteasome abundance.
a and b, Immunoblots (a) and quantifications (b) of the indicated proteins in lysates of HeLa cells treated with 250 nM Torin-1 for the indicated time. c and d, Native-PAGE (4.2%) (c) and quantifications (d) of HeLa cell lysates following treatment as in (a) and revealed with Suc-LLVY-AMC and by immunoblots. e, mpk1Δ cells transformed with a plasmid encoding the human Erk5 or an empty vector were spotted in a 6-fold dilution and grown on plates ± Tm for 3 days. f and g, Immunoblots (f) and quantifications (g) of the indicated proteins in lysates of HeLa cells 3 days after transfection with a non-target siRNA (siCTL) or a siRNA targeting Erk5 (siErk5). h and i, Native-PAGE (4.2%) (h) and quantifications (i) of HeLa cell extracts 3 days after transfection with siCTL or siErk5 revealed with Suc-LLVY-AMC or by immunoblots. (b, d, g, i) Data are means ± SD; n=3 biological replicates. *P≤0.05; **P≤0.01; ***P≤0.001; n.s., not significant (b and d, one-way ANOVA; g, two-way ANOVA; i, two-tailed Student’s t-test).
Comment in
- Cell biology: The TORC1 pathway to protein destruction.
Chantranupong L, Sabatini DM. Chantranupong L, et al. Nature. 2016 Aug 11;536(7615):155-6. doi: 10.1038/nature18919. Epub 2016 Jul 27. Nature. 2016. PMID: 27462809 No abstract available.
Similar articles
- Distinct TORC1 signalling branches regulate Adc17 proteasome assembly chaperone expression.
Williams TD, Joshua I, Soubigou F, Dublanska SM, Bergquist R, Rousseau A. Williams TD, et al. J Cell Sci. 2024 Jul 15;137(14):jcs261892. doi: 10.1242/jcs.261892. Epub 2024 Jul 22. J Cell Sci. 2024. PMID: 38949052 Free PMC article. - Synergistic effects of TOR and proteasome pathways on the yeast transcriptome and cell growth.
Zhang N, Quan Z, Rash B, Oliver SG. Zhang N, et al. Open Biol. 2013 May 22;3(5):120137. doi: 10.1098/rsob.120137. Open Biol. 2013. PMID: 23697803 Free PMC article. - Expressed in the yeast Saccharomyces cerevisiae, human ERK5 is a client of the Hsp90 chaperone that complements loss of the Slt2p (Mpk1p) cell integrity stress-activated protein kinase.
Truman AW, Millson SH, Nuttall JM, King V, Mollapour M, Prodromou C, Pearl LH, Piper PW. Truman AW, et al. Eukaryot Cell. 2006 Nov;5(11):1914-24. doi: 10.1128/EC.00263-06. Epub 2006 Sep 1. Eukaryot Cell. 2006. PMID: 16950928 Free PMC article. - Regulation of proteasome assembly and activity in health and disease.
Rousseau A, Bertolotti A. Rousseau A, et al. Nat Rev Mol Cell Biol. 2018 Nov;19(11):697-712. doi: 10.1038/s41580-018-0040-z. Nat Rev Mol Cell Biol. 2018. PMID: 30065390 Review. - Molecular mechanisms of proteasome assembly.
Murata S, Yashiroda H, Tanaka K. Murata S, et al. Nat Rev Mol Cell Biol. 2009 Feb;10(2):104-15. doi: 10.1038/nrm2630. Nat Rev Mol Cell Biol. 2009. PMID: 19165213 Review.
Cited by
- Cell biology: The TORC1 pathway to protein destruction.
Chantranupong L, Sabatini DM. Chantranupong L, et al. Nature. 2016 Aug 11;536(7615):155-6. doi: 10.1038/nature18919. Epub 2016 Jul 27. Nature. 2016. PMID: 27462809 No abstract available. - The ribosome-associated chaperone Zuo1 controls translation upon TORC1 inhibition.
Black A, Williams TD, Soubigou F, Joshua IM, Zhou H, Lamoliatte F, Rousseau A. Black A, et al. EMBO J. 2023 Dec 11;42(24):e113240. doi: 10.15252/embj.2022113240. Epub 2023 Nov 20. EMBO J. 2023. PMID: 37984430 Free PMC article. - mTOR and Tumor Cachexia.
Duval AP, Jeanneret C, Santoro T, Dormond O. Duval AP, et al. Int J Mol Sci. 2018 Jul 30;19(8):2225. doi: 10.3390/ijms19082225. Int J Mol Sci. 2018. PMID: 30061533 Free PMC article. Review. - Protein misfolding in neurodegenerative diseases: implications and strategies.
Sweeney P, Park H, Baumann M, Dunlop J, Frydman J, Kopito R, McCampbell A, Leblanc G, Venkateswaran A, Nurmi A, Hodgson R. Sweeney P, et al. Transl Neurodegener. 2017 Mar 13;6:6. doi: 10.1186/s40035-017-0077-5. eCollection 2017. Transl Neurodegener. 2017. PMID: 28293421 Free PMC article. Review. - Structural basis of human 20S proteasome biogenesis.
Zhang H, Zhou C, Mohammad Z, Zhao J. Zhang H, et al. Nat Commun. 2024 Sep 18;15(1):8184. doi: 10.1038/s41467-024-52513-0. Nat Commun. 2024. PMID: 39294158 Free PMC article.
References
- Goldberg AL. Functions of the proteasome: from protein degradation and immune surveillance to cancer therapy. Biochem Soc Trans. 2007;35:12–17. - PubMed
- Tanaka K, Mizushima T, Saeki Y. The proteasome: molecular machinery and pathophysiological roles. Biol Chem. 2012;393:217–234. - PubMed
- Le Tallec B, Barrault MB, Guerois R, Carre T, Peyroche A. Hsm3/S5b participates in the assembly pathway of the 19S regulatory particle of the proteasome. Mol Cell. 2009;33:389–399. - PubMed
Publication types
MeSH terms
Substances
LinkOut - more resources
Full Text Sources
Other Literature Sources
Molecular Biology Databases
Miscellaneous

