Clathrin-coat disassembly illuminates the mechanisms of Hsp70 force generation - PubMed (original) (raw)
Clathrin-coat disassembly illuminates the mechanisms of Hsp70 force generation
Rui Sousa et al. Nat Struct Mol Biol. 2016 Sep.
Abstract
Hsp70s use ATP hydrolysis to disrupt protein-protein associations and to move macromolecules. One example is the Hsc70- mediated disassembly of the clathrin coats that form on vesicles during endocytosis. Here, we exploited the exceptional features of these coats to test three models-Brownian ratchet, power-stroke and entropic pulling-proposed to explain how Hsp70s transform their substrates. Our data rule out the ratchet and power-stroke models and instead support a collision-pressure mechanism whereby collisions between clathrin-coat walls and Hsc70s drive coats apart. Collision pressure is the complement to the pulling force described in the entropic pulling model. We also found that self-association augments collision pressure, thereby allowing disassembly of clathrin lattices that have been predicted to be resistant to disassembly. These results illuminate how Hsp70s generate the forces that transform their substrates.
Figures
Figure 1. Structural context of approaches to test Hsc70 disassembly mechanisms
A: Cut-away view of clathrin cage (interior surface in cyan; exterior in yellow/orange) with auxilin (magenta; pdb 1XI5). C-termini of CHCs form a helical tripod (red) under each vertex. B: Expanded view of boxed region from A. Hsc70 (pdb 4B9Q; blue) modeled into the clathrin:auxilin cage based on an Hsp70 NBD:auxilin J domain structure positions its protein binding domain (PBD) to bind the terminal tail (red circles with Hsc70 binding QLMLT sequence in green). C: Sequences of the termini of the CHCs used (#1 is WT), with helical segments in red, and Hsc70 binding and FLAG sites in magenta.
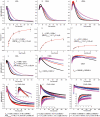
Figure 2. Moving the Hsc70 binding site slows disassembly and reveals a reaction intermediate of large scattering amplitude, and replacing it with a FLAG-tag allows disassembly by anti-FLAG Fabs
A: Scattering (normalized to starting value of 1) vs. time for reactions with WT (+0AA) cages reacted with 0.25 (magenta), 0.5 (blue), 1.0 (red) or 2.0 (black) μM Hsc70. B: As in A, but with Hsc70 binding site moved 10 AA downstream (+10AA). C: As in A, but with site moved 25 AA (+25AA). D: Hyperbolic fits of WT cage disassembly rates vs. [Hsc70]. E: As in D, but for +10AA cages. F: As in D, but for +25AA cages. G: As in A, but using Hsc70ΔC. H: As in G, but with +10AA cages. I: As in G, but with +25AA cages. J: As in A, but using anti-FLAG Fab and cages with Hsc70 binding site replaced with a FLAG tag. K: As in J, but with tag shifted 10AA. L: As in J, but with tag moved 25 AA. In J–L, insets show initial 10 sec. of reactions to resolve Fab binding phase. For all plots, trace thickness, error bars and fitted values in figs 2, 3, 5 and 6 reflect +/− sem. The number of replicates for each experimental condition in these figures is specified in Supplemental Table 2.
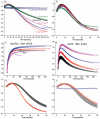
Figure 3. Hsc70 binding to cages under conditions that block disassembly leads to a massive increase in light scattering
A: Hsc70 reacted with cages at pH 6.0; other conditions as in fig. 2A; AU=Arbitrary Units. Also plotted are reactions without Hsc70 (green), with 2 μM Hsc70 but no ATP (purple), without auxilin (indigo) or absent ATP and auxilin (dark blue). B: As in A, but with +10 AA cages. C: As in A, but with +25AA cages. D: As in A, but with FLAG cages and Fab (inset shows first 5 sec of reaction). E: As in D, but with tag moved 10 AA. F: As in D, but with tag moved 25 AA. G: As in A but using Hsc70ΔC. H: As in G but with +25AA cages. I. Calculated scattering of 70 nm diameter cages bound by the indicated number of protomers per triskelion of either Hsc70 (black squares), Hsc70ΔC (blue triangles), or Fab (red circles).
Figure 4. CryoEM reconstructions of cages with or without Hsc70ΔC or Hsc70
A: Partially transparent cage image reconstructed previously by Xing et al., with difference density attributable to Hsc70ΔC [(Cages+Hsc70ΔC)-(Cages)] in gold. B. Partially transparent cage image from our reconstructions with difference density attributable to Hsc70ΔC in red. C. Partially transparent cage image from our reconstructions with difference density attributable to Hsc70 in green. In each image the bulk of the difference density is centered under each cage vertex and highlighted by being circled in blue. Cage dimensions +/− Hsc70ΔC or Hsc70 (+/− 40 Å) are specified under each image. D–F: Two orthogonal views of the ribbon model of the asymmetric unit of the clathrin cage (pdb 1XI4) with the difference density attributable to Hsc70ΔC from previous reconstructions (D; gold), our reconstruction with Hsc70ΔC (E; red), or our reconstructions with Hsc70 (F; green) shown. View is from inside the cage centered on a vertex. The Hsc70ΔC density is similarly sized and positioned in both our reconstruction and the previous one, and can accommodate one 25 kD Hsc70 PBD (docked in the volume; pdb 1DKX). Hsc70 density is similarly positioned but ~2× as large and able to accommodate 2×25 kD PBDs (indicated by blue and magenta arrows).
Figure 5. Scattering increases due to Hsc70 binding reflect multiple Hsc70s binding per CHC, not cage expansion
A. SDS PAGE of pellets of the indicated cages incubated with 1, 3, or 9 μM Hsc70 (lanes 1–9) or Hsc70ΔC (lanes 10–18; [Hsc70] and [Hsc70ΔC] increase from left to right as indicated). Lanes 19–24 show experiments without cages. B: As in A, but using FLAG cages and Fab (lanes 10–12 are no cage control). C: Hsc70/CHC or Hsc70ΔC/CHC ratios plotted vs. [Hsc70] or [Hsc70ΔC], as indicated. D: As in C, but using FLAG cages and Fab.
Figure 6. Accumulation of Hsc70 association with cages drives their disassembly and Hsc70 self-association augments its cage disassembly force
A: Reactions carried out as in panel 2A, but with only 20 nM Hsc70 and either 0 (black trace), 0.1 μM (red), 0.3 μM (blue), 0.9 μM (magenta) or 2.7 μM (green) Hsp110. The dark blue trace shows a reaction with no Hsc70 and 2.7 μM Hsp110. B: As in panel A but with 250 nM Hsc70. C: Reactions with +0AA cages at pH 6 carried out as in panel 4A, but with the indicated concentrations of Hsc70ΔC. D: As in C, but using Hsc70. E: Cage disassembly by 125 nM His-tagged Hsc70 in the presence (red) or absence (black) of 125 nM anti-His Fab. F: Red and black traces as in panel E but using untagged Hsc70; blue trace shows reaction of cages with anti-His Fab and no Hsc70. Experiments in panels E and F used recombinant GST-auxilin (with GST cleaved post-purification) and clathrin purified from bovine brain clathrin coated vesicles rather than recombinant his-tagged auxilin and CHC to eliminate complications due to Fab binding to auxilin or CHC.
Fig. 7. Hsc70 binding makes cages less compressible but more prone to catastrophic deformations
A: Collision pressure model analogizes cages and cages+Hsc70 to balloons inflated to low and high pressure, respectively. Internal pressure generated by Hsc70s makes cages less deformable, but more prone to catastrophic deformation (bursting) especially as probing force is increased. B: Percent of cages +/− Hsc70 exhibiting indicated mean compressions with 100 pN force (mean compression for each cage is determined from 9–12 measurements obtained from probing each cage on a 3×3 or 4×4 grid, depending on cage size). C: As in B, but using a 200 pN tip force. D: Percent of cages exhibiting indicated maximum compressions during probing. Average max compressions for cage populations with max compressions <30 nm or >30nM are given (statistics in supplemental table 3).
Figure 8. General model for Hsp70 mechano-chemical cycle
Step 1: J co-chaperone loads Hsp70 on substrate, close to a structural wall where entropic pulling/pushing forces are strongest. Step 2: Collisions/repulsion between Hsp70 and the wall push Hsp70 and the associated substrate away from the wall, but with increasing distance the repulsive interactions, frequency of collisions and force diminish so movement stalls (the F vs. d exponential decay curve is adapted from). Step 3: A NEF unloads Hsp70 from the stalled position, allowing J to again load an Hsp70 close to the wall so the cycle can continue. Step 1b: If the substrate does not yield to the force exerted by a single Hsp70 then the Hsp70 persists near the J co-chaperone, allowing the latter to load additional Hsp70s onto the first so as to augment the force that is generated.
Similar articles
- Key interactions for clathrin coat stability.
Böcking T, Aguet F, Rapoport I, Banzhaf M, Yu A, Zeeh JC, Kirchhausen T. Böcking T, et al. Structure. 2014 Jun 10;22(6):819-29. doi: 10.1016/j.str.2014.04.002. Epub 2014 May 8. Structure. 2014. PMID: 24815030 Free PMC article. - A motif in the clathrin heavy chain required for the Hsc70/auxilin uncoating reaction.
Rapoport I, Boll W, Yu A, Böcking T, Kirchhausen T. Rapoport I, et al. Mol Biol Cell. 2008 Jan;19(1):405-13. doi: 10.1091/mbc.e07-09-0870. Epub 2007 Oct 31. Mol Biol Cell. 2008. PMID: 17978091 Free PMC article. - Structure of an auxilin-bound clathrin coat and its implications for the mechanism of uncoating.
Fotin A, Cheng Y, Grigorieff N, Walz T, Harrison SC, Kirchhausen T. Fotin A, et al. Nature. 2004 Dec 2;432(7017):649-53. doi: 10.1038/nature03078. Epub 2004 Oct 24. Nature. 2004. PMID: 15502813 - The Physics of Entropic Pulling: A Novel Model for the Hsp70 Motor Mechanism.
Sousa R, Lafer EM. Sousa R, et al. Int J Mol Sci. 2019 May 11;20(9):2334. doi: 10.3390/ijms20092334. Int J Mol Sci. 2019. PMID: 31083504 Free PMC article. Review. - The mechanism of Hsp70 chaperones: (entropic) pulling the models together.
Goloubinoff P, De Los Rios P. Goloubinoff P, et al. Trends Biochem Sci. 2007 Aug;32(8):372-80. doi: 10.1016/j.tibs.2007.06.008. Epub 2007 Jul 12. Trends Biochem Sci. 2007. PMID: 17629485 Review.
Cited by
- Hsp70 at the membrane: driving protein translocation.
Craig EA. Craig EA. BMC Biol. 2018 Jan 17;16(1):11. doi: 10.1186/s12915-017-0474-3. BMC Biol. 2018. PMID: 29343244 Free PMC article. Review. - Molecular dissection of amyloid disaggregation by human HSP70.
Wentink AS, Nillegoda NB, Feufel J, Ubartaitė G, Schneider CP, De Los Rios P, Hennig J, Barducci A, Bukau B. Wentink AS, et al. Nature. 2020 Nov;587(7834):483-488. doi: 10.1038/s41586-020-2904-6. Epub 2020 Nov 11. Nature. 2020. PMID: 33177717 - Hsp70 chaperones use ATP to remodel native protein oligomers and stable aggregates by entropic pulling.
De Los Rios P, Goloubinoff P. De Los Rios P, et al. Nat Struct Mol Biol. 2016 Sep 6;23(9):766-9. doi: 10.1038/nsmb.3283. Nat Struct Mol Biol. 2016. PMID: 27605203 No abstract available. - Computationally-Aided Modeling of Hsp70-Client Interactions: Past, Present, and Future.
Nordquist EB, Clerico EM, Chen J, Gierasch LM. Nordquist EB, et al. J Phys Chem B. 2022 Sep 15;126(36):6780-6791. doi: 10.1021/acs.jpcb.2c03806. Epub 2022 Aug 30. J Phys Chem B. 2022. PMID: 36040440 Free PMC article. - Single-molecule evidence of Entropic Pulling by Hsp70 chaperones.
Rukes V, Rebeaud ME, Perrin LW, De Los Rios P, Cao C. Rukes V, et al. Nat Commun. 2024 Oct 8;15(1):8604. doi: 10.1038/s41467-024-52674-y. Nat Commun. 2024. PMID: 39379347 Free PMC article.
References
- Kim YE, Hipp MS, Bracher A, Hayer-Hartl M, Hartl FU. Molecular chaperone functions in protein folding and proteostasis. Annu Rev Biochem. 2013;82:323–55. - PubMed
- Kityk R, Kopp J, Sinning I, Mayer MP. Structure and Dynamics of the ATP-Bound Open Conformation of Hsp70 Chaperones. Mol Cell. 2012 - PubMed
Publication types
MeSH terms
Substances
LinkOut - more resources
Full Text Sources
Other Literature Sources
Research Materials
Miscellaneous


