Sharing and community curation of mass spectrometry data with Global Natural Products Social Molecular Networking - PubMed (original) (raw)
. 2016 Aug 9;34(8):828-837.
doi: 10.1038/nbt.3597.
Jeremy J Carver # 1 2, Vanessa V Phelan # 3, Laura M Sanchez # 3, Neha Garg # 3, Yao Peng # 4, Don Duy Nguyen 4, Jeramie Watrous 3, Clifford A Kapono 4, Tal Luzzatto-Knaan 3, Carla Porto 3, Amina Bouslimani 3, Alexey V Melnik 3, Michael J Meehan 3, Wei-Ting Liu 5, Max Crüsemann 6, Paul D Boudreau 6, Eduardo Esquenazi 7, Mario Sandoval-Calderón 8, Roland D Kersten 9, Laura A Pace 3, Robert A Quinn 10, Katherine R Duncan 11 6, Cheng-Chih Hsu 4, Dimitrios J Floros 4, Ronnie G Gavilan 12, Karin Kleigrewe 6, Trent Northen 13, Rachel J Dutton 14, Delphine Parrot 15, Erin E Carlson 16, Bertrand Aigle 17, Charlotte F Michelsen 18, Lars Jelsbak 18, Christian Sohlenkamp 8, Pavel Pevzner 2 1, Anna Edlund 19 20, Jeffrey McLean 21 20, Jörn Piel 22, Brian T Murphy 23, Lena Gerwick 6, Chih-Chuang Liaw 24, Yu-Liang Yang 25, Hans-Ulrich Humpf 26, Maria Maansson 18, Robert A Keyzers 27, Amy C Sims 28, Andrew R Johnson 29, Ashley M Sidebottom 29, Brian E Sedio 30 12, Andreas Klitgaard 18, Charles B Larson 6 31, Cristopher A Boya P 12, Daniel Torres-Mendoza 12, David J Gonzalez 31 3, Denise B Silva 32 33, Lucas M Marques 32, Daniel P Demarque 32, Egle Pociute 7, Ellis C O'Neill 6, Enora Briand 6 34, Eric J N Helfrich 22, Eve A Granatosky 35, Evgenia Glukhov 6, Florian Ryffel 22, Hailey Houson 7, Hosein Mohimani 2, Jenan J Kharbush 6, Yi Zeng 4, Julia A Vorholt 22, Kenji L Kurita 36, Pep Charusanti 37, Kerry L McPhail 38, Kristian Fog Nielsen 18, Lisa Vuong 7, Maryam Elfeki 23, Matthew F Traxler 39, Niclas Engene 40, Nobuhiro Koyama 3, Oliver B Vining 38, Ralph Baric 28, Ricardo R Silva 32, Samantha J Mascuch 6, Sophie Tomasi 15, Stefan Jenkins 13, Venkat Macherla 7, Thomas Hoffman 41, Vinayak Agarwal 42, Philip G Williams 43, Jingqui Dai 43, Ram Neupane 43, Joshua Gurr 43, Andrés M C Rodríguez 32, Anne Lamsa 44, Chen Zhang 45, Kathleen Dorrestein 3, Brendan M Duggan 3, Jehad Almaliti 3, Pierre-Marie Allard 46, Prasad Phapale 47, Louis-Felix Nothias 48, Theodore Alexandrov 47, Marc Litaudon 48, Jean-Luc Wolfender 46, Jennifer E Kyle 49, Thomas O Metz 49, Tyler Peryea 50, Dac-Trung Nguyen 50, Danielle VanLeer 50, Paul Shinn 50, Ajit Jadhav 50, Rolf Müller 41, Katrina M Waters 49, Wenyuan Shi 20, Xueting Liu 51, Lixin Zhang 51, Rob Knight 52, Paul R Jensen 6, Bernhard O Palsson 37, Kit Pogliano 44, Roger G Linington 36, Marcelino Gutiérrez 12, Norberto P Lopes 32, William H Gerwick 3 6, Bradley S Moore 3 6 42, Pieter C Dorrestein 3 6 31, Nuno Bandeira 2 3 31
Affiliations
- PMID: 27504778
- PMCID: PMC5321674
- DOI: 10.1038/nbt.3597
Sharing and community curation of mass spectrometry data with Global Natural Products Social Molecular Networking
Mingxun Wang et al. Nat Biotechnol. 2016.
Abstract
The potential of the diverse chemistries present in natural products (NP) for biotechnology and medicine remains untapped because NP databases are not searchable with raw data and the NP community has no way to share data other than in published papers. Although mass spectrometry (MS) techniques are well-suited to high-throughput characterization of NP, there is a pressing need for an infrastructure to enable sharing and curation of data. We present Global Natural Products Social Molecular Networking (GNPS; http://gnps.ucsd.edu), an open-access knowledge base for community-wide organization and sharing of raw, processed or identified tandem mass (MS/MS) spectrometry data. In GNPS, crowdsourced curation of freely available community-wide reference MS libraries will underpin improved annotations. Data-driven social-networking should facilitate identification of spectra and foster collaborations. We also introduce the concept of 'living data' through continuous reanalysis of deposited data.
Figures
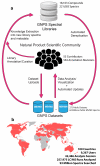
Figure 1. Overview of GNPS
(a) Representation of interactions between the natural product community, GNPS spectral libraries, and GNPS datasets. At present 221,083 MS/MS spectra from 18,163 unique compounds are used for the search in the GNPS. These include both 3rd party libraries such as MassBank, ReSpect, and NIST, as well as spectral libraries created for GNPS (GNPS-Collections) and spectra from the natural product community (GNPS-Community). GNPS spectral libraries grow through user contributions of new identifications of MS/MS spectra. To date, 55 community members have contributed 8,853 MS/MS spectra from 5,568 unique compounds (30.5% of the unique compounds available). In addition, on-going curation efforts have already yielded 563 annotation updates for library spectra. The utility of these libraries is to dereplicate compounds (recognition previously characterized and studied known compounds), in both public and private data. This dereplication process is performed on all public datasets and results are automatically reported, thus enabling users to query all datasets/organisms/conditions. Automatic reanalysis of all public data creates a virtuous cycle in which contributions to libraries can be matched to all public data. Combined with molecular networking (Fig. 3), this automatic reanalysis empowers community members to identify analogs that can then be added to GNPS spectral libraries. (b) The GNPS platform has grown to serve a global user base of 9,200+ users from 100 countries.
Figure 2. GNPS spectral libraries
(a) The computational resources of the metabolomics and natural products community fall into two main categories: i) Reference collections (red dots) of MS/MS spectral libraries and ii) Data Repositories (blue dots)designed to publicly share raw mass spectrometry data associated with research projects. Reference collection resources are contributors and aggregators of reference MS/MS spectra, some of which also include data analysis tools, e.g. online multi-spectrum MS/MS search (magnifying glass icon). Several resources have aggregated MS/MS spectra from various reference collections so that the analysis tools at a respective resource can leverage more of the community efforts to annotate data (red and blue arrows). GNPS has imported all freely available reference collections (>221,000 MS/MS spectra) and makes them available for online analyses. GNPS and several other resources provide both reference MS/MS spectra and data in an open and free manner to the public (pink caps). (b) Comparison of spectral library sizes of available libraries (MassBank, ReSpect, and NIST) and GNPS libraries; GNPS-Collections includes newly acquired spectra from synthetic or purified compounds and GNPS-Community includes all community-contributed spectra. (c) Searching all public GNPS datasets revealed that Massbank/ReSpect/NIST libraries matched to 1,217 unique compounds, with GNPS libraries increasing unique compound matches by 41% (corresponding to 29% of total unique matches) with an accompanying 4% increase in spectral library size. Overall, GNPS libraries increase the total number of spectra matched in public datasets by 144% (59% of total public MS/MS matches) and spectra matches across all GNPS public and private data by 767% (88% of all MS/MS matches). (d) The distribution of precursor masses in all GNPS public datasets is shown in gray and compared to the precursor mass distributions of Massbank, ReSpect, NIST, and GNPS libraries. Though GNPS libraries have a combined size that is smaller than MassBank/ReSpect/NIST, GNPS libraries have a higher proportion of molecules in the higher m/z range and therefore complement the proportionately lower precursor mass molecules in other libraries. (e) The quality of spectrum matches obtained by searching against the available spectral libraries is assessed by user ratings (1 to 4 stars see Supplementary Table 6) of continuous identification results. User ratings of 2.5+ stars for 98%+ of GNPS library matches compares favorably with the 90% mark for NIST matches, whose high marks demonstrate how important these 3rd party libraries still are to the GNPS platform. We note that the lower mark for NIST matches does not suggest lower quality spectra. It is more likely explained by its higher emphasis on lower precursor mass molecules with spectra that have fewer peaks and are generally harder to match.
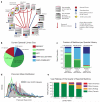
Figure 3. Molecular Network Creation and Visualization
(a) Molecular networks are constructed from the alignment of MS/MS spectra to one another. Edges connecting nodes (MS/MS spectra) are defined by a modified cosine scoring scheme determines the similarity of two MS/MS spectra with scores ranging from 0 (totally dissimilar) to 1 (completely identical). MS/MS spectra are also searched against GNPS Spectral Libraries, seeding putative nodes matches in the molecular networks. Networks are visualized online in-browser or exported for third party visualization software such as Cytoscape. (b) An example alignment between three MS/MS spectra of compounds with structural modifications that are captured by modification tolerant spectral matching utilized in variable dereplication and molecular networking. (c) In-browser molecular network visualization enables users to interactively explore molecular networks without requiring any external software. To date, more than 11,000 molecular networks have been analyzed using this feature. Within this interface, (i) users are able to define cohorts of input data and correspondingly, nodes within the network are represented as pie charts to visualize spectral count differences for each molecule across cohorts. (ii) Node labels indicate matches made to GNPS spectral libraries, with additional information displayed with mouseovers. These matches provide users a starting point to annotate unidentified MS/MS spectra within the network. (iii) To facilitate identification of unknowns, users can display MS/MS spectra in the right panels by clicking on the nodes in the network, giving direct interactive access to the underlying MS/MS peak data. Furthermore, alignments between spectra are visualized between spectra in the top right and bottom right panels in order to gain insight as to what underlying characteristics of the molecule could elicit fragmentation perturbations.
Figure 4. “Living data” in GNPS by crowdsourcing molecular annotations
(a) A global snapshot of the state of MS/MS matching of public natural product datasets available in GNPS using molecular networking and library search tools. Identified molecules (1.9% of the data) are MS/MS spectrum matches to library spectra with a cosine greater than 0.7. Putative Analog Molecules (another 1.9% of the data) are MS/MS spectra that are not identified by library search but rather are immediate neighbors of identified MS/MS spectra in molecular networks. Identified Networks (9.9% of the data) are connected components within a molecular network that have at least one spectrum match to library spectra. Unidentified Networks (25.2% of the data) are molecular networks where none of the spectra match to library spectra; these networks potentially represent compound classes that have not yet been characterized. Exploratory Networks (an additional 20.1% of the data) are unidentified connected components in molecular networks with more relaxed parameters (Supplementary Table 8). Thus, 55.3% of the MS/MS spectra at least have one related MS/MS spectrum in spectral networks, with 44.7% having none. In this 44.7% of the data, each MS/MS spectrum has been observed in two separate instances and should not constitute noise. Altogether, this analysis indicates that most of the chemical space captured by mass spectrometry remains unexplored. (b) In the past year, there has been significant growth in the GNPS spectral libraries, driving growth in the match rates of all public data. The number of unique compounds matched in the public data has increased 10x; the number of total spectra matched has increased 22x; and the average match rate has increased 3x. It is expected that identification rates will continue to grow with further contributions from the community to the GNPS-Community spectral library.
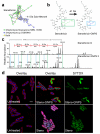
Figure 5. GNPS enabled discovery of stenothricin
a) The stenothricin molecular family was identified during analysis of a molecular network between chemical extracts of S. roseosporus NRRL 15998 (Green) and Streptomyces sp. DSM5940 (Blue). This analysis indicates that Streptomyces sp. DSM5940 produces a structurally similar compound to stenothricin with a −41 Da m/z difference. An enlarged version of the network can be found in Supplementary. b) Based on preliminary structural analysis, stenothricin-GNPS (41 Da) may contain a Lys to Ser substitution. c) Comparison of the MS/MS of stenothricin D with stenothricin-GNPS 2. d) Although structurally related, stenothricin and stenothricin-GNPS have different effects on E. coli as visualized using fluorescence microscopy. Red is the membrane stain FM4-64, blue is the membrane permeable DNA stain DAPI, green is the membrane impermeable DNA stain SYTOX green. SYTOX green only stains DNA when the cell membrane is damaged. The scale bar represents 2 μm.
Similar articles
- Implementation of an MS/MS Spectral Library for Monoterpene Indole Alkaloids.
Le Pogam P, Poupon E, Champy P, Beniddir MA. Le Pogam P, et al. Methods Mol Biol. 2022;2505:87-100. doi: 10.1007/978-1-0716-2349-7_7. Methods Mol Biol. 2022. PMID: 35732939 - Data libraries - the missing element for modeling biological systems.
Baryshnikova A. Baryshnikova A. FEBS J. 2020 Nov;287(21):4594-4601. doi: 10.1111/febs.15261. Epub 2020 Mar 10. FEBS J. 2020. PMID: 32100391 Free PMC article. Review. - Bioactive Natural Products Identification Using Automation of Molecular Networking Software.
Baskiyar S, Ren C, Heck KL, Hall AM, Gulfam M, Packer S, Seals CD, Calderón AI. Baskiyar S, et al. J Chem Inf Model. 2022 Dec 26;62(24):6378-6385. doi: 10.1021/acs.jcim.2c00307. Epub 2022 Aug 10. J Chem Inf Model. 2022. PMID: 35947427 - Protocol for community-created public MS/MS reference spectra within the Global Natural Products Social Molecular Networking infrastructure.
Vargas F, Weldon KC, Sikora N, Wang M, Zhang Z, Gentry EC, Panitchpakdi MW, Caraballo-Rodríguez AM, Dorrestein PC, Jarmusch AK. Vargas F, et al. Rapid Commun Mass Spectrom. 2020 May 30;34(10):e8725. doi: 10.1002/rcm.8725. Rapid Commun Mass Spectrom. 2020. PMID: 31930757 - Free Marine Natural Products Databases for Biotechnology and Bioengineering.
Barbosa AJM, Roque ACA. Barbosa AJM, et al. Biotechnol J. 2019 Nov;14(11):e1800607. doi: 10.1002/biot.201800607. Epub 2019 Aug 8. Biotechnol J. 2019. PMID: 31297982 Review.
Cited by
- A Metabolites Merging Strategy (MMS): Harmonization to Enable Studies' Intercomparison.
Villalba H, Llambrich M, Gumà J, Brezmes J, Cumeras R. Villalba H, et al. Metabolites. 2023 Nov 21;13(12):1167. doi: 10.3390/metabo13121167. Metabolites. 2023. PMID: 38132849 Free PMC article. - Online and Offline Prioritization of Chemicals of Interest in Suspect Screening and Non-targeted Screening with High-Resolution Mass Spectrometry.
Szabo D, Falconer TM, Fisher CM, Heise T, Phillips AL, Vas G, Williams AJ, Kruve A. Szabo D, et al. Anal Chem. 2024 Mar 5;96(9):3707-3716. doi: 10.1021/acs.analchem.3c05705. Epub 2024 Feb 21. Anal Chem. 2024. PMID: 38380899 Free PMC article. Review. - Dietary iron intake has long-term effects on the fecal metabolome and microbiome.
Kostenko A, Zuffa S, Zhi H, Mildau K, Raffatellu M, Dorrestein PC, Aron AT. Kostenko A, et al. Metallomics. 2024 Jul 1;16(7):mfae033. doi: 10.1093/mtomcs/mfae033. Metallomics. 2024. PMID: 38992131 - Feature-Based Molecular Network-Assisted Cannabinoid and Flavonoid Profiling of Cannabis sativa Leaves and Their Antioxidant Properties.
Chen L, Li HL, Zhou HJ, Zhang GZ, Zhang Y, Wang YM, Wang MY, Yang H, Gao W. Chen L, et al. Antioxidants (Basel). 2024 Jun 20;13(6):749. doi: 10.3390/antiox13060749. Antioxidants (Basel). 2024. PMID: 38929189 Free PMC article. - Integrated Omics Strategy Reveals Cyclic Lipopeptides Empedopeptins from Massilia sp. YMA4 and Their Biosynthetic Pathway.
Ho ST, Ho YN, Lin C, Hsu WC, Lee HJ, Peng CC, Cheng HT, Yang YL. Ho ST, et al. Mar Drugs. 2021 Apr 9;19(4):209. doi: 10.3390/md19040209. Mar Drugs. 2021. PMID: 33918939 Free PMC article.
References
- Dict. Nat. Prod. 2013
- Laatsch H. AntiBase A data base for rapid structural determination of microbial natural products, and annual updates. 2008.
- Blunt J, Munro M. MarinLit. A database Lit. Mar. Nat. Prod. use a macintosh Comput. Prep. Maint. by Mar. Chem. Gr. (Department Chem. Univ. Canterbury Canterbury, New Zealand) 2003
- H H, et al. MassBank: a public repository for sharing mass spectral data for life sciences. 2010. - PubMed
Publication types
MeSH terms
Substances
Grants and funding
- R01 DE023810/DE/NIDCR NIH HHS/United States
- R00 DE024543/DE/NIDCR NIH HHS/United States
- K12 GM068524/GM/NIGMS NIH HHS/United States
- P41 GM103484/GM/NIGMS NIH HHS/United States
- U01 AI124316/AI/NIAID NIH HHS/United States
- R01 GM097509/GM/NIGMS NIH HHS/United States
- R01 DE020102/DE/NIDCR NIH HHS/United States
- U01 TW006634/TW/FIC NIH HHS/United States
- R01 GM095373/GM/NIGMS NIH HHS/United States
- R01 AI095125/AI/NIAID NIH HHS/United States
- U19 AI106772/AI/NIAID NIH HHS/United States
- HHSN272200800060C/AO/NIAID NIH HHS/United States
- K01 GM103809/GM/NIGMS NIH HHS/United States
- T32 GM075762/GM/NIGMS NIH HHS/United States
- R21 AI085540/AI/NIAID NIH HHS/United States
- K99 DE024543/DE/NIDCR NIH HHS/United States
- S10 RR029121/RR/NCRR NIH HHS/United States
- R01 GM094802/GM/NIGMS NIH HHS/United States
- U41 AT008718/AT/NCCIH NIH HHS/United States
- R01 GM085770/GM/NIGMS NIH HHS/United States
- T32 DK007202/DK/NIDDK NIH HHS/United States
- U01 TW007401/TW/FIC NIH HHS/United States
- F32 GM089044/GM/NIGMS NIH HHS/United States
- UL1 RR031980/RR/NCRR NIH HHS/United States
- U19 TW007401/TW/FIC NIH HHS/United States
LinkOut - more resources
Full Text Sources
Other Literature Sources
Molecular Biology Databases
Miscellaneous


