Fap2 Mediates Fusobacterium nucleatum Colorectal Adenocarcinoma Enrichment by Binding to Tumor-Expressed Gal-GalNAc - PubMed (original) (raw)
. 2016 Aug 10;20(2):215-25.
doi: 10.1016/j.chom.2016.07.006.
Johanna E M Emgård 1, Gideon Zamir 2, Mouhammad Faroja 2, Gideon Almogy 2, Amalie Grenov 1, Asaf Sol 1, Ronit Naor 1, Eli Pikarsky 3, Karine A Atlan 4, Anna Mellul 4, Stella Chaushu 5, Abigail L Manson 6, Ashlee M Earl 6, Nora Ou 7, Caitlin A Brennan 7, Wendy S Garrett 8, Gilad Bachrach 9
Affiliations
- PMID: 27512904
- PMCID: PMC5465824
- DOI: 10.1016/j.chom.2016.07.006
Fap2 Mediates Fusobacterium nucleatum Colorectal Adenocarcinoma Enrichment by Binding to Tumor-Expressed Gal-GalNAc
Jawad Abed et al. Cell Host Microbe. 2016.
Abstract
Fusobacterium nucleatum is associated with colorectal cancer and promotes colonic tumor formation in preclinical models. However, fusobacteria are core members of the human oral microbiome and less prevalent in the healthy gut, raising questions about how fusobacteria localize to CRC. We identify a host polysaccharide and fusobacterial lectin that explicates fusobacteria abundance in CRC. Gal-GalNAc, which is overexpressed in CRC, is recognized by fusobacterial Fap2, which functions as a Gal-GalNAc lectin. F. nucleatum binding to clinical adenocarcinomas correlates with Gal-GalNAc expression and is reduced upon O-glycanase treatment. Clinical fusobacteria strains naturally lacking Fap2 or inactivated Fap2 mutants show reduced binding to Gal-GalNAc-expressing CRC cells and established CRCs in mice. Additionally, intravenously injected F. nucleatum localizes to mouse tumor tissues in a Fap2-dependent manner, suggesting that fusobacteria use a hematogenous route to reach colon adenocarcinomas. Thus, targeting F. nucleatum Fap2 or host epithelial Gal-GalNAc may reduce fusobacteria potentiation of CRC.
Copyright © 2016 Elsevier Inc. All rights reserved.
Figures
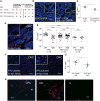
Figure 1. Gal-GalNAc Is Overexpressed in Human Colorectal Adenocarcinoma and Specific Adenoma Subgroups
(A and B) Gal-GalNAc levels in human colon adenocarcinomas, adenomas, and normal tissues using tissue microarrays (TMA). (A) Representative stained TMA images of human colon adenocarcinoma and normal tissue, H&E (top) and FITC-labeled Gal-GalNAc-specific PNA (green) and Hoechst dye (blue, bottom). (B) PNA binding to each tissue core (sum of fluorescence intensity of analyzed section; n, number of cases). Error bars indicate mean ± SEM. ****p < 0.0001, Wilcoxon signed-rank test. (C) Gal-GalNAc expression within adenoma subgroups. PNA binding (sum of fluorescence intensity of analyzed section) to the adenoma tissue core presented in (B) and divided to adenoma groups. Error bars indicate mean ± SEM. ****p < 0.0001, ANOVA, Tukey’s multiple comparison test.
Figure 2. Gal-GalNAc Is Overexpressed in Human Colorectal Adenocarcinoma and Facilitates F. nucleatum Enrichment
(A) Human colon adenocarcinomas were treated with O-glycanase for Gal-GalNAc removal as indicated and stained as above. Dashed lines indicate CRC-adjacent normal tissue border. (B) PNA binding (sum of fluorescence intensity of analyzed field) of samples untreated or treated with O-glycanase. Each symbol represents the mean of three randomly selected fields (n = 5 cases). Error bars indicate mean ± SEM. *p = 0.0313, Wilcoxon signed-rank test. (C) Binding of FITC-labeled Fn (single green rods or aggregates seen as green spots) to Hoechst-stained (blue) human colon adenocarcinoma sections. Representative image (left) and magnified inset images (left). (D) Quantitation of fusobacterial binding (Fn/mm2) to TMA sections from human colon adenocarcinomas and normal tissues. Symbols represent individual cases. Error bars indicate mean ± SEM. ****p < 0.0001, one-tailed Mann-Whitney test. (E) Quantitation of fusobacterial binding (Fn/mm2) in CRC samples untreated or treated with O-glycanase. Each symbol represents the mean of three randomly selected fields per human section (n = 5 cases). Mean ± SEM are shown; *p = 0.0313, Wilcoxon signed-rank test.
Figure 3. Fap2 Binding to GalNAc in Human CRC Mediates F. nucleatum Adenocarcinoma Enrichment
(A) Fap2 is a Gal-GalNAc binding lectin. Hemagglutination by wild-type Fn and not by isogenic Fap2 inactivated mutants K50 and D22 in the absence (left) and in the presence (right) of 25 mM GalNAc. (B) Representative image of FITC-labeled Fn (green) attachment to Hoechst-stained (blue) human colon adenocarcinoma sections in the absence (left) or presence (right) 300 mM GalNAc. (C) Quantitation of fusobacterial binding (Fn/mm2) performed in (B). Each symbol represents the mean of three randomly selected fields per human section (n = 6). Mean ± SEM are shown; *p = 0.015, Wilcoxon signed-rank test. (D) Representative image of Cy3-labeled Fn (red) and Cy5-labeled Fap2-inactivated isogenic mutant K50 (green) to a Hoechst-stained (blue) human colon adenocarcinoma section. (E) Quantitation of fusobacterial binding (Fn/mm2) to TMA of human colon adenocarcinoma, adenoma, and normal tissue. Each symbol represents the mean of three randomly selected fields per human tissue core. Mean ± SEM are shown; ****p < 0.0001, Bonferroni-corrected Wilcoxon test. (F) Attachment of FITC-labeled (green) Fn (left) or of Fap2-inactivated isogenic mutant D22 (right) to Hoechst-stained (blue) representative human colon adenocarcinoma sections. (G) Quantitation of fusobacterial binding (Fn/mm2) described in (F). Each symbol represents the mean of three randomly selected fields per human section (n = 6). Mean ± SEM are shown; *p = 0.0119, one-tailed Mann-Whitney test. (H) Fn colocalization with Gal-GalNAc in human CRC. Human colorectal adenocarcinoma sections were stained with Hoechst (blue) and incubated with Alexa Fluor 647-conjugated PNA (red) and FITC-labeled Fn (green). Dashed line indicates the CRC-adjacent normal tissue border. Representative image (left). Magnification of the inset CRC region is shown in the middle, and the inset adjacent to normal tissue is shown on the right. See also Figure S1.
Figure 4. Fap2-Dependent Gal-GalNAc Binding Mediates F. nucleatum CRC Attachment
Flow cytometry analyses of attachments assays to mouse CRC cell line CT26 and human CRC cell lines HCT116, RKO, and HT29 without and with increasing concentrations of GalNAc. (A) FITC-labeled PNA, Fn, Fap2-inactivated isogenic mutants K50 and D22. (B) FITC-labeled human CRC F. nucleatum isolates CTI-2 and CTI-7. (C) Binding of FITC-labeled F. nucleatum CRC isolates, oral isolates, and an inflammatory bowel disease isolate (as indicated) to mouse CRC cell line CT26 and human CRC cell lines HCT116, RKO, and HT29. Data reflect three independent experiments. Mean values with SEM of triplicate are shown. Bacterial attachment data in the absence of GalNAc are the mean ± SEM of five independent experiments. *p = 0.04167, Spearman rank correlation coefficient; **p < 0.01, Bonferroni-corrected two-tailed Mann-Whitney test (**p < 0.01, ***p = 0.0007). See also Figure S1.
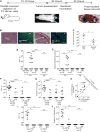
Figure 5. Localization of F. nucleatum to Established CRC Tumors Requires Fap2
(A) Experimental scheme: orthotopic rectal CT26 mouse CRC model. When tumors were 2,500 mm3, mice were randomized to a bacterial inoculation group. White arrow indicates tumor, black arrow adjacent normal colon. (B and C) Gal-GalNAc overexpression in the CT26 mouse CRC model. (B) Representative image of CT26 orthotopic tumor stained with H&E or with FITC-labeled Gal-GalNAc-specific PNA (green) and Hoechst dye (blue). CRC denotes images of tumors, and N denotes images of adjacent normal tissue. (C) Quantitative analysis of PNA binding to each section (sum of fluorescence intensity of analyzed section). n, number of mice. Error bars indicate mean ± SEM. *p = 0.0313, Wilcoxon signed-rank test. (D and E) Preferential enrichments of F. nucleatum ATCC 23726 in CRC tumors. (D) Abundance (CFU/gr tissue) and (E) relative fusobacterial gDNA abundance (2−ΔCt) in colon samples from non-CT26 transplanted, tumor-free mice (no CRC), inoculated intravenously (IV) with 5 × 10⁶ to 1 × 10⁷ F. nucleatum ATCC 23726, in tumor (T) and normal adjacent tissues (N) from CT26-tumor-bearing mice (n = 15) inoculated IV with 5 × 10⁶ to 1 × 10⁷ F. nucleatum ATCC 23726 and in tumor (T) and normal adjacent tissues (N) from CT26-tumor-bearing mice (n = 15) inoculated IV with 5 × 10⁶ to 1 × 10⁷ P. gingivalis ATCC 33277 (Pg). ****p < 0.0001,**p < 0.01, Mann-Whitney U test; ***p = 0.0005, *p < 0.05, Bonferroni-corrected Wilcoxon signed-rank test. n.s., not statistically significant. Each symbol represents data from individual mice. Data reflect one representative experiment out of three performed in (B) and (C) and two in (D) and (E). Error bars show mean ± SEM. (F–J) Fap2 mediates fusobacterial localization in CT26 CRC model mice. (F) CRC colonization (CFU/gr tissue) by IV inoculated F. nucleatum ATCC 23726 (Fn WT 23726) or Fap2-deficient mutant D22 (MUT D22). ****p < 0.0001, Bonferroni-corrected Wilcoxon signed-rank test for (T) versus (N); ****p < 0.0001, Mann-Whitney U test for (WT 23726) versus (MUT D22). (G) Relative fusobacterial gDNA abundance (2−ΔCt) of wild-type Fn (WT) and of the Fap2-deficient isogenic mutant D22 in tumor (T) versus matched adjacent normal tissue (N) from the samples in (F). Error bars indicate mean ± SEM; ****p < 0.0001, ***p = 0.0002, Mann-Whitney U test. (H) Tumor enrichment of Fn and the Fap2-deficient mutant K50 IV inoculated as a mixture; **p = 0.0046, Bonferroni-corrected Wilcoxon signed-rank test. (I and J) Tumoral enrichment of inoculated Fap2-expressing CTI-2 or of the Fap2-deficient CTI-7 in tumor (T) and normal tumor-adjacent tissues (N), quantified by plating (I) or by qPCR (J) as relative gDNA abundance in tumor versus matched adjacent normal tissue (2−ΔCt); *p = 0.0156, **p = 0.0064, Bonferroni-corrected Mann-Whitney U test. Figures show data from one of two representative experiments performed.
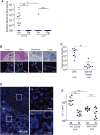
Figure 6. Fusobacterial Presence in CRC Metastases Is Facilitated by Fap2 Binding to Host Gal-GalNAc
(A) Relative fusobacterial (Fn) and P. gingivalis (Pg) gDNA abundance (2−ΔCt) in human CRC metastases and in tumor-free liver biopsy samples. Open circle represents metastasis in the omentum, and open square represents metastasis in the lung. Filled circle are liver metastases. Filled squares represent tumor-free liver. Error bars indicate mean ± SEM; **p = 0.004, Bonferroni-corrected Wilcoxon signed-rank test; *p = 0.031, Bonferroni-corrected Mann-Whitney U test. Each symbol represents data from individual metastatic deposits. (B) Representative sections of human CRC metastases (M) were stained with FITC-PNA (green) for Gal-GalNAc quantification and with Hoechst (blue). Dashed lines indicate tumor-adjacent normal (N) tissue border. (C) Quantitative analysis of PNA binding (sum of fluorescence intensity of analyzed field) of the samples described in (B). Each symbol represents the mean of three randomly selected fields for each human tissue section (n = 9). Error bars indicate mean ± SEM; **p = 0.0039, Wilcoxon signed-rank test. (D) Attachment of Cy3-labeled (red) Fn and of its Cy5-labeled (green) Fap2-inactivated mutant K50 to a representative Hoechst-stained (blue) human CRC liver metastasis section. See Figure S4 for a representative section stained with Cy5-Fn and Cy3-K50, to allay concerns of dye staining bias. (E) Quantitation of fusobacterial binding (Fn/mm2) of bacteria described in (D) to sections of human CRC metastasis sections (n = 8). Each symbol represents the median of three randomly selected fields per human section. Error bars indicate mean ± SEM; **p = 0.0078, Wilcoxon signed-rank test. See also Figures S2 and S3.
Comment in
- When Mr. Fap Meets the Gals.
Ghosh SK, Weinberg A. Ghosh SK, et al. Cell Host Microbe. 2016 Aug 10;20(2):125-6. doi: 10.1016/j.chom.2016.07.013. Cell Host Microbe. 2016. PMID: 27512897
Similar articles
- Tumor Targeting by Fusobacterium nucleatum: A Pilot Study and Future Perspectives.
Abed J, Maalouf N, Parhi L, Chaushu S, Mandelboim O, Bachrach G. Abed J, et al. Front Cell Infect Microbiol. 2017 Jun 30;7:295. doi: 10.3389/fcimb.2017.00295. eCollection 2017. Front Cell Infect Microbiol. 2017. PMID: 28713780 Free PMC article. - Placental colonization by Fusobacterium nucleatum is mediated by binding of the Fap2 lectin to placentally displayed Gal-GalNAc.
Parhi L, Abed J, Shhadeh A, Alon-Maimon T, Udi S, Ben-Arye SL, Tam J, Parnas O, Padler-Karavani V, Goldman-Wohl D, Yagel S, Mandelboim O, Bachrach G. Parhi L, et al. Cell Rep. 2022 Mar 22;38(12):110537. doi: 10.1016/j.celrep.2022.110537. Cell Rep. 2022. PMID: 35320712 - Breast cancer colonization by Fusobacterium nucleatum accelerates tumor growth and metastatic progression.
Parhi L, Alon-Maimon T, Sol A, Nejman D, Shhadeh A, Fainsod-Levi T, Yajuk O, Isaacson B, Abed J, Maalouf N, Nissan A, Sandbank J, Yehuda-Shnaidman E, Ponath F, Vogel J, Mandelboim O, Granot Z, Straussman R, Bachrach G. Parhi L, et al. Nat Commun. 2020 Jun 26;11(1):3259. doi: 10.1038/s41467-020-16967-2. Nat Commun. 2020. PMID: 32591509 Free PMC article. - Targeting Programmed Fusobacterium nucleatum Fap2 for Colorectal Cancer Therapy.
Ganesan K, Guo S, Fayyaz S, Zhang G, Xu B. Ganesan K, et al. Cancers (Basel). 2019 Oct 18;11(10):1592. doi: 10.3390/cancers11101592. Cancers (Basel). 2019. PMID: 31635333 Free PMC article. Review. - Fusobacterium's link to colorectal neoplasia sequenced: A systematic review and future insights.
Hussan H, Clinton SK, Roberts K, Bailey MT. Hussan H, et al. World J Gastroenterol. 2017 Dec 28;23(48):8626-8650. doi: 10.3748/wjg.v23.i48.8626. World J Gastroenterol. 2017. PMID: 29358871 Free PMC article. Review.
Cited by
- Deep Ultraviolet Light-Emitting Diode Light Therapy for Fusobacterium nucleatum.
Fukuda S, Ito S, Nishikawa J, Takagi T, Kubota N, Otsuyama KI, Tsuneoka H, Nojima J, Harada K, Mishima K, Suehiro Y, Yamasaki T, Sakaida I. Fukuda S, et al. Microorganisms. 2021 Feb 19;9(2):430. doi: 10.3390/microorganisms9020430. Microorganisms. 2021. PMID: 33669771 Free PMC article. - Strain-level epidemiology of microbial communities and the human microbiome.
Yan Y, Nguyen LH, Franzosa EA, Huttenhower C. Yan Y, et al. Genome Med. 2020 Aug 13;12(1):71. doi: 10.1186/s13073-020-00765-y. Genome Med. 2020. PMID: 32791981 Free PMC article. Review. - Localization of Fusobacterium nucleatum in oral squamous cell carcinoma and its possible directly interacting protein molecules: A case series.
He X, Ma X, Meng Z, Han Z, Chen W. He X, et al. Histol Histopathol. 2023 Aug;38(8):929-939. doi: 10.14670/HH-18-560. Epub 2022 Dec 7. Histol Histopathol. 2023. PMID: 36478348 - Fusobacterium nucleatum induces proliferation and migration in pancreatic cancer cells through host autocrine and paracrine signaling.
Udayasuryan B, Ahmad RN, Nguyen TTD, Umaña A, Monét Roberts L, Sobol P, Jones SD, Munson JM, Slade DJ, Verbridge SS. Udayasuryan B, et al. Sci Signal. 2022 Oct 18;15(756):eabn4948. doi: 10.1126/scisignal.abn4948. Epub 2022 Oct 18. Sci Signal. 2022. PMID: 36256708 Free PMC article. - Alterations in the gastric microbiota and metabolites in gastric cancer: An update review.
Lei C, Gong D, Zhuang B, Zhang Z. Lei C, et al. Front Oncol. 2022 Aug 23;12:960281. doi: 10.3389/fonc.2022.960281. eCollection 2022. Front Oncol. 2022. PMID: 36081564 Free PMC article. Review.
References
- Belcheva A, Irrazabal T, Robertson SJ, Streutker C, Maughan H, Rubino S, Moriyama EH, Copeland JK, Kumar S, Green B, et al. Gut microbial metabolism drives transformation of MSH2-deficient colon epithelial cells. Cell. 2014;158:288–299. - PubMed
MeSH terms
Substances
LinkOut - more resources
Full Text Sources
Other Literature Sources


