Tumor-Specific T Cell Dysfunction Is a Dynamic Antigen-Driven Differentiation Program Initiated Early during Tumorigenesis - PubMed (original) (raw)
. 2016 Aug 16;45(2):389-401.
doi: 10.1016/j.immuni.2016.07.011. Epub 2016 Aug 9.
Mary Philip 2, Varintra E Krisnawan 3, Edison Y Chiu 4, Jeffrey J Delrow 5, Ryan S Basom 5, Peter Lauer 6, Dirk G Brockstedt 6, Sue E Knoblaugh 7, Günter J Hämmerling 8, Todd D Schell 9, Natalio Garbi 10, Philip D Greenberg 11
Affiliations
- PMID: 27521269
- PMCID: PMC5119632
- DOI: 10.1016/j.immuni.2016.07.011
Tumor-Specific T Cell Dysfunction Is a Dynamic Antigen-Driven Differentiation Program Initiated Early during Tumorigenesis
Andrea Schietinger et al. Immunity. 2016.
Abstract
CD8(+) T cells recognizing tumor-specific antigens are detected in cancer patients but are dysfunctional. Here we developed a tamoxifen-inducible liver cancer mouse model with a defined oncogenic driver antigen (SV40 large T-antigen) to follow the activation and differentiation of naive tumor-specific CD8(+) T (TST) cells after tumor initiation. Early during the pre-malignant phase of tumorigenesis, TST cells became dysfunctional, exhibiting phenotypic, functional, and transcriptional features similar to dysfunctional T cells isolated from late-stage human tumors. Thus, T cell dysfunction seen in advanced human cancers may already be established early during tumorigenesis. Although the TST cell dysfunctional state was initially therapeutically reversible, it ultimately evolved into a fixed state. Persistent antigen exposure rather than factors associated with the tumor microenvironment drove dysfunction. Moreover, the TST cell differentiation and dysfunction program exhibited features distinct from T cell exhaustion in chronic infections. Strategies to overcome this antigen-driven, cell-intrinsic dysfunction may be required to improve cancer immunotherapy.
Copyright © 2016 Elsevier Inc. All rights reserved.
Figures
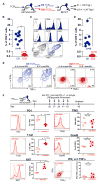
Figure 1. Rapid Induction of Dysfunction in Naive Tumor-Specific CD8+ T Cells Encountering an Oncogenic Driver Neoantigen in Pre-malignant Lesions
(A) Tamoxifen (Tam)-inducible ASTxCre-ERT2 tumor model. Tam-induced Cre-mediated excision of the flox-stop cassette leads to SV40 large T antigen expression. Peptide sequence in red indicates epitope I recognized by transgenic TCRSV40-I CD8+ T cells. (B) Liver carcinogenesis in ASTxCre-ERT2 mice. Hematoxylin and eosin (H&E) staining of liver sections collected at D10, D34, and D97 after Tam treatment. See also Figure S1. (C) Flow cytometric analysis of CD8+ splenocytes from TCRSV40-I transgenic mice using Db/Tag-I tetramers. (D) Differentiation of naive TCRSV40-I CD8+ T cells into functional effector and memory T cells. Left: Expression levels of CD44 and CD62L. Middle: 1 day after adoptive transfer of naive TCRSV40-I (Thy1.1+) into B6 (Thy1.2+) hosts, mice were immunized with 5 × 10⁶ cfu of LM-Tag-I or control LM-Ø. At 7 days after infection, peripheral blood was analyzed for expansion of donor TCRSV40-I. Each symbol represents an individual mouse; data show mean ± SEM. *p < 0.0001. Results are representative of at least ten independent experiments. Right: Intracellular IFN-γ and TNF-α production for naive, effector (8 days after LM-Tag-I), and memory (2–3 months LM-Tag-I) T cells. FACS plots are gated on CD8+Thy1.1+ cells. (E) Experimental scheme. (F) CD44 expression and carboxy-fluorescein-succimidyl ester (CFSE) dilution of transferred, naive TCRSV40-I isolated from spleens of ASTxCre-ERT2 1–2 days after transfer (left) and isolated from livers 3 days after Tam (right). (G) CD44, CD62L, Ki67, PD1, LAG3, 2B4, and TIM3 expression of D8 TCRSV40-I (blue) and D30 TCRSV40-I (red) isolated from livers of Tam-treated ASTxCre-ERT2 mice, and intracellular IFN-γ and TNF-α production. Naive T cells are shown as controls (gray). Results are representative of at least six independent experiments; data show mean ± SEM (*p = 0.0001, **p < 0.0001; ns, not statistically significant) using unpaired, two-tailed Student’s t test (for analysis between groups ~D8 and >D30 from 2–3 independent experiments).
Figure 2. Tumor-Specific CD8+ T Cells in Pre-malignant Lesions Enter a Fixed State of Dysfunction Not Reliant on External Cues
(A) Experimental scheme. D8 and D30 TCRSV40-I were isolated from livers and transferred into normal B6 mice and immunized with LM-Tag-I either 1 day or 3–4 weeks after transfer. (B) 1 day after second transfer, mice were immunized with 5 × 10⁶ cfu of LM-Tag-I, and 7 days later, spleens were analyzed for expansion of donor T cells by flow cytometry. *p = 0.00042 using Mann-Whitney U-test. (C) D8 TCRSV40-I that expanded after immunization as described in (B) were isolated from spleens 1 month later and evaluated for CD44, CD62L, PD1, LAG3, CCR7, and CD127 expression, and for IFN-γ and TNF-α production in response to antigen ex vivo. D8 TCRSV40-I (blue); naive (gray) and memory (solid black) are shown as controls. (D) 3–4 weeks after second transfer mice were immunized and analyzed as described in (B). Each symbol represents an individual mouse with the mean shown. Data are pooled from two independent experiments, with n = 8–9 for D8 TCRSV40-I and n = 7–9 for D30 TCRSV40-I. *p = 0.0015 using Mann-Whitney U-test. (E) D8 and D35 TCRSV40-I were cultured in vitro for 72 hr in the presence of IL-2 with or without anti-PD1 antibody (IL-2 [20 U/mL]; anti-PD1 [10 μg/mL; clone RMP1-14]). IFN-γ and TNF-α production was determined after 4.5 hr peptide stimulation. (F) Phenotypic and functional analyses of D35 TCRSV40-I after PD1 and PD-L1 blockade in vivo. Top: Experimental scheme. Bottom: Expression levels of TBET, Ki67, PD1, TIM3, GZMB, and IFN-γ and TNF-α production (after 4.5 hr peptide stimulation). Each symbol represents an individual mouse. Data show mean ± SEM (p values are shown; ns, not statistically significant) using unpaired, two-tailed Student’s t test (for analysis between isotype and treatment group).
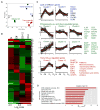
Figure 3. Genome-wide Transcriptome Analysis of Tumor-Specific TCRSV40-I CD8+ T Cells in Pre-malignant Lesions
(A) Principal component analysis of D8–12 TCRSV40-I (n = 3) and D34 TCRSV40-I (n = 4) isolated from pre-malignant liver lesions, with naive (N; n = 3) and effector (Eff; n = 3) TCRSV40-I as controls. (B) K-means clustering; heatmap of transcript levels for all 14 clusters show log2-tranformed expression intensities that were mean-centered at the probe level. (C) Selected K-means clusters. Lack of effector genes (blue, top); progressively up- or downregulated genes (green, middle); early, D8-upregulated genes (red, bottom). (D) Top 10 biological processes (BP) (Gene Ontology [GO] terms) enriched in clusters 5 and 10. Numbers in parentheses indicate the numbers of genes within each GO term. See also Figure S3 and Table S1; for (A) and (C), FDR q value ≤ 0.05.
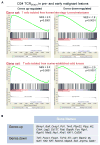
Figure 4. T Cells Isolated from Pre- and Early Malignant Lesions Exhibit the Molecular Hallmarks of T Cells from Late-Stage Human and Mouse Tumors
(A) Enrichment of genes sets in D34 TCRSV40-I from pre-malignant lesions described for T cells from late-stage and metastatic human tumors (GEO: GSE24536) (top) and mouse tumors (GEO: GSE42824) (lower). 200 most differentially expressed genes in T cells from human or mouse late-stage tumors (compared to naive T cells) were used for GSEA analyses of D34 TCRSV40-I. NES, normalized enrichment score. (B) Examples of genes enriched in D34 TCRSV40-I. See also Figure S4.
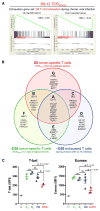
Figure 5. Tumor-Specific TCRSV40-I T Cells and Exhausted Virus-Specific T Cells Share a Conserved Core Program of Dysfunction
(A) Gene set enrichment analysis (GSEA) in D8 TCRSV40-I of “D8 exhaustion in chronic viral infection” genes (GEO: GSE30962). GSEA plot of D8 TCRSV40-I (versus D8 Effectors) of genes previously identified to be upregulated (left) or downregulated (right) in exhausted, virus-specific T cells 8 days after chronic viral infection (compared to Effectors, 8 days after acute infection). NES, normalized enrichment score. See also Figure S5. FDR q value ≤ 0.001. (B) Venn diagram of D8 TCRSV40-I (red) and ~D30 TCRSV40-I (green) from pre- and early malignant lesions and of ~D30 exhausted T cells during chronic viral LCMV infection (clone 13) (GEO: GSE9650). See Table S2 for full gene list. (C) TBET and EOMES expression in naive (N), effectors from spleens and livers 8 days after Listeria immunization (ES and EL), and TCRSV40-I isolated from pre- and early malignant lesions at D8 and D35 after tumor initiation (D8, D35+). Each symbol represents an individual mouse; data show mean ± SEM. p values are shown. See also Figure S5C.
Figure 6. Persistent Antigen, Not the Microenvironment, Drives T Cell Dysfunction in Established, Solid Tumors
(A) Experimental scheme of co-transfer experiment. (B) H&E staining of liver sections from ASTxAlb:Cre mice, showing hepatocellular carcinoma. Scale bar (top) represents 2 mm; scale bar (bottom) represents 50 μm. (C) 1 week after infection with 5 × 10⁶ cfu of LM-Tag-I-OVA, livers from ASTxAlb:Cre and spleens from B6 mice were analyzed for expansion of donor TCRSV40-I (Thy1.1+) and TCROT-I (Ly5.1+) by FACS. (D) Flow cytometric analysis of TCRSV40-I and TCROT-I from livers (ASTxAlb:Cre) or spleens (B6) 1 week (w1) and 2 weeks (w2) after transfer and immunization. Histograms are gated on CD8+ Thy1.1+ and Ly5.1+ cells, respectively. Right: TCRSV40-I (red) and TCROT-I (blue) isolated from B6 or ASTxAlb:Cre host mice 2–3 weeks after transfer; naive TCRSV40-I are shown as control (gray); *p < 0.0001 using unpaired, two-tailed Student’s t test (for analysis between TCRSV40-I andTCROT-I, from 3–4 independent experiments, with n = 5–8). (E) Intracellular IFN-γ and TNF-α production by TCRSV40-I and TCROT-I isolated from livers (ASTxAlb:Cre) or spleens (B6) 1 (w1), 2.5 (w2.5), or 7 (w7) weeks after transfer. Results are representative of four independent experiments. Right: IFN-γ+ and IFN-γ+/TNF-α+ TCRSV40-I (red) and TCROT-I (blue) 2–3 weeks after transfer; *p < 0.0001 using unpaired, two-tailed Student’s t test (for analysis between SV40-1 and TCROT-I, from 2 independent experiments, with n = 2–4).
Similar articles
- Efficient eradication of subcutaneous but not of autochthonous gastric tumors by adoptive T cell transfer in an SV40 T antigen mouse model.
Bourquin C, von der Borch P, Zoglmeier C, Anz D, Sandholzer N, Suhartha N, Wurzenberger C, Denzel A, Kammerer R, Zimmermann W, Endres S. Bourquin C, et al. J Immunol. 2010 Aug 15;185(4):2580-8. doi: 10.4049/jimmunol.0903231. Epub 2010 Jul 19. J Immunol. 2010. PMID: 20644173 - Passive but not active CD8+ T cell-based immunotherapy interferes with liver tumor progression in a transgenic mouse model.
Romieu R, Baratin M, Kayibanda M, Lacabanne V, Ziol M, Guillet JG, Viguier M. Romieu R, et al. J Immunol. 1998 Nov 15;161(10):5133-7. J Immunol. 1998. PMID: 9820481 - T-cell-associated immunotherapy: a promising strategy for the treatment of hepatocellular carcinoma.
Ma W, Chen X, Yuan Y. Ma W, et al. Immunotherapy. 2017 Jun;9(7):523-525. doi: 10.2217/imt-2017-0053. Immunotherapy. 2017. PMID: 28595519 No abstract available. - Tolerance and exhaustion: defining mechanisms of T cell dysfunction.
Schietinger A, Greenberg PD. Schietinger A, et al. Trends Immunol. 2014 Feb;35(2):51-60. doi: 10.1016/j.it.2013.10.001. Epub 2013 Nov 6. Trends Immunol. 2014. PMID: 24210163 Free PMC article. Review. - Reprogramming away from the exhausted T cell state.
Karagiannis P, Iriguchi S, Kaneko S. Karagiannis P, et al. Semin Immunol. 2016 Feb;28(1):35-44. doi: 10.1016/j.smim.2015.10.007. Epub 2015 Nov 14. Semin Immunol. 2016. PMID: 26589493 Review.
Cited by
- Epigenetics behind CD8+ T cell activation and exhaustion.
Zu H, Chen X. Zu H, et al. Genes Immun. 2024 Nov 14. doi: 10.1038/s41435-024-00307-1. Online ahead of print. Genes Immun. 2024. PMID: 39543311 Review. - TMED inhibition suppresses cell surface PD-1 expression and overcomes T cell dysfunction.
Vredevoogd DW, Apriamashvili G, Levy PL, Sinha S, Huinen ZR, Visser NL, de Bruijn B, Boshuizen J, van Hal-van Veen SE, Ligtenberg MA, Bleijerveld OB, Lin CP, Díaz-Gómez J, Sánchez SD, Markovits E, Simon Nieto J, van Vliet A, Krijgsman O, Markel G, Besser MJ, Altelaar M, Ruppin E, Peeper DS. Vredevoogd DW, et al. J Immunother Cancer. 2024 Nov 7;12(11):e010145. doi: 10.1136/jitc-2024-010145. J Immunother Cancer. 2024. PMID: 39510795 Free PMC article. - Cold and hot tumors: from molecular mechanisms to targeted therapy.
Wu B, Zhang B, Li B, Wu H, Jiang M. Wu B, et al. Signal Transduct Target Ther. 2024 Oct 18;9(1):274. doi: 10.1038/s41392-024-01979-x. Signal Transduct Target Ther. 2024. PMID: 39420203 Free PMC article. Review. - Vaccination generates functional progenitor tumor-specific CD8 T cells and long-term tumor control.
Detrés Román CR, Erwin MM, Rudloff MW, Revetta F, Murray KA, Favret NR, Roetman JJ, Roland JT, Washington MK, Philip M. Detrés Román CR, et al. J Immunother Cancer. 2024 Oct 3;12(10):e009129. doi: 10.1136/jitc-2024-009129. J Immunother Cancer. 2024. PMID: 39362791 Free PMC article. - Intratumoral radiation dose heterogeneity augments antitumor immunity in mice and primes responses to checkpoint blockade.
Jagodinsky JC, Vera JM, Jin WJ, Shea AG, Clark PA, Sriramaneni RN, Havighurst TC, Chakravarthy I, Allawi RH, Kim K, Harari PM, Sondel PM, Newton MA, Crittenden MR, Gough MJ, Miller JR, Ong IM, Morris ZS. Jagodinsky JC, et al. Sci Transl Med. 2024 Sep 18;16(765):eadk0642. doi: 10.1126/scitranslmed.adk0642. Epub 2024 Sep 18. Sci Transl Med. 2024. PMID: 39292804 Free PMC article.
References
- Barber DL, Wherry EJ, Masopust D, Zhu B, Allison JP, Sharpe AH, Freeman GJ, Ahmed R. Restoring function in exhausted CD8 T cells during chronic viral infection. Nature. 2006;439:682–687. - PubMed
Publication types
MeSH terms
Substances
Grants and funding
- P30 CA015704/CA/NCI NIH HHS/United States
- K08 CA158069/CA/NCI NIH HHS/United States
- P30 CA008748/CA/NCI NIH HHS/United States
- R00 CA172371/CA/NCI NIH HHS/United States
- R01 CA033084/CA/NCI NIH HHS/United States
- K99 CA172371/CA/NCI NIH HHS/United States
- R21 AI107776/AI/NIAID NIH HHS/United States
LinkOut - more resources
Full Text Sources
Other Literature Sources
Medical
Molecular Biology Databases
Research Materials


