Punctuated copy number evolution and clonal stasis in triple-negative breast cancer - PubMed (original) (raw)
. 2016 Oct;48(10):1119-30.
doi: 10.1038/ng.3641. Epub 2016 Aug 15.
Alexander Davis 1 2, Thomas O McDonald 3 4, Emi Sei 1, Xiuqing Shi 5, Yong Wang 1, Pei-Ching Tsai 1, Anna Casasent 1 2, Jill Waters 1, Hong Zhang 6, Funda Meric-Bernstam 7, Franziska Michor 3 4, Nicholas E Navin 1 2 8
Affiliations
- PMID: 27526321
- PMCID: PMC5042845
- DOI: 10.1038/ng.3641
Punctuated copy number evolution and clonal stasis in triple-negative breast cancer
Ruli Gao et al. Nat Genet. 2016 Oct.
Abstract
Aneuploidy is a hallmark of breast cancer; however, knowledge of how these complex genomic rearrangements evolve during tumorigenesis is limited. In this study, we developed a highly multiplexed single-nucleus sequencing method to investigate copy number evolution in patients with triple-negative breast cancer. We sequenced 1,000 single cells from tumors in 12 patients and identified 1-3 major clonal subpopulations in each tumor that shared a common evolutionary lineage. For each tumor, we also identified a minor subpopulation of non-clonal cells that were classified as metastable, pseudodiploid or chromazemic. Phylogenetic analysis and mathematical modeling suggest that these data are unlikely to be explained by the gradual accumulation of copy number events over time. In contrast, our data challenge the paradigm of gradual evolution, showing that the majority of copy number aberrations are acquired at the earliest stages of tumor evolution, in short punctuated bursts, followed by stable clonal expansions that form the tumor mass.
Conflict of interest statement
The authors have no competing interests to declare.
Figures
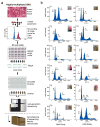
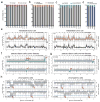
Figure 1. Highly-multiplexed single nucleus sequencing of TNBC patients
(a) Highly-multiplexed single nucleus sequencing method. Tumor tissues are dissociated into nuclear suspensions and stained with DAPI for flow-sorting by DNA ploidy. Single nuclei are deposited into 96-well plates and whole-genome-amplified by DOP-PCR. Single cell libraries are barcoded with unique 8bp identifier and 48–96 libraries are pooled together for sparse next-generation sequencing. The sequence reads are demultiplexed using the cell barcodes after sequencing is completed for copy number profile calculations. (b) FACS plots of DAPI intensity showing ploidy distributions for each TNBC patient. Single cells were isolated from different distributions of ploidy that were gated as: D (diploid), A (aneuploidy), or U (universal).
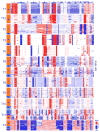
Figure 2. Clonal subpopulations identified by clustering aneuploid cells
Hierarchical 1-dimensional clustering of the single cell aneuploidy copy number profiles from each TNBC patient. The clonal subpopulations (A, B, C) are colored in orange, teal or purple. Single cells are plotted on the Y-axis, while copy number aberrations are plotted in genomic order on the X-axis.
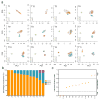
Figure 3. Clonal composition and diversity of TNBC tumors
(a) Principal Component Analysis of single cell copy number profiles sequenced from each TNBC tumor. Copy number profiles are colored by hierarchical clustering analysis and labeled as follows: diploid (D) or aneuploid tumor subpopulations (A, B, C). (b) Percentage of subclone genotypes in each tumor. (c) Shannon diversity index of copy number profiles from each tumor, with dotted lines indicating low, intermediate and high diversity groups.
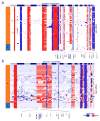
Figure 4. Divergent subpopulations in polyclonal tumors
Clustered heatmaps of single cell aneuploid copy number profiles in polyclonal tumors. (a) Tumor T3 heatmap with two subpopulations (A, B) identified. Subpopulation A (orange cluster) diverged from subpopulation B (teal cluster) by acquiring additional amplifications on chromosomes 10p and 12q, resulting in the amplification of GATA3 and MDM2 in addition to many other genes. (b) Tumor T2 heatmap with two subpopulations (A, B) identified. Subpopulation A (orange) diverged from the B subpopulation (teal) by the amplification of chromosome 5, containing many cancer genes including MAP3K1, ERBB2IP and PIK3R1.
Figure 5. Non-clonal copy number profiles in tumors and normal breast tissues
(a) Percentage of non-clonal cells in each tumor. (b) Percentage of non-clonal metastable aneuploid cells in the aneuploid fractions of each tumor. (c) Percentage of non-clonal pseudo-diploid cells in the diploid fractions of each tumor (d) Percentage of pseudodiploid cells in matched normal breast tissues from four TNBC patients (T3, T5, T8 and T10). (e) Examples of two metastable aneuploid cells (upper panels) compared to the copy number profiles of the major aneuploid subpopulations (lower panels). (f) Example of a pseudo-diploid cell isolated from diploid fractions of tumors. (g) Example of a pseudo-diploid cell isolated from matched normal breast tissues. (h) Examples of four chromazemic cells with large homozygous deletions of whole chromosomes or chromosome arms.
Figure 6. Punctuated copy number evolution and phylogenetic trees
(a–c) Multi-cell segmentation (upper panels), trinary event matrices (lower panels), where white = 0, red = 1, and blue = −1 and maximum parsimony trees (right panels) from 3 TNBC patients: (a) T1, (b) T3 and (c) T8. Maximum parsimony trees are rooted by the diploid cells and non-clonal profiles were excluded from the analysis. Copy number events with non-integer values were filtered from all cells prior to tree construction and are shown in grey. (d) Linear and step fitting of sorted single cell CNA count data from 6 TNBC patients. Adj R2, BIC and AIC metric are also displayed for each fit.
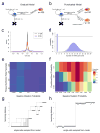
Figure 7. Mathematical modeling of punctuated and gradual tumor evolution
(a) Gradual model of multi-type stochastic birth-death-mutation process. (b) Punctuated model of multi-type stochastic birth-death-mutation process with a Poisson mutation burst probability distribution. (c) Fitness distributions with varying shape parameter values (alpha) that are used for sampling as new clones emerge during the binary branching process in the gradual or punctuated models. (d) Poisson probability distribution for multiple CNA events occurring in the punctuated model with a single atom (i.e. point mass) at 1 for single CNA events. (e) Heatmap of AMOVA analysis for different fitness distributions and mutation rates in the gradual model. (f) Heatmap of AMOVA analysis for different burst and mutation probabilities in the punctuated model. Colors indicate the proportion of simulations passing the ‘minimal punctuated criteria’, with p-values < 0.05 in AMOVA permutation and > 90% samples having root nodes with at least 5 CNAs to construct a tree. (g) Tree constructed from sampling 100 random single cells from simulated data generated from the gradual model. (h) Tree constructed from random sampling of 100 single cells from the simulated data from the punctuated model.
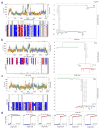
Figure 8. Inter-tumor heterogeneity and focal amplifications in TNBCs
(a) Frequency plot of CNAs across 12 TNBC patients with amplifications in red and deletions in blue. (b) t-SNE plot was calculated using all single aneuploid tumor cells from the 12 TNBC patients. Single cells were colored by individual patients. (c) Hierarchical clustering tree using ward linkage was constructed using pairwise Euclidean distances of all aneuploid tumor cells from the 12 TNBC patients.
Comment in
- A saltationist theory of cancer evolution.
Markowetz F. Markowetz F. Nat Genet. 2016 Sep 28;48(10):1102-3. doi: 10.1038/ng.3687. Nat Genet. 2016. PMID: 27681287
Similar articles
- Bursts of Chromosome Changes Drive TNBC.
[No authors listed] [No authors listed] Cancer Discov. 2016 Oct;6(10):1075. doi: 10.1158/2159-8290.CD-NB2016-110. Epub 2016 Sep 6. Cancer Discov. 2016. PMID: 27599500 - Single-Cell DNA Sequencing Reveals Punctuated and Gradual Clonal Evolution in Hepatocellular Carcinoma.
Guo L, Yi X, Chen L, Zhang T, Guo H, Chen Z, Cheng J, Cao Q, Liu H, Hou C, Qi L, Zhu Z, Liu Y, Kong R, Zhang C, Zhou X, Zhang Z, Song T, Xue R, Zhang N. Guo L, et al. Gastroenterology. 2022 Jan;162(1):238-252. doi: 10.1053/j.gastro.2021.08.052. Epub 2021 Sep 2. Gastroenterology. 2022. PMID: 34481846 - Tumour evolution inferred by single-cell sequencing.
Navin N, Kendall J, Troge J, Andrews P, Rodgers L, McIndoo J, Cook K, Stepansky A, Levy D, Esposito D, Muthuswamy L, Krasnitz A, McCombie WR, Hicks J, Wigler M. Navin N, et al. Nature. 2011 Apr 7;472(7341):90-4. doi: 10.1038/nature09807. Epub 2011 Mar 13. Nature. 2011. PMID: 21399628 Free PMC article. - Intratumor Heterogeneity: Novel Approaches for Resolving Genomic Architecture and Clonal Evolution.
Gupta RG, Somer RA. Gupta RG, et al. Mol Cancer Res. 2017 Sep;15(9):1127-1137. doi: 10.1158/1541-7786.MCR-17-0070. Epub 2017 Jun 8. Mol Cancer Res. 2017. PMID: 28596419 Review. - Cancer heterogeneity: converting a limitation into a source of biologic information.
Rübben A, Araujo A. Rübben A, et al. J Transl Med. 2017 Sep 8;15(1):190. doi: 10.1186/s12967-017-1290-9. J Transl Med. 2017. PMID: 28886708 Free PMC article. Review.
Cited by
- Drivers of dynamic intratumor heterogeneity and phenotypic plasticity.
Biswas A, De S. Biswas A, et al. Am J Physiol Cell Physiol. 2021 May 1;320(5):C750-C760. doi: 10.1152/ajpcell.00575.2020. Epub 2021 Mar 3. Am J Physiol Cell Physiol. 2021. PMID: 33657326 Free PMC article. Review. - A statistical learning method for simultaneous copy number estimation and subclone clustering with single-cell sequencing data.
Qin F, Cai G, Amos CI, Xiao F. Qin F, et al. Genome Res. 2024 Feb 7;34(1):85-93. doi: 10.1101/gr.278098.123. Genome Res. 2024. PMID: 38290978 Free PMC article. - Improving the efficiency of single-cell genome sequencing based on overlapping pooling strategy and CNV analysis.
Tu J, Yang Z, Lu N, Lu Z. Tu J, et al. R Soc Open Sci. 2022 Jan 26;9(1):211330. doi: 10.1098/rsos.211330. eCollection 2022 Jan. R Soc Open Sci. 2022. PMID: 35116153 Free PMC article. - PHLI-seq: constructing and visualizing cancer genomic maps in 3D by phenotype-based high-throughput laser-aided isolation and sequencing.
Kim S, Lee AC, Lee HB, Kim J, Jung Y, Ryu HS, Lee Y, Bae S, Lee M, Lee K, Kim RN, Park WY, Han W, Kwon S. Kim S, et al. Genome Biol. 2018 Oct 8;19(1):158. doi: 10.1186/s13059-018-1543-9. Genome Biol. 2018. PMID: 30296938 Free PMC article. - HBV genome-enriched single cell sequencing revealed heterogeneity in HBV-driven hepatocellular carcinoma (HCC).
Wang W, Chen Y, Wu L, Zhang Y, Yoo S, Chen Q, Liu S, Hou Y, Chen XP, Chen Q, Zhu J. Wang W, et al. BMC Med Genomics. 2022 Jun 16;15(1):134. doi: 10.1186/s12920-022-01264-2. BMC Med Genomics. 2022. PMID: 35710421 Free PMC article.
References
- Hanahan D, Weinberg RA. Hallmarks of cancer: the next generation. Cell. 2011;144:646–74. - PubMed
- Fearon ER, Vogelstein B. A genetic model for colorectal tumorigenesis. Cell. 1990;61:759–67. - PubMed
- Hoglund M, Gisselsson D, Hansen GB, Sall T, Mitelman F. Multivariate analysis of chromosomal imbalances in breast cancer delineates cytogenetic pathways and reveals complex relationships among imbalances. Cancer Res. 2002;62:2675–80. - PubMed
Publication types
MeSH terms
Substances
Grants and funding
- P30 CA016672/CA/NCI NIH HHS/United States
- R01 CA169244/CA/NCI NIH HHS/United States
- R21 CA174397/CA/NCI NIH HHS/United States
- U54 CA193461/CA/NCI NIH HHS/United States
- UL1 TR000371/TR/NCATS NIH HHS/United States
LinkOut - more resources
Full Text Sources
Other Literature Sources
Medical
