Microglia contact induces synapse formation in developing somatosensory cortex - PubMed (original) (raw)
Microglia contact induces synapse formation in developing somatosensory cortex
Akiko Miyamoto et al. Nat Commun. 2016.
Abstract
Microglia are the immune cells of the central nervous system that play important roles in brain pathologies. Microglia also help shape neuronal circuits during development, via phagocytosing weak synapses and regulating neurogenesis. Using in vivo multiphoton imaging of layer 2/3 pyramidal neurons in the developing somatosensory cortex, we demonstrate here that microglial contact with dendrites directly induces filopodia formation. This filopodia formation occurs only around postnatal day 8-10, a period of intense synaptogenesis and when microglia have an activated phenotype. Filopodia formation is preceded by contact-induced Ca(2+) transients and actin accumulation. Inhibition of microglia by genetic ablation decreases subsequent spine density, functional excitatory synapses and reduces the relative connectivity from layer 4 neurons. Our data provide the direct demonstration of microglial-induced spine formation and provide further insights into immune system regulation of neuronal circuit development, with potential implications for developmental disorders of immune and brain dysfunction.
Figures
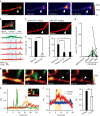
Figure 1. Microglia initiate filopodia formation in developing somatosensory cortex.
(a) Fluorescent image of P10 somatosensory cortex showing the distribution of L2/3 neurons (tdTomato, red) and microglia (EGFP, green), Scale bar, 50 μm. (b) Time-lapse in vivo images showing dendritic filopodia formation following microglia contact (white arrow indicates contact point, red represents dendrites, green represents microglia). Scale bar, 2 μm. (c) Histogram showing the distribution of latencies of filopodia formation following microglia contact (_n_=12 filopodia from 5 animals, bin size=1 min). (d) Filopodia formation rate at microglia contact points (contact) and at dendritic regions 10 and 20 μm adjacent to the contact point. ‘No contact' represents the entire dendrite, excluding the contact point (one-way ANOVA, post-hoc Bonfferoni test, error bars are mean ±s.e.m.; exact _P_-value is _P_=0.0000002; _n_=8 animals). (e) Survival rate of filopodia formed following microglia contact (black line) or formed without prior microglia contact (grey line) (two-way ANOVA, post-hoc Bonfferoni test, error bars are mean ±s.e.; exact _P_-value is _P_=0.11; _n_=25 dendrites from 9 animals). (f) Comparison of filopodia formation rates in dendrites at microglia contact points (contact) and at dendritic locations 10 μm adjacent to the contact points (10 μm) in three different age groups. Microglial contact-induced filopodia decreases over postnatal development (paired _t_-test, error bars are mean ±s.e.m.; exact _P_-values are _P_=0.0003 (P8–P10), _P_=0.37 (P12–P14), _P_=0.41 (P26–P30); P8–P10: _n_=8 animals, P12–P14: _n_=7 animals, P26–P30: _n_=6 animals).
Figure 2. Local dendritic Ca2+ elevation and actin accumulation may mediate microglia-induced filopodia formation.
(a) Ca2+ imaging in awake mouse in vivo. Left panel shows a dendrite (red) with a microglia (green) contact point indicated by the white arrow head. Subsequent panels show Ca2+ fluorescence at different times during the same microglia–dendrite contact. The white dotted line indicates the dendrite outline. (b) Upper left panel shows the same dendrite (red) and microglia (green) contact as in a and indicates the ROIs used to quantify the spatial and temporal aspects of Ca2+ elevation shown in the corresponding five traces in the right panel. The blue shading indicates the duration of the microglia–dendrite contact, which induced brief Ca2+ transients (indicated by asterisk) in ROIs 2 and 3, and a smaller sustained elevation in the microglial process (ROI 1). (c) _Z_-stacked images of the same dendrite before the Ca2+ imaging and transients were observed and following Ca2+ imaging. Arrowheads indicate microglia contacted point. Scale bar, 5 μm. (d) Local dendritic Ca2+ responses were exclusively associated with microglial contact. At dendritic contact sites, Ca2+ transients were absent before the contact, increased in frequency during the contact and typically decreased back towards zero after the contact. At dendritic locations 20 μm adjacent to the contact points, no localized Ca2+ responses were observed throughout the same imaging periods (20 μm _n_=3, before contact _n_=4, during contact _n_=11, after contact _n_=7 dendrites in 8 mice). (e) Averaged filopodia formation rates in dendrites in which microglial contact was associated with a Ca2+ transient compared with those dendrites in which there was no Ca2+ response-associated microglia contact (unpaired _t_-test, error bars are mean ±s.e.m., exact _P_-value is _P_=0.00006; with Ca2+: _n_=7 animals, without Ca2+: _n_=16 animals). (f) Lifetime of filopodia formed after microglial contact to dendrites in which a Ca2+ response was observed and in those in which microglial contact was not associated with a dendritic Ca2+ transient. These experiments were conducted in awake mice and are compared with lifetimes of filopodia arising after microglial contact in dendrites of anaesthetized mice (one-way ANOVA, post-hoc Bonfferoni test, error bars are mean ±s.e.m., exact _P_-values are _P_=0.002 (awake Ca2+, awake no Ca2+), _P_=0.0003 (awake Ca2+, anaesthesia), _P_=1 (awake no Ca2+, anaesthesia); awake Ca2+: _n_=7, awake no Ca2+: _n_=5, anaesthesia: _n_=16 dendrites). (g) Time-lapse in vitro imaging of actin accumulation after microglia contact with a dendrite in a cortical slice culture transfected with pCMV-lifeact-mCherry. Arrowhead indicates microglia contact point. mCherry colour intensity scale shown in arbitrary units; green, microglia. Scale bar, 2 μm. (h) Quantification of the time course of fluorescence changes for the images illustrated in G (microglia, green; lifeact-mCherry, yellow; filopodia, red). The inset shows the ROI used to quantify fluorescence (white box for microglia process and dendritic filopodia, yellow box for actin accumulation). Yellow arrow indicates end of the microglia contact. Red arrow indicates start of filopodia formation. (i) Left: representative time course of normalized lifeact-mCherry fluorescent intensity changes within the dendrite at a microglia contact site (red) and at an adjacent dendritic site 10 μm from the contact point (blue). Black arrow indicates onset of filopodia formation. Right: averaged fluorescent intensity values from 5 to 10 min after microglia contact at contact sites was significantly increased compared with that at adjacent sites 10 μm from the microglia contact points during the same time period (right) (paired _t_-test, error bars are mean ±s.e., exact _P_-value is _P_=0.0003; _n_=6 sites).
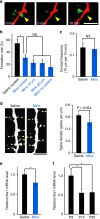
Figure 3. Treatment with Mino decreases filopodia formation.
(a) Time-lapse in vivo images of microglia–dendrite interaction in Mino-treated mice, illustrating contact that was not followed by filopodia formation. Yellow arrowhead indicates the contact point. Scale bar, 5 μm. (b) Filopodia formation rate at microglia contact points (contact) was significantly decreased in Mino-treated mice, as compared with control saline-injected mice, and was the same as observed at dendritic regions 10 or 20 μm adjacent to the contact point, or across the the whole dendrite (excluding the contact region) (one-way ANOVA, post-hoc Tukey's test, error bars are mean ±s.e.m.; exact _P_-values are _P_=0.016 (Mino, Saline), _P_=0.96147 (Mino contact, Mino 10 μm), _P_=0.84726 (Mino contact, Mino 20 μm), _P_=0.57751 (Mino contact, Mino no contact); Saline _n_=13, Mino _n_=10 animals). (c) Mino did not significantly affect the microglia–dendrite contact frequency (unpaired _t_-test, error bars are mean ±s.e.m.; exact _P_-value is _P_=0.86; Saline _n_=13, Mino _n_=10 animals). (d) The spine density in basal dendrites of L2/3 pyramidal neurons from Mino (right)-injected mice tended to be smaller than in saline-injected mice. Left panel, sample image, yellow arrowheads indicate spines. Scale bar, 5 μm. Right panel, mean spine densities (unpaired _t_-test, error bars are mean ±s.e.m.; exact - value is _P_=0.054; Saline _n_=9, Mino _n_=10 mice). (e) Iba1 mRNA levels were higher in the cortex of P8 saline-injected mouse compared with age-matched Mino-injected mice (unpaired _t_-test, error bars are mean ±s.e.; exact _P_-value is _P_=0.019; Saline _n_=4, Mino _n_=4 animals). (f) Cortical Iba1 mRNA levels were significantly decreased over age, from P9 through to P14 or P30 mice (one-way ANOVA, post-hoc Bonfferoni test, error bars are mean ±s.e.; exact _P_-values are _P_=0.032(P9, P14), _P_=0.037(P9, P30); P9 _n_=3, P14 _n_=3, P30 _n_=3 animals).
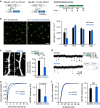
Figure 4. Microglia ablation reduces the number of functional synapses.
(a) Left panel: schematic of the ablation strategy used to reduce microglia by transient withdrawal of dietary Dox. Arrows in the right panel indicate brain fixation times for microglial histology. (b) Sample fluorescent images from P8 mice (left) and averaged data (right) showing reduced Iba1 (microglia) immune reactivity in P8 Iba1-tTA::tetO-DTA transgenic mice following Dox withdrawal from P5 to P10, as compared with the Iba1-tTA mice (control) at P8. Scale bar in left panel, 50 μm. The recovery of microglial density by P15 (right panel) is noteworthy (unpaired _t_-test, error bars are mean ±s.e.m.; P8: exact _P_-value is _P_=9.3E−5, P15: exact _P_-value is _P_=0.15, P22, exact _P_-value is _P_=0.27, P30: exact _P_-value is _P_=0.33; P8: (control _n_=6, ablated _n_=8 animals), P15: (control _n_=4, ablated _n_=4 animals), P22: (control _n_=4, ablated _n_=4 animals), P30: (control _n_=4, ablated _n_=4 animals)). (c) Typical images of dendritic spines (yellow arrowheads) in L2/3 pyramidal neurons from control (left) and microglia-ablated mice (right). Scale bar, 5 μm. The mean spine density (right panel) was significantly reduced in microglia-ablated mice (unpaired _t_-test, error bars are mean ±s.e.m.; exact _P_-value is _P_=6.26E−5; Control _n_=7, Ablated _n_=6 animals). (d) Representative current traces from voltage-clamped L2/3 pyramidal neurons from P12 control and microglia-ablated mice, 6 days after Dox withdrawal, as indicated by the upper right experimental schematic. Arrowheads indicate mEPSCs. Inset indicates averaged (_n_∼10) mEPSCs from each condition. Scale bar, 5 pA, 10 ms. (e) Typical cumulative mEPSC frequency (e, left) and amplitude (f, left) distributions from a control and microglia-ablated mouse. Accompanying bar graphs show averaged date for mEPSC frequency (e, right) and mEPSC amplitude (f, right). Mean frequency was significantly reduced by transient microglia ablation (unpaired _t_-test, error bars are mean ±s.e.; exact _P_-values are _P_=0.0012 (e, right), _P_=0.14 (f, right); Control _n_=10 neurons from 5 animals, Ablated _n_=9 neurons from 3 animals).
Figure 5. Microglia ablation selectively impairs L4 to L2/3 synaptic connections.
(a, left) Differential interference contrast image of a slice of barrel cortex, showing the cell layers and with a recording electrode positioned in L2/3. Red arrows indicate L4 barrels. Scale bar, 100 μm. (a, right) Scatterplot of the position of L2/3 pyramidal cells from which recordings were made, at a depth relative to layer 1 (dashed line in a, left) and at a horizontal distance from the centre of a single barrel (open triangles for control mice, blue triangles for DTA mice). (b) Representative heat maps and input strength-depth profiles (black line and grey shading represent mean and s.e., respectively) from a control (b, left) and microglia ablated (b, right) cortical slice. Photo-stimulation was applied throughout the slice with the colour and contours representing the sum the amplitudes of EPSCs evoked by stimulation at each position. Triangles indicate the location of the recorded L2/3 pyramidal cell. Dashed white lines indicate the laminar borders. (c) Averaged amplitude of excitatory synaptic currents in response to stimulation from the top of L2/3 through to L6. Black line and grey or blue shadow indicate mean and s.e., respectively (Control versus DTA mice for stimulation of each location) (unpaired _t_-test; exact _P_-value is _P_=0.031 or _P_=0.044; Control _n_=9 from 4 animals, DTA _n_=5 from 3 animals). (d) The strength of synaptic inputs (mean±s.e.m.) grouped across the whole layer and spontaneous EPSCs (Spn) (unpaired _t_-test; exact _P_-value is _P_=0.032).
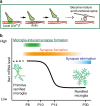
Figure 6. Scheme of microglia functions during synaptogenesis.
(a) Sequence of proposed cellular events during synapse formation: Microglial contact initiates a rise in local [Ca2+]i resulting in actin accumulation and filopodia formation. Some filopodia find presynaptic partners and mature into functional synapses. (b) Schematic graph depicting a change in microglia phenotype and function, from immature or activated microglia inducing filopodia formation and enhancing specific circuit synapse formation during early synaptogenesis, followed by a putative role in synapse elimination by more mature, quiescent microglia in the latter period of circuit formation.
Similar articles
- Microglia Enhance Synapse Activity to Promote Local Network Synchronization.
Akiyoshi R, Wake H, Kato D, Horiuchi H, Ono R, Ikegami A, Haruwaka K, Omori T, Tachibana Y, Moorhouse AJ, Nabekura J. Akiyoshi R, et al. eNeuro. 2018 Oct 25;5(5):ENEURO.0088-18.2018. doi: 10.1523/ENEURO.0088-18.2018. eCollection 2018 Sep-Oct. eNeuro. 2018. PMID: 30406198 Free PMC article. - Activity-regulated dynamic behavior of early dendritic protrusions: evidence for different types of dendritic filopodia.
Portera-Cailliau C, Pan DT, Yuste R. Portera-Cailliau C, et al. J Neurosci. 2003 Aug 6;23(18):7129-42. doi: 10.1523/JNEUROSCI.23-18-07129.2003. J Neurosci. 2003. PMID: 12904473 Free PMC article. - Microglia remodel synapses by presynaptic trogocytosis and spine head filopodia induction.
Weinhard L, di Bartolomei G, Bolasco G, Machado P, Schieber NL, Neniskyte U, Exiga M, Vadisiute A, Raggioli A, Schertel A, Schwab Y, Gross CT. Weinhard L, et al. Nat Commun. 2018 Mar 26;9(1):1228. doi: 10.1038/s41467-018-03566-5. Nat Commun. 2018. PMID: 29581545 Free PMC article. - Dual functions of microglia in the formation and refinement of neural circuits during development.
Konishi H, Kiyama H, Ueno M. Konishi H, et al. Int J Dev Neurosci. 2019 Oct;77:18-25. doi: 10.1016/j.ijdevneu.2018.09.009. Epub 2018 Oct 4. Int J Dev Neurosci. 2019. PMID: 30292872 Review. - Emerging Roles of Filopodia and Dendritic Spines in Motoneuron Plasticity during Development and Disease.
Kanjhan R, Noakes PG, Bellingham MC. Kanjhan R, et al. Neural Plast. 2016;2016:3423267. doi: 10.1155/2016/3423267. Epub 2015 Dec 30. Neural Plast. 2016. PMID: 26843990 Free PMC article. Review.
Cited by
- Microglia govern the extinction of acute stress-induced anxiety-like behaviors in male mice.
Chen D, Lou Q, Song XJ, Kang F, Liu A, Zheng C, Li Y, Wang D, Qun S, Zhang Z, Cao P, Jin Y. Chen D, et al. Nat Commun. 2024 Jan 10;15(1):449. doi: 10.1038/s41467-024-44704-6. Nat Commun. 2024. PMID: 38200023 Free PMC article. - Microglial control of neuronal development via somatic purinergic junctions.
Cserép C, Schwarcz AD, Pósfai B, László ZI, Kellermayer A, Környei Z, Kisfali M, Nyerges M, Lele Z, Katona I, Ádám Dénes. Cserép C, et al. Cell Rep. 2022 Sep 20;40(12):111369. doi: 10.1016/j.celrep.2022.111369. Cell Rep. 2022. PMID: 36130488 Free PMC article. - Microglial motility is modulated by neuronal activity and correlates with dendritic spine plasticity in the hippocampus of awake mice.
Nebeling FC, Poll S, Justus LC, Steffen J, Keppler K, Mittag M, Fuhrmann M. Nebeling FC, et al. Elife. 2023 Feb 7;12:e83176. doi: 10.7554/eLife.83176. Elife. 2023. PMID: 36749020 Free PMC article. - The phenotypic and functional properties of mouse yolk-sac-derived embryonic macrophages.
Yosef N, Vadakkan TJ, Park JH, Poché RA, Thomas JL, Dickinson ME. Yosef N, et al. Dev Biol. 2018 Oct 1;442(1):138-154. doi: 10.1016/j.ydbio.2018.07.009. Epub 2018 Jul 30. Dev Biol. 2018. PMID: 30016639 Free PMC article. - Microglia and astrocytes mediate synapse engulfment in a MER tyrosine kinase-dependent manner after traumatic brain injury.
Shen H, Shi XJ, Qi L, Wang C, Mamtilahun M, Zhang ZJ, Chung WS, Yang GY, Tang YH. Shen H, et al. Neural Regen Res. 2023 Aug;18(8):1770-1776. doi: 10.4103/1673-5374.363187. Neural Regen Res. 2023. PMID: 36751804 Free PMC article.
References
- Patterson P. H. Immune involvement in schizophrenia and autism: etiology, pathology and animal models. Behav. Brain Res. 204, 313–321 (2009). - PubMed
- Zhan Y. et al.. Deficient neuron-microglia signaling results in impaired functional brain connectivity and social behavior. Nat. Neurosci. 17, 400–406 (2014). - PubMed
Publication types
MeSH terms
LinkOut - more resources
Full Text Sources
Other Literature Sources
Molecular Biology Databases
Research Materials
Miscellaneous


