Spastin, atlastin, and ER relocalization are involved in axon but not dendrite regeneration - PubMed (original) (raw)
Spastin, atlastin, and ER relocalization are involved in axon but not dendrite regeneration
Kavitha Rao et al. Mol Biol Cell. 2016.
Abstract
Mutations in >50 genes, including spastin and atlastin, lead to hereditary spastic paraplegia (HSP). We previously demonstrated that reduction of spastin leads to a deficit in axon regeneration in a Drosophila model. Axon regeneration was similarly impaired in neurons when HSP proteins atlastin, seipin, and spichthyin were reduced. Impaired regeneration was dependent on genetic background and was observed when partial reduction of HSP proteins was combined with expression of dominant-negative microtubule regulators, suggesting that HSP proteins work with microtubules to promote regeneration. Microtubule rearrangements triggered by axon injury were, however, normal in all genotypes. We examined other markers to identify additional changes associated with regeneration. Whereas mitochondria, endosomes, and ribosomes did not exhibit dramatic repatterning during regeneration, the endoplasmic reticulum (ER) was frequently concentrated near the tip of the growing axon. In atlastin RNAi and spastin mutant animals, ER accumulation near single growing axon tips was impaired. ER tip concentration was observed only during axon regeneration and not during dendrite regeneration. In addition, dendrite regeneration was unaffected by reduction of spastin or atlastin. We propose that the HSP proteins spastin and atlastin promote axon regeneration by coordinating concentration of the ER and microtubules at the growing axon tip.
© 2016 Rao et al. This article is distributed by The American Society for Cell Biology under license from the author(s). Two months after publication it is available to the public under an Attribution–Noncommercial–Share Alike 3.0 Unported Creative Commons License (http://creativecommons.org/licenses/by-nc-sa/3.0).
Figures
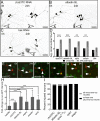
FIGURE 1:
Axon regeneration in neurons with reduced levels of HSP proteins. Class I neurons were labeled with UAS-EB1-GFP under the control of 221-GAL4. The axon of the ddaE neuron was severed using a pulsed UV laser (0-h time point), and the same neuron was imaged after 96 h. A white arrowhead in each image indicates the new axon. (A) In neurons expressing control RNAi (γtub37C RNAi), one of the dendrites was converted into an axon as indicated. (B–D) In neurons expressing atlastin, seipin, or spichthyin RNAi, regrowth was significantly reduced. Arrows indicate cut site. Scale bars, 50 μm. (E) Regrowth after axon injury is quantified. Long and short bars indicate averages and SDs, respectively. (F) Quantification of axon regeneration in spastin mutants using mCD8-GFP as a cell-shape marker. (G) Quantification of axon regeneration in neurons expressing HSP RNAis using mCD8-GFP as a cell-shape marker.
FIGURE 2:
Dendrite regeneration in neurons with reduced levels of HSP proteins. (A–E) Class I ddaE neurons were labeled with EB1-GFP, and all dendrites were removed by laser ablation. Arrows indicate laser cut sites. Injured neurons were imaged after 96 h to track dendrite regrowth. (F) Number of dendrite branch points counted before (0 h) and after injury (96 h). Columns indicate average number of branch points. Error bars denote SD.
FIGURE 3:
Early responses to axon injury are not perturbed by the loss of HSP proteins. (A–C) Examples of microtubule dynamics in control, atlastin, and bsk RNAi in uninjured neurons (0 h) and 24 h after injury. Microtubule dynamics was quantified by counting the number of EB1-GFP comets in a 10-μm region of the class I ddaE dendrite in uninjured neurons (0 h) and 24 h after axon injury. White arrows indicate location of cell body, and black arrowheads show individual EB1-GFP comets. Scale bars, 10 μm. (D) Average number of EB1-GFP comets for each time point. Error bars show SD. (E–G) Class I ddaE neurons (white arrows) expressing mCD8-RFP and puc-GFP were subjected to proximal axotomy in control neurons or neurons expressing HSP RNAis. Intensity of puc-GFP in the nucleus was measured at the time of injury (0 h) and 24 h after injury and normalized to that of the uninjured ddaD neuron (arrowheads). Scale bars, 10 μm. (H) Average fold change in puc-GFP intensity from 0 to 24 h. Error bars indicate SD. (I) Class I ddaE neurons expressing EB1-GFP and HSP RNAis were axotomized, and microtubule polarity was analyzed in the dendrites 96 h postinjury. Percentage of neurons in each genotype that were injured. Black regions of the columns denote neurons with at least one plus-end-out neurite, and gray regions denote neurons with all minus-end-out neurites. ***p < 0.001.
FIGURE 4:
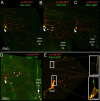
The ER preferentially accumulates in the regenerating axon after injury. Axons of class I ddaE neurons were severed (0 h), and regeneration was tracked in the injured neurons 96 h later. mCD8-RFP was used as a cell-shape marker in all cases. Arrows indicate cut site close to the cell body. (A) Mitochondria were labeled using mito-GFP. (B) Ribosomes were labeled using YFP-tagged L10. Asterisks indicate positions of YFP-L10 punctae in the new axon. (C) Smooth ER was labeled with Rtnl1-GFP. (D) Endosomes were labeled using Rab5-YFP. Asterisks indicate positions of Rab5-YFP punctae in the new axon. (E) Superresolution images of class I ddaE neurons labeled with mCD8-RFP and Rtnl1-GFP. Insets show close-up view (3.3× zoom) of Rtnl1-GFP labeling within the cell. Scale bars, 5 μm (inset).
FIGURE 5:
GFP-IP3R labels the ER and accumulates in regenerating axon tips. (A, B) A class I ddaE neuron labeled with mCD8-RFP and imaged 96 h after proximal axotomy. Arrows indicate the tip of the new axon. The boxed area and inset show GFP-IP3R labeling at the axon tip. Scale bar, 25 μm. (C) Quantification of the percentage of neurons with GFP-IP3R signal at the tip of the regenerating axon (n = 19). (D) Peptidergic neurons (white arrow) were labeled with GFP-IP3R under the control of 386-GAL4. Superresolution microscopy was used to visualize the distribution of GFP-IP3R in the cell body.
FIGURE 6:
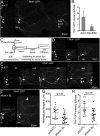
ER distribution during axon and dendrite regeneration. (A) The axon of a class I ddaE neuron expressing UAS-Rtnl1-GFP was severed and imaged immediately after injury (0 h) and 96 h later. Arrows indicate cut site. An accumulation of Rtnl1-GFP was observed at the regrowing axon tip. (B) Average fold change in Rtnl1-GFP intensity from axon base to tip compared with the fold change in intensity in a dendrite in the same cell. Error bars denote SD. (C) A 100-μm region at the end of the new axon was considered as the “tip,” and the proximal region was considered as the “base.” Rtnl1-GFP intensity was measured in the brightest 10-μm region within the tip and the base of the new axon. For comparison, the tip/base ratio of Rtnl1-GFP fluorescence in a nongrowing dendrite in each cell was also calculated. Error bars indicate the SD. (D) Dendrites of class I ddaE neurons expressing Rtnl1-GFP were removed (arrows show cut sites), and the injured neuron was imaged 48 and 96 h postinjury to track dendrite regeneration. There was no accumulation of Rtnl1-GFP in the tips of regrowing dendrites. (E) Class I ddaE neurons expressing control RNAi and Rtnl1-GFP were proximally axotomized, and ER localization was tracked at 24, 48, and 96; an example is shown. White arrows in the 48- and 96-h images show ER accumulation in the new axon. (F) Class I ddaE neurons expressing Rtnl1-GFP and atlastin BL RNAi were subjected to proximal axotomy (0 h) and imaged after 96 h. White arrowhead indicates regenerating neurite. (G) Quantification of regeneration in control and atlastin knockdown neurons. (H) Quantification of Rtnl1-GFP accumulation in axon tips in atlastin knockdown neurons and control neurons. The error bars are SDs, and an unpaired t test was used to calculate p values.
FIGURE 7:
ER distribution during regeneration in spastin mutant neurons. ER accumulation patterns in class I ddaE neurons during injury-induced axon regeneration. White arrows indicate the ddaE cell body. (A) An injured neuron that failed to regrow and has Rtnl1-GFP accumulation in multiple neurites (red arrows), (B) an injured neuron with <75 μm of regrowth and Rtnl1-GFP accumulation in a single neurite (orange arrow), (C) an injured neuron with >75 μm of regrowth and Rtnl1-GFP accumulation in the regrowing neurite (green arrow; green dashed lines trace the new axon. White dotted lines show a dendrite from a neighboring neuron), and (D) an injured neuron with multiple neurites regrowing, each with Rtnl1-GFP accumulation in the tips (blue arrows). (E) Quantification of regeneration in control (yw) and spas5.75/10-12 neurons. Long and short horizontal bars indicate mean and SD respectively, and an unpaired t test was used to calculate significance. (F) Percentage of neurons with ER accumulation in single or multiple neurite tips in control and spas5.75/10-12 neurons. (G) Percentage of neurons with different categories of growth and ER accumulation patterns. Colors correspond to arrows in A–D.
FIGURE 8:
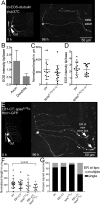
Microtubules accumulate in regenerating axon tips. (A) Class I ddaE neurons expressing tdEOS-αtubulin and control RNAi (γtub37C RNAi) were subjected to proximal axotomy and imaged 96 h after injury. The new axon has an accumulation of tdEOS near the growing tip. (B) Microtubule accumulation in the axon was measured and compared with a dendrite in the same cell. Average fold increase in tdEOS intensity in the axon and dendrite tips. Error bars show SD. (C) Axon regeneration was measured in control (yw) and spastin mutant neurons. (D) tdEOS intensity in the growing axon tips of spastin mutant and control neurons. (E) An example of a class I ddaE neuron expressing Rtnl1-GFP and EB1-CT and harboring the spas5.75/+ allele, subjected to proximal axotomy and imaged 96 h after injury. Rtnl1-GFP accumulation in axon tips is indicated by white arrows. (F) Quantification of regeneration in class I ddaE neurons expressing Rtnl1-GFP combined with either EB1-CT only, spas5.75/+ only, or both EB1-CT and spas5.75/+. Long and short bars indicate averages and SDs, respectively, and the p value was calculated with an unpaired t test. (G) Quantification of percentage of injured neurons in F with ER accumulation at a single axon tip (black) or at multiple axon tips (gray).
Similar articles
- Hereditary spastic paraplegia proteins REEP1, spastin, and atlastin-1 coordinate microtubule interactions with the tubular ER network.
Park SH, Zhu PP, Parker RL, Blackstone C. Park SH, et al. J Clin Invest. 2010 Apr;120(4):1097-110. doi: 10.1172/JCI40979. J Clin Invest. 2010. PMID: 20200447 Free PMC article. - Interaction of two hereditary spastic paraplegia gene products, spastin and atlastin, suggests a common pathway for axonal maintenance.
Evans K, Keller C, Pavur K, Glasgow K, Conn B, Lauring B. Evans K, et al. Proc Natl Acad Sci U S A. 2006 Jul 11;103(28):10666-71. doi: 10.1073/pnas.0510863103. Epub 2006 Jun 30. Proc Natl Acad Sci U S A. 2006. PMID: 16815977 Free PMC article. - Normal spastin gene dosage is specifically required for axon regeneration.
Stone MC, Rao K, Gheres KW, Kim S, Tao J, La Rochelle C, Folker CT, Sherwood NT, Rolls MM. Stone MC, et al. Cell Rep. 2012 Nov 29;2(5):1340-50. doi: 10.1016/j.celrep.2012.09.032. Epub 2012 Nov 1. Cell Rep. 2012. PMID: 23122959 Free PMC article. - Hereditary spastic paraplegia SPG4: what is known and not known about the disease.
Solowska JM, Baas PW. Solowska JM, et al. Brain. 2015 Sep;138(Pt 9):2471-84. doi: 10.1093/brain/awv178. Epub 2015 Jun 20. Brain. 2015. PMID: 26094131 Free PMC article. Review. - The AAA ATPase spastin links microtubule severing to membrane modelling.
Lumb JH, Connell JW, Allison R, Reid E. Lumb JH, et al. Biochim Biophys Acta. 2012 Jan;1823(1):192-7. doi: 10.1016/j.bbamcr.2011.08.010. Epub 2011 Aug 25. Biochim Biophys Acta. 2012. PMID: 21888932 Review.
Cited by
- Effects of DeSUMOylated Spastin on AMPA Receptor Surface Delivery and Synaptic Function Are Enhanced by Phosphorylating at Ser210.
Zhang W, Zhang J, Zhang Z, Cha S, Li J, Chen L, Wu J, Teng J, Guo G, Zhang J. Zhang W, et al. Mol Neurobiol. 2024 Aug;61(8):6045-6059. doi: 10.1007/s12035-024-03935-w. Epub 2024 Jan 24. Mol Neurobiol. 2024. PMID: 38267753 - Extrinsic Repair of Injured Dendrites as a Paradigm for Regeneration by Fusion in Caenorhabditis elegans.
Oren-Suissa M, Gattegno T, Kravtsov V, Podbilewicz B. Oren-Suissa M, et al. Genetics. 2017 May;206(1):215-230. doi: 10.1534/genetics.116.196386. Epub 2017 Mar 10. Genetics. 2017. PMID: 28283540 Free PMC article. - Drosophila SPG12 ortholog, reticulon-like 1, governs presynaptic ER organization and Ca2+ dynamics.
Pérez-Moreno JJ, Smith RC, Oliva MK, Gallo F, Ojha S, Müller KH, O'Kane CJ. Pérez-Moreno JJ, et al. J Cell Biol. 2023 Jun 5;222(6):e202112101. doi: 10.1083/jcb.202112101. Epub 2023 Mar 23. J Cell Biol. 2023. PMID: 36952540 Free PMC article. - Ciliated sensory neurons can regenerate axons after complete axon removal.
Stone MC, Mauger AS, Rolls MM. Stone MC, et al. J Exp Biol. 2023 Jun 15;226(12):jeb245717. doi: 10.1242/jeb.245717. Epub 2023 Jun 21. J Exp Biol. 2023. PMID: 37212026 Free PMC article. - Therapeutic Strategies for Mutant _SPAST_-Based Hereditary Spastic Paraplegia.
Mohan N, Qiang L, Morfini G, Baas PW. Mohan N, et al. Brain Sci. 2021 Aug 18;11(8):1081. doi: 10.3390/brainsci11081081. Brain Sci. 2021. PMID: 34439700 Free PMC article. Review.
References
- Akhmanova A, Steinmetz MO. Tracking the ends: a dynamic protein network controls the fate of microtubule tips. Nat Rev Mol Cell Biol. 2008;9:309–322. - PubMed
- Deluca GC, Ebers GC, Esiri MM. The extent of axonal loss in the long tracts in hereditary spastic paraplegia. Neuropathol Appl Neurobiol. 2004;30:576–584. - PubMed
MeSH terms
Substances
LinkOut - more resources
Full Text Sources
Other Literature Sources
Molecular Biology Databases


