Insights into the Genetic Relationships and Breeding Patterns of the African Tea Germplasm Based on nSSR Markers and cpDNA Sequences - PubMed (original) (raw)
Insights into the Genetic Relationships and Breeding Patterns of the African Tea Germplasm Based on nSSR Markers and cpDNA Sequences
Moses C Wambulwa et al. Front Plant Sci. 2016.
Abstract
Africa is one of the key centers of global tea production. Understanding the genetic diversity and relationships of cultivars of African tea is important for future targeted breeding efforts for new crop cultivars, specialty tea processing, and to guide germplasm conservation efforts. Despite the economic importance of tea in Africa, no research work has been done so far on its genetic diversity at a continental scale. Twenty-three nSSRs and three plastid DNA regions were used to investigate the genetic diversity, relationships, and breeding patterns of tea accessions collected from eight countries of Africa. A total of 280 African tea accessions generated 297 alleles with a mean of 12.91 alleles per locus and a genetic diversity (H S) estimate of 0.652. A STRUCTURE analysis suggested two main genetic groups of African tea accessions which corresponded well with the two tea types Camellia sinensis var. sinensis and C. sinensis var. assamica, respectively, as well as an admixed "mosaic" group whose individuals were defined as hybrids of F2 and BC generation with a high proportion of C. sinensis var. assamica being maternal parents. Accessions known to be C. sinensis var. assamica further separated into two groups representing the two major tea breeding centers corresponding to southern Africa (Tea Research Foundation of Central Africa, TRFCA), and East Africa (Tea Research Foundation of Kenya, TRFK). Tea accessions were shared among countries. African tea has relatively lower genetic diversity. C. sinensis var. assamica is the main tea type under cultivation and contributes more in tea breeding improvements in Africa. International germplasm exchange and movement among countries within Africa was confirmed. The clustering into two main breeding centers, TRFCA, and TRFK, suggested that some traits of C. sinensis var. assamica and their associated genes possibly underwent selection during geographic differentiation or local breeding preferences. This study represents the first step toward effective utilization of differently inherited molecular markers for exploring the breeding status of African tea. The findings here will be important for planning the exploration, utilization, and conservation of tea germplasm for future breeding efforts in Africa.
Keywords: African tea germplasm; Camellia sinensis; breeding improvement; cpDNA regions; genetic diversity; nSSR markers.
Figures
Figure 1
Bayesian assignment of probabilities using STRUCTURE based on 23 nSSR loci of the 280 tea accessions.
Figure 2
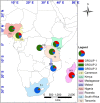
Geographical distribution of nSSR genetic groups considered following STRUCTURE analysis at K = 3. Each country is depicted as a pie chart with the proportional membership of its alleles to each one of the three groups. A shape file with genotype proportions in the different countries was generated in DIVA-GIS v7.5.0.0 (
). The shape file was then used to generate the map in ArcGIS v10.2.2 (
).
Figure 3
Bayesian assignment of probabilities in NewHybrids for 280 tea accessions from Africa. The defined categories are parent 1 (P1), parent 2 (P2), first filial generation (F1), second filial generation (F2), backcross to P1 (BC1), and backcross to P2 (BC2).
Figure 4
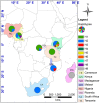
Geographical distribution of the nine cpDNA found in the 280 samples across eight countries in Africa. The map was generated using DIVA-GIS and ArcGIS software as described in Figure 2.
Figure 5
Median-joining haplotype network based on three combined cpDNA regions of 84 tea samples from eight African countries. Broken lines delineate closely related haplotypes. Circles in colors denote different haplotypes (H1-H9), and the size of each circle is proportional to the number of accessions sharing that particular haplotype. Each branch between haplotypes denotes a mutational step. The small black circles represent independent mutation events converging on a shared haplotype.
Figure 6
Neighbor joining tree of 84 tea samples. Each color represents a particular haplotype and corresponds to colors in Figure 5.
Similar articles
- From the Wild to the Cup: Tracking Footprints of the Tea Species in Time and Space.
Wambulwa MC, Meegahakumbura MK, Kamunya S, Wachira FN. Wambulwa MC, et al. Front Nutr. 2021 Aug 6;8:706770. doi: 10.3389/fnut.2021.706770. eCollection 2021. Front Nutr. 2021. PMID: 34422884 Free PMC article. Review. - Development of STS and CAPS markers for variety identification and genetic diversity analysis of tea germplasm in Taiwan.
Hu CY, Tsai YZ, Lin SF. Hu CY, et al. Bot Stud. 2014 Dec;55(1):12. doi: 10.1186/1999-3110-55-12. Epub 2014 Feb 1. Bot Stud. 2014. PMID: 28510923 Free PMC article. - Multiple origins and a narrow genepool characterise the African tea germplasm: concordant patterns revealed by nuclear and plastid DNA markers.
Wambulwa MC, Meegahakumbura MK, Kamunya S, Muchugi A, Möller M, Liu J, Xu JC, Li DZ, Gao LM. Wambulwa MC, et al. Sci Rep. 2017 Jun 22;7(1):4053. doi: 10.1038/s41598-017-04228-0. Sci Rep. 2017. PMID: 28642589 Free PMC article. - Genetic analyses of ancient tea trees provide insights into the breeding history and dissemination of Chinese Assam tea (Camellia sinensis var. assamica).
Li MM, Meegahakumbura MK, Wambulwa MC, Burgess KS, Möller M, Shen ZF, Li DZ, Gao LM. Li MM, et al. Plant Divers. 2023 Jun 8;46(2):229-237. doi: 10.1016/j.pld.2023.06.002. eCollection 2024 Mar. Plant Divers. 2023. PMID: 38807909 Free PMC article. - Application of Multi-Perspectives in Tea Breeding and the Main Directions.
Li H, Song K, Zhang X, Wang D, Dong S, Liu Y, Yang L. Li H, et al. Int J Mol Sci. 2023 Aug 10;24(16):12643. doi: 10.3390/ijms241612643. Int J Mol Sci. 2023. PMID: 37628823 Free PMC article. Review.
Cited by
- Genetic, evolutionary and phylogenetic aspects of the plastome of annatto (Bixa orellana L.), the Amazonian commercial species of natural dyes.
Gomes Pacheco T, de Santana Lopes A, Monteiro Viana GD, Nascimento da Silva O, Morais da Silva G, do Nascimento Vieira L, Guerra MP, Nodari RO, Maltempi de Souza E, de Oliveira Pedrosa F, Otoni WC, Rogalski M. Gomes Pacheco T, et al. Planta. 2019 Feb;249(2):563-582. doi: 10.1007/s00425-018-3023-6. Epub 2018 Oct 11. Planta. 2019. PMID: 30310983 - From the Wild to the Cup: Tracking Footprints of the Tea Species in Time and Space.
Wambulwa MC, Meegahakumbura MK, Kamunya S, Wachira FN. Wambulwa MC, et al. Front Nutr. 2021 Aug 6;8:706770. doi: 10.3389/fnut.2021.706770. eCollection 2021. Front Nutr. 2021. PMID: 34422884 Free PMC article. Review. - Domestication Origin and Breeding History of the Tea Plant (Camellia sinensis) in China and India Based on Nuclear Microsatellites and cpDNA Sequence Data.
Meegahakumbura MK, Wambulwa MC, Li MM, Thapa KK, Sun YS, Möller M, Xu JC, Yang JB, Liu J, Liu BY, Li DZ, Gao LM. Meegahakumbura MK, et al. Front Plant Sci. 2018 Jan 25;8:2270. doi: 10.3389/fpls.2017.02270. eCollection 2017. Front Plant Sci. 2018. PMID: 29422908 Free PMC article. - Unravelling the genetic diversity and population structure of common walnut in the Iranian Plateau.
Shahi Shavvon R, Qi HL, Mafakheri M, Fan PZ, Wu HY, Bazdid Vahdati F, Al-Shmgani HS, Wang YH, Liu J. Shahi Shavvon R, et al. BMC Plant Biol. 2023 Apr 18;23(1):201. doi: 10.1186/s12870-023-04190-2. BMC Plant Biol. 2023. PMID: 37072719 Free PMC article. - Genetic diversity, linkage disequilibrium, and population structure analysis of the tea plant (Camellia sinensis) from an origin center, Guizhou plateau, using genome-wide SNPs developed by genotyping-by-sequencing.
Niu S, Song Q, Koiwa H, Qiao D, Zhao D, Chen Z, Liu X, Wen X. Niu S, et al. BMC Plant Biol. 2019 Jul 23;19(1):328. doi: 10.1186/s12870-019-1917-5. BMC Plant Biol. 2019. PMID: 31337341 Free PMC article.
References
- Ahmed S., Stepp J. R., Orians C., Griffin T., Matyas C., Robbat A., et al. . (2014). Effects of extreme climate events on tea (Camellia sinensis) functional quality validate indigenous farmer knowledge and sensory preferences in tropical China. PLoS ONE 9:e109126. 10.1371/journal.pone.0109126 - DOI - PMC - PubMed
- Allan G. J., Max T. L. (2010). Molecular genetic techniques and markers for ecological research. Nat. Educ. Knowl. 3, 2.
- Anonymous (1962). Historical notes on tea introduction in Africa, in Tea Estates in Africa, ed Wilson S. (London: Mabey & Fitzclarence; ), 6–9.
LinkOut - more resources
Full Text Sources
Other Literature Sources
Miscellaneous


