Multimodal population brain imaging in the UK Biobank prospective epidemiological study - PubMed (original) (raw)
. 2016 Nov;19(11):1523-1536.
doi: 10.1038/nn.4393. Epub 2016 Sep 19.
Fidel Alfaro-Almagro 1, Neal K Bangerter 2, David L Thomas 3, Essa Yacoub 4, Junqian Xu 5, Andreas J Bartsch 6, Saad Jbabdi 1, Stamatios N Sotiropoulos 1, Jesper L R Andersson 1, Ludovica Griffanti 1, Gwenaëlle Douaud 1, Thomas W Okell 1, Peter Weale 7, Iulius Dragonu 7, Steve Garratt 8, Sarah Hudson 8, Rory Collins 8 9, Mark Jenkinson 1, Paul M Matthews 10, Stephen M Smith 1
Affiliations
- PMID: 27643430
- PMCID: PMC5086094
- DOI: 10.1038/nn.4393
Multimodal population brain imaging in the UK Biobank prospective epidemiological study
Karla L Miller et al. Nat Neurosci. 2016 Nov.
Abstract
Medical imaging has enormous potential for early disease prediction, but is impeded by the difficulty and expense of acquiring data sets before symptom onset. UK Biobank aims to address this problem directly by acquiring high-quality, consistently acquired imaging data from 100,000 predominantly healthy participants, with health outcomes being tracked over the coming decades. The brain imaging includes structural, diffusion and functional modalities. Along with body and cardiac imaging, genetics, lifestyle measures, biological phenotyping and health records, this imaging is expected to enable discovery of imaging markers of a broad range of diseases at their earliest stages, as well as provide unique insight into disease mechanisms. We describe UK Biobank brain imaging and present results derived from the first 5,000 participants' data release. Although this covers just 5% of the ultimate cohort, it has already yielded a rich range of associations between brain imaging and other measures collected by UK Biobank.
Conflict of interest statement
PW and ID are employees of Siemens Healthcare UK, the vendor of MRI scanners for UK Biobank selected under a competitive bidding process. Other authors declare no competing financial interests.
Figures
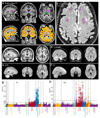
Figure 1. Data from the three structural imaging modalities in UK Biobank brain imaging.
(a) Single-subject T1-weighted structural image with minimal pre-processing: removal of intensity inhomogeneity, lower neck areas cropped and the face blanked to protect anonymity. Color overlays show automated modeling of several subcortical structures (above) and segmentation of gray matter (below). (b) Single-subject T2-weighted FLAIR image with the same minimal pre-processing, showing hyperintense lesions in the white matter indicated (arrows). (c) Group-average (n≈4500) T1 atlas; all subjects’ data were aligned together (see Online Methods for processing details) and averaged, achieving higher quality alignment, with clear delineation of deep grey structures and good agreement of major sulcal folding patterns despite wide variation in these features across subjects. (d) Group-average T2 FLAIR atlas. (e) Group-average atlas derived from SWI processing of swMRI phase and magnitude images. (f) Group-average T2* atlas, also derived from the swMRI data. (g) “Manhattan” plot (a layout common in genetic studies) relating all 25 IDPs from the T1 data to 1100 non-brain-imaging variables extracted from the UK Biobank database, with the latter arranged into major variable groups along the x axis (with these groups separated by vertical dotted lines). For each of these 1100 variables, the significance of the cross-subject univariate correlation with each of the IDPs is plotted vertically, in units of –log10(Puncorrected). The dotted horizontal lines indicate thresholds corresponding to multiple comparison correction using false discovery rate (FDR, lower line, corresponding to puncorrected=3.8×10⁻⁵) and Bonferroni correction (upper line, puncorrected=1.8×10⁻⁸) across the 2.8 million tests involving correlations of all modalities’ IDPs against all 1100 non-imaging measures. Effects such as age, sex and head size are regressed out of all data before computing the correlations. As an indication of the corresponding range of effect sizes, the maximum r2 (fractional variance of either variable explained by the other) is calculated, as well as the minimum r2 across all tests passing the Bonferroni correction. Here the maximum r2 = 0.045 and the minimum r2 = 0.0058. See Online Methods for more details of these analyses. (h) Plot relating all 14 T2* IDPs to 1100 non-imaging variables. Maximum r2 = 0.034, minimum r2 = 0.0063. Marked Bonferroni and FDR multiple comparison threshold levels are the same as in (g).
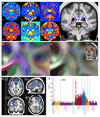
Figure 2. The diffusion MRI data in UK Biobank.
(a) Group-average (n≈4500) atlases from six distinct dMRI modeling outputs, each sensitive to different aspects of the white matter microarchitecture. See Online Methods for processing details. The atlases shown are: FA (fractional anisotropy), MD (mean diffusivity) and MO (tensor mode); ICVF (intra-cellular volume fraction), ISOVF (isotropic or free water volume fraction) and OD (orientation dispersion index), from the NODDI microstructural modeling. Also shown are several group-average white matter masks used to generate IDPs (e.g., pink (r) are retrolenticular tracts in the internal capsules; upper-green (s) are the superior longitudinal fasciculi). (b) Tensor ellipsoids depicting the group-averaged tensor fit at each voxel for the region shown inset in (c). The shapes of the ellipsoids indicate the strength of water diffusion along three principal directions; long thin tensors indicate single dominant fiber bundles, whereas more spherical tensors (within white matter) generally imply regions of crossing fibers (seen more explicitly modeled in corresponding parts of (c)). (c) Group-averaged multiple fiber orientation atlases, showing up to 3 fiber bundles per voxel. Red shows the strongest fiber direction, green the second, and blue the third. Each fiber bundle is only shown where the modeling estimates that population to have greater than 5% voxel occupancy. Inset shows the thresholded mean FA image (copper) overlaid on the T1, with the region shown in detail in (b) and c) highlighted. (d) Four example group-average white matter tract atlases estimated by probabilistic tractography fed from the within-voxel fiber modeling: corpus callosum (genu), superior longitudinal fasciculus, corticospinal tract and inferior fronto-occipital fasciculus. (e) Plot relating all 675 dMRI IDPs (nine distinct dMRI modeling outputs from tensor and NODDI models × 75 tract masks) to 1100 non-imaging variables (see Fig 1g for details). Maximum r2 = 0.057, minimum r2 (passing Bonferroni) = 0.0065. Dotted horizontal lines (multiple comparison thresholds) are the same as in Fig 1g.
Figure 3. The task fMRI data in UK Biobank.
(a) The task paradigm temporal model (time running vertically) depicting the periods of the two task types (shapes and faces); for more information on this paradigm view, see
http://fsl.fmrib.ox.ac.uk/fsl/fslwiki/FEAT/UserGuide
. (b) Example fitted activation regression model vs. timeseries data (time running horizontally), for the voxel most strongly responding to the “faces > shapes” contrast in a single subject (Z=12.3). (c) Percentage of subjects passing simple voxel-wise activation thresholding (Z>1.96) for the same contrast. Note reliable focal activation in left and right amygdala. The underlying image is the group-averaged raw fMRI image. (d) Group-averaged activation for the 3 contrasts of most interest, overlaid on the group-average T1 atlas (fixed-effects group average, Z>100, voxelwise Pcorrected<10-30). (e) Plot relating the 16 tfMRI IDPs to 1100 non-imaging variables (see Fig 1g for details). Maximum r2 = 0.018, minimum r2 (passing Bonferroni) = 0.0062. Dotted horizontal lines (multiple comparison thresholds) are the same as in Fig 1g.
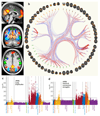
Figure 4. The resting-state fMRI data in UK Biobank.
(a) Example group-average resting-state network (RSN) atlases from the low-dimensional group-average decomposition, showing four out of 21 estimated functional brain networks, including the default mode network (red-yellow), dorsal attention network (green), primary visual (copper), and higher level visual (dorsal and ventral streams, blue). The three slices shown are (top to bottom) sagittal, coronal and axial. (b) The 55 non-artefact components from a higher-dimensional parcelation of the brain (axial views). These are shown as displayed by the connectome browser (
www.fmrib.ox.ac.uk/analysis/techrep/ukb/netjs\_d100
), which allows interactive investigation of individual connections in the group-averaged functional network modeling. The 55 brain regions (network nodes) are clustered into groups according to their average population connectivity, and the strongest individual connections are shown (positive in red, anticorrelations in blue). (c) Plot relating the 76 rfMRI “node amplitude” IDPs to 1100 non-imaging variables (see Fig 1g for details). Maximum r2 = 0.065, minimum r2 (passing Bonferroni) = 0.0059. (d) Plot relating the 1695 rfMRI “functional connectivity” IDPs to 1100 non-imaging variables. Maximum r2 = 0.032, minimum r2 = 0.0059. Dotted horizontal lines (multiple comparison thresholds) in (c) and (d) are the same as in Fig 1g.
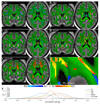
Figure 5. Voxel-wise correlations of participants’ age against several white matter measures from the dMRI and T2 FLAIR data.
(a) Voxel-wise (cross-subject) correlation of FA (fractional anisotropy) vs. age. Group-average FA in white matter is shown in green, overlaid onto the group-average T1. (b) Correlation of MO (tensor mode) vs. age, using the same color scheme. Nearby areas of MO increase are shown in greater detail in (f), which also shows the distinct primary fiber directions. (c) Correlation of OD (orientation dispersion) vs. age, including a reduction in dispersion in posterior corpus callosum. (d) Correlation of ISOVF (isotropic or free water volume fraction) vs. age, showing increases in “free water” with age in a broad range of tracts. (e) Voxel-wise correlation of T2 FLAIR intensity, showing increased intensity with aging in white matter. For (a-e), blue and red-yellow show negative and positive Pearson correlation with age, respectively (Pcorrected<0.05, with Bonferroni correction across voxels resulting in significance at _r_=0.1 (dMRI n=3722; T2 FLAIR n=3781). (g) Histograms (across voxels) of the voxel-wise age correlation of the correlation maps shown above, with correlation value on the x axis. FA and MO largely decrease with age, while OD and ISOVF largely increase.
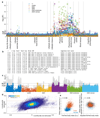
Figure 6. Visualisation of 2.8 million univariate cross-subject association tests between 2501 IDPs and 1100 other variables in the UK Biobank database.
(a) Manhattan plot showing, for each of the 1100 non-brain-imaging variables, the statistically strongest association of that variable with each distinct imaging sub-modality’s IDPs. (i.e., 6 results plotted for each x axis position, each with a color indicating a brain imaging modality; this plot differs from the other Manhattan plots, which show correlations with all IDPs). Whereas the Manhattan plots in Figs 1-4 indicated associations for each brain imaging modality separately, here we depict all associations in a single plot. (b) List of all IDP-cognitive score associations passing Bonferroni correction for multiple comparisons (Pcorrected<0.05; Puncorrected<1.8x10⁻⁸). The first column lists the age-adjusted correlation coefficient, and the second shows the unadjusted correlation, both being correlations between a specific brain IDP (fifth column) and a cognitive test score (seventh column). UK Biobank cognitive tests carried out include Fluid Intelligence, Prospective Memory, Reaction Time (Shape Pairs Matching), Memorised Pairs Matching, Trail Making (Symbol Ordering), Symbol Digit Substitution, and Numeric Memory. (c) IDP associations with the cognitive phenotype variables (the full set of 174 cognitive variables, repeated for each brain imaging modality). Shown behind, in gray, are the same associations without adjustment for age, with a large number of stronger associations. Dotted horizontal lines (multiple comparison thresholds) in (a) and (c) are the same as in Fig 1g. (d) Scatterplot showing the relationship between adjusted correlations and those obtained without first regressing out the confound variables (each point is a pairing of one IDP with one non-brain-imaging variable, 2.8 million points). The grid lines indicate Bonferroni-corrected significance level (as described in Fig 1). (e) Example association between unadjusted white matter volume and fat-free body mass is high (r=0.56) when pooling across the sexes. After adjusting for several variables (including sex), the correlation falls almost to zero.
Figure 7. Details of three modes from the doubly-multivariate CCA-ICA analyses across all IDPs and non-brain-imaging variables.
IDPs are listed in orange and non-brain-imaging variables in black. The text lists show the variables most strongly associated with each mode; where multiple very similar (and highly correlated) non-imaging variables are found, only the most significant is listed here for brevity. The first column shows the weight (strength and sign) of a given variable in the ICA mode, the second shows the (cross-subject) percentage variance of the data explained by this mode, and the third column shows the percentage variance explained in the data without the confounds first regressed out. Mode 7 links measures of bone density, brain structure/tissue volumes and cognitive tests. Mode 8 links measures of blood pressure and alcohol intake to IDPs from the diffusion and functional connectivity data; two functional network connections strongly involved are displayed, with the population mean connection indicated by the bar connecting the two nodes forming the connection (red indicates positive mean correlation, blue negative, and the width of the bar indicates the connection strength). The group-ICA maps are thresholded at Z>5, and the colored text is the ICA weight shown in the table list. Mode 9 includes a wide range of imaging and non-imaging variables (see main text for details); as well as showing 3 strong functional network connections, we also show two functional nodes whose resting fluctuation amplitude is associated with this mode.
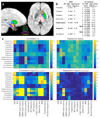
Figure 8. Hypothesis-driven study of age, BMI and smoking associations with subcortical T2*.
(a) UK Biobank population-average map of T2*, overlaid with the main subcortical structures being investigated. The T2* IDPs reflect individuals’ median T2* values within these regions. The relatively low T2* in putamen and pallidum likely reflects greater iron content. (b) BMI regression betas from multiple regressions of R2* (from the ASPS study) and T2* (from UK Biobank) against relevant covariates (see (c)). All variables are standardized so that beta values can be interpreted as (partial) correlation coefficients. R2* significance is reported as FDR-corrected P. T2* significance is reported as –log10Puncorrected with the more conservative Bonferroni correction (for Pcorrected=0.05) resulting in a threshold here of 3.6. (c) Full set of univariate and multiple regression betas and significance values for all brain regions tested and all model covariates. The regression results are much sparser, reflecting the higher associational specificity obtained by reporting unique variance explained.
Similar articles
- Multimodality neuroimaging brain-age in UK biobank: relationship to biomedical, lifestyle, and cognitive factors.
Cole JH. Cole JH. Neurobiol Aging. 2020 Aug;92:34-42. doi: 10.1016/j.neurobiolaging.2020.03.014. Epub 2020 Apr 8. Neurobiol Aging. 2020. PMID: 32380363 Free PMC article. - Cohort profile: design and methods in the eye and vision consortium of UK Biobank.
Chua SYL, Thomas D, Allen N, Lotery A, Desai P, Patel P, Muthy Z, Sudlow C, Peto T, Khaw PT, Foster PJ; UK Biobank Eye & Vision Consortium. Chua SYL, et al. BMJ Open. 2019 Feb 21;9(2):e025077. doi: 10.1136/bmjopen-2018-025077. BMJ Open. 2019. PMID: 30796124 Free PMC article. - Cohort profile: rationale and methods of UK Biobank repeat imaging study eye measures to study dementia.
Foster PJ, Atan D, Khawaja A, Lotery A, MacGillivray T, Owen CG, Patel PJ, Petzold A, Rudnicka A, Sun Z, Sheard S, Allen N; UK Biobank and UK Biobank Eye and Vision Consortium. Foster PJ, et al. BMJ Open. 2023 Jun 23;13(6):e069258. doi: 10.1136/bmjopen-2022-069258. BMJ Open. 2023. PMID: 37355273 Free PMC article. - [A review on the application of UK Biobank in neuroimaging].
Lin L, Xiong M, Wu S. Lin L, et al. Sheng Wu Yi Xue Gong Cheng Xue Za Zhi. 2021 Jun 25;38(3):594-601. doi: 10.7507/1001-5515.202012059. Sheng Wu Yi Xue Gong Cheng Xue Za Zhi. 2021. PMID: 34180206 Free PMC article. Review. Chinese. - United Kingdom Biobank (UK Biobank): JACC Focus Seminar 6/8.
Caleyachetty R, Littlejohns T, Lacey B, Bešević J, Conroy M, Collins R, Allen N. Caleyachetty R, et al. J Am Coll Cardiol. 2021 Jul 6;78(1):56-65. doi: 10.1016/j.jacc.2021.03.342. J Am Coll Cardiol. 2021. PMID: 34210415 Review.
Cited by
- Fast qualitY conTrol meThod foR derIved diffUsion Metrics (YTTRIUM) in big data analysis: U.K. Biobank 18,608 example.
Maximov II, van der Meer D, de Lange AG, Kaufmann T, Shadrin A, Frei O, Wolfers T, Westlye LT. Maximov II, et al. Hum Brain Mapp. 2021 Jul;42(10):3141-3155. doi: 10.1002/hbm.25424. Epub 2021 Mar 31. Hum Brain Mapp. 2021. PMID: 33788350 Free PMC article. - The use of resting state data in an integrative approach to studying neurocognitive ageing - Commentary on Campbell and Schacter (2016).
Geerligs L, Tsvetanov KA. Geerligs L, et al. Lang Cogn Neurosci. 2017;32(6):684-691. doi: 10.1080/23273798.2016.1251600. Epub 2016 Nov 4. Lang Cogn Neurosci. 2017. PMID: 36381062 Free PMC article. - The Amsterdam Open MRI Collection, a set of multimodal MRI datasets for individual difference analyses.
Snoek L, van der Miesen MM, Beemsterboer T, van der Leij A, Eigenhuis A, Steven Scholte H. Snoek L, et al. Sci Data. 2021 Mar 19;8(1):85. doi: 10.1038/s41597-021-00870-6. Sci Data. 2021. PMID: 33741990 Free PMC article. - Diabetes, Prediabetes, and Brain Aging: The Role of Healthy Lifestyle.
Dove A, Wang J, Huang H, Dunk MM, Sakakibara S, Guitart-Masip M, Papenberg G, Xu W. Dove A, et al. Diabetes Care. 2024 Oct 1;47(10):1794-1802. doi: 10.2337/dc24-0860. Diabetes Care. 2024. PMID: 39193914 Free PMC article. - Deep Learning-based Brain Age Prediction in Patients With Schizophrenia Spectrum Disorders.
Kim WS, Heo DW, Maeng J, Shen J, Tsogt U, Odkhuu S, Zhang X, Cheraghi S, Kim SW, Ham BJ, Rami FZ, Sui J, Kang CY, Suk HI, Chung YC. Kim WS, et al. Schizophr Bull. 2024 Jul 27;50(4):804-814. doi: 10.1093/schbul/sbad167. Schizophr Bull. 2024. PMID: 38085061 Free PMC article.
References
- Allen N, et al. UK Biobank: Current status and what it means for epidemiology. Health Policy and Technology. 2012;1:123–126.
- Wick J. Understanding frailty in the geriatric population. Consult Pharm. 2011;26:634–645. - PubMed
Publication types
MeSH terms
Grants and funding
- 202788/Z/16/Z/WT_/Wellcome Trust/United Kingdom
- MC_PC_12027/MRC_/Medical Research Council/United Kingdom
- MR/K006673/1/MRC_/Medical Research Council/United Kingdom
- WT_/Wellcome Trust/United Kingdom
- MC_PC_15067/MRC_/Medical Research Council/United Kingdom
- MR/M024903/1/MRC_/Medical Research Council/United Kingdom
- MR/L009013/1/MRC_/Medical Research Council/United Kingdom
LinkOut - more resources
Full Text Sources
Other Literature Sources
