Different activation signals induce distinct mast cell degranulation strategies - PubMed (original) (raw)
. 2016 Oct 3;126(10):3981-3998.
doi: 10.1172/JCI85538. Epub 2016 Sep 19.
Riccardo Sibilano, Thomas Marichal, Philipp Starkl, Laurent L Reber, Nicolas Cenac, Benjamin D McNeil, Xinzhong Dong, Joseph D Hernandez, Ronit Sagi-Eisenberg, Ilan Hammel, Axel Roers, Salvatore Valitutti, Mindy Tsai, Eric Espinosa, Stephen J Galli
- PMID: 27643442
- PMCID: PMC5096814
- DOI: 10.1172/JCI85538
Different activation signals induce distinct mast cell degranulation strategies
Nicolas Gaudenzio et al. J Clin Invest. 2016.
Abstract
Mast cells (MCs) influence intercellular communication during inflammation by secreting cytoplasmic granules that contain diverse mediators. Here, we have demonstrated that MCs decode different activation stimuli into spatially and temporally distinct patterns of granule secretion. Certain signals, including substance P, the complement anaphylatoxins C3a and C5a, and endothelin 1, induced human MCs rapidly to secrete small and relatively spherical granule structures, a pattern consistent with the secretion of individual granules. Conversely, activating MCs with anti-IgE increased the time partition between signaling and secretion, which was associated with a period of sustained elevation of intracellular calcium and formation of larger and more heterogeneously shaped granule structures that underwent prolonged exteriorization. Pharmacological inhibition of IKK-β during IgE-dependent stimulation strongly reduced the time partition between signaling and secretion, inhibited SNAP23/STX4 complex formation, and switched the degranulation pattern into one that resembled degranulation induced by substance P. IgE-dependent and substance P-dependent activation in vivo also induced different patterns of mouse MC degranulation that were associated with distinct local and systemic pathophysiological responses. These findings show that cytoplasmic granule secretion from MCs that occurs in response to different activating stimuli can exhibit distinct dynamics and features that are associated with distinct patterns of MC-dependent inflammation.
Figures
Figure 1. Human MC activation by SP or anti-IgE induces different patterns of secretion of lipid mediators, cytokines, and chemokines.
IgE-sensitized or nonsensitized PBCMCs were incubated in the presence of anti-IgE (blue) or SP (pink), respectively, or with medium alone (no stimulation, black). (A) Percentage of β-hexosaminidase release 60 minutes after stimulation with different concentrations of stimulatory molecules. (B and C) Production of prostaglandin E2 (PGE2) (B) or PGD2 (C) 60 minutes after addition of 0.1, 1, or 10 μM SP or 0.02, 0.2, or 2 μg/ml of anti-IgE or medium alone. (D and E) Production of TNF-α, IL-13, GM-CSF, VEGF, and MCP-1 30 minutes (left panel), 90 minutes (middle panel), or 12 hours (right panel) after addition of 10 μM SP or 2 μg/ml of anti-IgE or medium alone (D) or 1 μM SP or 0.2 μg/ml of anti-IgE or medium alone (E). Mean ± SEM; 2-tailed, unpaired t test (vehicle vs. SP or vehicle vs. DNP); *P < 0.05; **P < 0.01; ***P < 0.001; nd, not detected. Data are pooled from 5 independent experiments performed with PBCMCs from 4 different donors, all of which gave similar results.
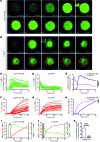
Figure 2. Human MC activation by SP or anti-IgE induces distinct [Ca2+]i signaling and degranulation dynamics.
IgE-sensitized or nonsensitized PBCMCs were loaded with Fluo-4 and stimulated with anti-IgE antibodies or SP in the presence of Av.SRho. Fluo-4 (green, [Ca2+]i) and Av.SRho (red, identifying exteriorized granule structures) fluorescence was measured, at the single-cell level, using time-lapse confocal microscopy in a controlled atmosphere (37°C and 5% CO2). (A) Representative time-lapse of a single IgE-sensitized PBCMC activated with anti-IgE. (B) Representative time-lapse of a single PBCMC activated with SP. (A and B) Scale bars: 5 μm; white insets show a budding granule structure at higher magnification; arrows indicate first budding granule structures; time scale reflects the kinetics of the responses induced by the 2 stimuli. (C and D) Single-cell analyses of Fluo-4 mean fluorescence intensity (MFI) following anti-IgE (C) or SP (D) stimulation. (E) Mean curves of Fluo-4 MFI following anti-IgE (blue) or SP (pink) stimulation. (F and G) Single-cell analyses of Av.SRho MFI following anti-IgE (F) or SP (G) stimulation. (H) Mean curves of Av.SRho MFI following anti-IgE (blue) or SP (pink) stimulation. Mean; 2-way ANOVA; ****P < 0.0001. Data are from the 3 independent experiments performed, each of which gave similar results. (I and J) Mean curves of Fluo-4 and Av.SRho MFI following anti-IgE (I) or SP (J) stimulation; dotted lines and arrows indicate the lag time (ΔT) measured between the increase in [Ca2+]i and the detection of the first budding granule structures. (K) Mean ΔT measured following anti-IgE (blue) or SP (pink) stimulation. Mean ± SEM; 2-tailed, unpaired t test; ****P < 0.0001. Data are from 3 independent experiments performed with PBCMCs from 3 donors (at least 30 single PBCMCs analyzed per condition), each of which gave similar results.
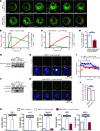
Figure 3. Signaling events and fluorescence dequenching patterns in dextran-FITC–labeled cytoplasmic granules in MCs stimulated via FcεRI or MRGPRX2.
(A–F) IgE-sensitized or nonsensitized dextran-FITC–loaded PBCMCs were stimulated with 2 μg/ml of anti-IgE (blue) or 10 μM SP (pink), respectively, or with medium alone (black), in the presence of Av.SRho. (A) Representative time-lapse sequence of Av.SRho (upper panels, red) and dextran-FITC (lower panels, pseudocolor) in a PBCMC incubated with medium alone. (B) Mean curve of pooled single-cell analyses of dextran-FITC MFI in PBCMCs incubated with medium. (C–F) Same experiment as in A and B in PBCMCs stimulated with anti-IgE (white arrowheads indicate increases in dextran-FITC fluorescence) or SP. Scale bars: 5 μm. (G) Average of dextran-FITC MFI between t = 0 and t = 5 minutes. (H–J) IgE-sensitized or nonsensitized PBCMCs were stimulated for 5 or 15 minutes with 2 μg/ml of anti-IgE or 10 μM SP or with medium alone. (H) Expression of phospho–IKK-α/β, phospho-PKC, and phospho-AKT in PBCMC lysates. Actin was used as loading control. (I) Immunoprecipitation of SNAP23/STX4 complexes in resting PBCMCs or activated with 2 μg/ml of anti-IgE or 10 μM SP. Immunoprecipitated SNAP23 was resolved and probed for STX4. (J) Immunoprecipitation of MUNC-18/STX3 complexes performed for the same times and conditions tested in I. Immunoprecipitated MUNC-18-2 was resolved and probed for STX3. Mean ± SEM; 2-tailed, unpaired t test; ****P < 0.0001. Data in A–G are from 4 independent experiments with PBCMCs from 2 donors (~35 single PBCMCs analyzed per condition); data in H and I are representative of those obtained in 6 independent experiments, each of them performed with PBCMCs from a different single donor, all of which gave similar results.
Figure 4. Pharmacological inhibition of IKK-β activity changes the signaling and degranulation pattern of anti-IgE–activated MCs.
(A–D) IgE-sensitized PBCMCs were pretreated for 60 minutes with 100 μM BMS-345541 or DMSO and treated as described in Figure 2. (A) Upper panel: a PBCMC pretreated with DMSO; lower panel: a PBCMC pretreated with BMS-345541. White insets: higher magnification; arrows: granule structures; time scale reflects the kinetics of the responses. (B and C) Mean curves of Fluo-4 and Av.SRho MFI in PBCMCs pretreated with DMSO (B) or BMS-345541 (C). Dotted lines and arrows, ΔT. (D) Mean ΔT in PBCMCs pretreated with DMSO (blue) or BMS-345541 (red). (E and F) PBCMCs pretreated with BMS-345541 or DMSO were stimulated for 5 or 15 minutes with anti-IgE. (E) Expression of phospho–IKK-α/β in PBCMC lysate. Actin was used as loading control. (F) Immunoprecipitation of SNAP23/STX4 complexes; immunoprecipitated SNAP23 was resolved and probed for STX4. (G–J) PBCMCs were pretreated with BMS-345541 or DMSO and treated as described in Figure 3C. Time-lapse of Av.SRho (red) and dextran-FITC (pseudocolor) in PBCMCs pretreated with DMSO (G) or BMS-345541 (H); white arrowheads, increases in dextran-FITC fluorescence. (I) Mean curve of dextran-FITC MFI in PBCMCs pretreated with DMSO (blue) or BMS-345541 (red). (J) Average of dextran-FITC MFI between t = 0 and t = 5 minutes. (K) Production of TNF-α, IL-13, GM-CSF, VEGF, and MCP-1 in PBCMCs stimulated 90 minutes with vehicle (black) or anti-IgE. ns, not significant. Mean ± SEM; 2-tailed, unpaired t test; **P < 0.01; ****P < 0.0001. Data in A–D and G–J are from 3 independent experiments performed with PBCMCs from 2 donors (~30 PBCMCs analyzed per condition); data in E, F, and K are from 3 independent experiments, each of them performed with PBCMCs from a different single donor, each of which gave similar results. Scale bars: 5 μm.
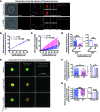
Figure 5. The features of exteriorized human MC granule structures can vary depending on the stimulus.
(A) Photographs of PBCMCs activated with anti-IgE (upper panels) or SP (lower panels). From left to right: Av.SRho (red) merged with differential interference contrast (DIC; gray); Av.SRho (red); isosurface modeling (red) of Av.SRho; modeled granule structures; modeled volume calculation. (B) Total accumulated volume of budding granule structures (i.e., total amount of externalized Av.SRho+ granule volume per MC) in cubic micrometers. (C) Total numbers of exocytosed Av.SRho+ granule structures. (D) Modeled volumes of budding granule structures (in cubic micrometers, assessing the size of granule structures still attached to the MC surface) per single MC during the first minute after the start of degranulation, following anti-IgE (blue) or SP (pink) stimulation. (E) 3D photographs of single PBCMCs embedded in a matrix gel, 30 minutes after exposure to medium (no stimulation, upper panels), anti-IgE (middle panels), or SP (lower panels). Panels, left to right: Av.SRho (red) merged with Fluo-4 (green); isosurface modeling of Av.SRho (red) and Fluo-4 (green); virtual isolation of released granule structures (structures are pseudocolored based on their volume). (F) Modeled volumes (in cubic micrometers, assessing granule structures not attached to the MC surface). (G) Modeled sphericity indices (from 0 to 1, 1 being a perfect sphere). Data shown in F and G were obtained 30 minutes after the beginning of mast cell stimulation. (B and C) Mean ± SEM; 2-way ANOVA. (D, F, and G) Left panel: each dot represents 1 individual granule structure analyzed; right panel: mean ± SEM of the data shown in the left panel. Data are from more than 200 granule structures analyzed per condition. Two-tailed, unpaired t test; *P < 0.05; ***P < 0.001; ****P < 0.0001. Data are from 3 independent experiments, each of them performed with PBCMCs from a different single donor, each of which gave similar results. Scale bars: 5 μm.
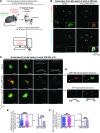
Figure 6. Differences in the features of granule structures exteriorized after FcεRI- or MRGPRB2-mediated activation of mouse MCs in vivo.
(A) Mcpt5-Cre+ R26Y+ (Mcpt5-EYFP) mice were sensitized or not by i.d. injection into the ear pinna of 20 ng of mouse anti–2,4-dinitrophenyl (anti-DNP) IgE. Sixteen hours later, 8 μg of Av.SRho was injected i.d. into the same ear pinna. Nonsensitized mice were injected i.p. with 1 mg of SP. IgE-sensitized mice were injected i.p. with 500 μg of DNP-HSA. In control experiments, sensitized mice were injected i.p. with vehicle. 3D high-resolution single-cell images were taken, and Av.SRho fluorescence signal was modeled. (B) 3D photographs of the ear pinna 30 minutes after injection of vehicle (left panels) or DNP-HSA (right panels). Upper panels: Av.SRho (red) and EYFP (green) merged; lower panels: Av.SRho shown in pseudocolor intensity. Scale bars: 20 μm. (C) 3D analyses of ear pinna MC granule structures, 30 minutes after injection of vehicle (upper panels), DNP-HSA (middle panels), or SP (lower panels). Panels, left to right: Av.SRho (red) and EYFP (green) merged; isosurface modeling of Av.SRho (red) and EYFP (green); virtual isolation of released granule structures. Scale bars: 10 μm. (D) 3D modeled granule structures stained with pseudocolor as a function of their volume or their sphericity index. (E) Modeled volumes of granule structures (in cubic micrometers) following anti-IgE (blue) or SP (pink) injection. (F) Modeled sphericity indices of granule structures, following anti-IgE (blue) or SP (pink) injection. Left panel: each dot represents 1 individual granule structure analyzed; right panel: mean ± SEM of the data represented in the left panel. Two-tailed, unpaired t test; ***P < 0.001; ****P < 0.0001. Data represent approximately 1,000 single-granule structures analyzed from 3 experiments performed with 3 mice per condition, each of which gave similar results.
Figure 7. MC-mediated cutaneous inflammation exhibits different features depending on the nature of the MC activation stimulus.
Mice were sensitized by i.d. injection of 20 ng anti-DNP IgE into the left ear pinna, and vehicle alone was injected i.d. into the right ear pinna. Sixteen hours later, the right ear pinna was injected i.d. with 1 nmol of SP (pink) and the left with 5 ng of DNP-HSA (blue). In control experiments, both ear pinnae were injected i.d. with vehicle (black). (A) Evans blue extravasation in the ears of C57BL/6 WT mice. Left panel: representative photographs; right panel: quantification of Evans blue extravasation (OD 650 nm). (B) Same experiment as in A, but performed in MC-deficient C57BL/6 KitW-sh/W-sh mice versus C57BL/6 WT mice. (C) Same experiment as in A, but performed in Mrgprb2MUT mice versus littermate WT mice. (D) Changes (Δ) in ear thickness over time after i.d. injection of WT mice. (E) Representative H&E photomicrographs of sections of ear pinnae in mice sacrificed 360 minutes after i.d. injection. Scale bars: 200 μm; insets show boxed areas at higher magnification (×40). (F) Flow cytometry analysis of cells (CD45+ cells, neutrophils and monocytes) recovered from ear pinnae 360 minutes after i.d. injection of C57BL/6 mice. (A–D and F) Mean ± SEM; 2-tailed, unpaired t test (vehicle vs. SP or vehicle vs. DNP) or paired t test (SP vs. DNP-HSA). Two-way ANOVA (SP vs. DNP-HSA, DNP-HSA vs. vehicle and SP vs. vehicle); *P < 0.05; **P < 0.01; ***P < 0.001; ****P < 0.0001. Data were pooled from 3 independent experiments, each of which gave similar results. n = total number of mice per condition.
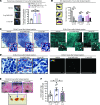
Figure 8. Greater enlargement of DLNs is induced by localized MC activation by IgE and antigen than by SP.
Mice were locally sensitized by injection of 20 ng anti-DNP IgE into the left footpad, and vehicle alone was injected into the right footpad. Sixteen hours later, the left footpad was injected with 5 ng DNP-HSA (blue) and the right footpad with 1 nmol SP (pink). In control experiments, both footpads were injected with vehicle (black). (A) Evans blue extravasation in the footpad of WT mice 2 hours after injection. Left panel: photographs; right panel: quantification of extravasation (OD 650 nm per gram of tissue). (B) Quantification of MC degranulation in the footpad 2 hours after injection; MC degranulation determined by classification in 3 categories: not degranulated (None, gray), moderately degranulated (Mod, darker gray), and extensively degranulated (Ext, black). (C) Micrograph of toluidine blue–stained sections (left panel) and Av.SRho (red) merged with DAPI (cyan) (right panel) of DLNs 2 hours after footpad injection. Red and white (left and right panel, respectively) insets show boxed areas at higher magnification (×60). Red (left) or white (right) arrowheads in insets depict nondegranulated MCs. (D) Visualization of MC granules in toluidine blue–stained sections (left panel) and Av.SRho-stained sections (pseudocolor enrichment, right panel) of DLNs 2 hours after footpad injection. Scale bars: 50 μm. (E) Photographs showing appearance of DLNs in situ (upper panel) and ex vivo (lower panel) 24 hours after footpad injection. (F) Weight of DLNs 24 hours after footpad injection. Mean ± SEM; 2-tailed, unpaired t test (vehicle vs. SP or vehicle vs. DNP) or paired t test (SP vs. DNP-HSA); *P < 0.05; **P < 0.01. Data were pooled from 3 independent experiments, each of which gave similar results. n = total number of mice per condition.
Figure 9. Model of distinct patterns of MC degranulation in response to SP, C3a, C5a, or ET1 versus anti-IgE or IgG immune complexes.
(A) Activation with SP, C3a, C5a, or ET1 induces rapid docking of discrete intracellular cytoplasmic granules with the plasma membrane, a process associated with the relatively transient elevation of levels of intracellular calcium ([Ca2+]i, indicated by a narrow green gradient) and resulting in the fast secretion of small spherical Av.SRho+ secretory granule structures that are likely to represent single granules. (B) Activation via FcεRI or FcγR results in a longer time partition between signaling and secretion, associated with a period of sustained elevation of [Ca2+]i levels (indicated by a wide green gradient). During this period, and before granule matrix material can be detected on the cell surface by binding of Av.SRho, some granules undergo deacidification, perhaps reflecting transient fusion of the granule membranes with the plasma membrane (not shown), favoring what may appear to represent, in static images, “intracellular” granule-granule fusion (*). The fusion of granules with each other and the plasma membrane that occurs during the process of compound exocytosis (**) results in the formation of heterogeneously shaped granule structures, likely representing aggregates of the matrices of multiple individual granules, that undergo exteriorization (as reflected by the binding of Av.SRho) over a more prolonged period than is seen with SP activation.
Comment in
- How mast cells make decisions.
Karhausen J, Abraham SN. Karhausen J, et al. J Clin Invest. 2016 Oct 3;126(10):3735-3738. doi: 10.1172/JCI90361. Epub 2016 Sep 19. J Clin Invest. 2016. PMID: 27643441 Free PMC article.
Similar articles
- Single-cell analysis of mast cell degranulation induced by airway smooth muscle-secreted chemokines.
Manning BM, Meyer AF, Gruba SM, Haynes CL. Manning BM, et al. Biochim Biophys Acta. 2015 Sep;1850(9):1862-8. doi: 10.1016/j.bbagen.2015.05.008. Epub 2015 May 15. Biochim Biophys Acta. 2015. PMID: 25986989 Free PMC article. - Dissociated human foreskin mast cells degranulate in response to anti-IgE and substance P.
Caulfield JP, el-Lati S, Thomas G, Church MK. Caulfield JP, et al. Lab Invest. 1990 Oct;63(4):502-10. Lab Invest. 1990. PMID: 1700194 - IκB kinase 2 is essential for IgE-induced mast cell de novo cytokine production but not for degranulation.
Peschke K, Weitzmann A, Heger K, Behrendt R, Schubert N, Scholten J, Voehringer D, Hartmann K, Dudeck A, Schmidt-Supprian M, Roers A. Peschke K, et al. Cell Rep. 2014 Sep 11;8(5):1300-7. doi: 10.1016/j.celrep.2014.07.046. Epub 2014 Aug 28. Cell Rep. 2014. PMID: 25176657 - Intracellular signaling pathways in IgE-dependent mast cell activation.
Kopeć A, Panaszek B, Fal AM. Kopeć A, et al. Arch Immunol Ther Exp (Warsz). 2006 Nov-Dec;54(6):393-401. doi: 10.1007/s00005-006-0049-4. Epub 2006 Nov 21. Arch Immunol Ther Exp (Warsz). 2006. PMID: 17122878 Review. - Vesicular trafficking and signaling for cytokine and chemokine secretion in mast cells.
Blank U, Madera-Salcedo IK, Danelli L, Claver J, Tiwari N, Sánchez-Miranda E, Vázquez-Victorio G, Ramírez-Valadez KA, Macias-Silva M, González-Espinosa C. Blank U, et al. Front Immunol. 2014 Sep 22;5:453. doi: 10.3389/fimmu.2014.00453. eCollection 2014. Front Immunol. 2014. PMID: 25295038 Free PMC article. Review.
Cited by
- Mast Cell Cytokines in Acute and Chronic Gingival Tissue Inflammation: Role of IL-33 and IL-37.
Trimarchi M, Lauritano D, Ronconi G, Caraffa A, Gallenga CE, Frydas I, Kritas SK, Calvisi V, Conti P. Trimarchi M, et al. Int J Mol Sci. 2022 Oct 31;23(21):13242. doi: 10.3390/ijms232113242. Int J Mol Sci. 2022. PMID: 36362030 Free PMC article. Review. - Potential Role of Moesin in Regulating Mast Cell Secretion.
Theoharides TC, Kempuraj D. Theoharides TC, et al. Int J Mol Sci. 2023 Jul 28;24(15):12081. doi: 10.3390/ijms241512081. Int J Mol Sci. 2023. PMID: 37569454 Free PMC article. Review. - Cobra Venom Factor Boosts Arteriogenesis in Mice.
Götz P, Azubuike-Osu SO, Braumandl A, Arnholdt C, Kübler M, Richter L, Lasch M, Bobrowski L, Preissner KT, Deindl E. Götz P, et al. Int J Mol Sci. 2022 Jul 30;23(15):8454. doi: 10.3390/ijms23158454. Int J Mol Sci. 2022. PMID: 35955584 Free PMC article. - Neutrophil-specific gain-of-function mutations in Nlrp3 promote development of cryopyrin-associated periodic syndrome.
Stackowicz J, Gaudenzio N, Serhan N, Conde E, Godon O, Marichal T, Starkl P, Balbino B, Roers A, Bruhns P, Jönsson F, Moguelet P, Georgin-Lavialle S, Broderick L, Hoffman HM, Galli SJ, Reber LL. Stackowicz J, et al. J Exp Med. 2021 Oct 4;218(10):e20201466. doi: 10.1084/jem.20201466. Epub 2021 Sep 3. J Exp Med. 2021. PMID: 34477811 Free PMC article. - Histamine-mediated autocrine signaling in mesenteric perilymphatic mast cells.
Pal S, Gasheva OY, Zawieja DC, Meininger CJ, Gashev AA. Pal S, et al. Am J Physiol Regul Integr Comp Physiol. 2020 Mar 1;318(3):R590-R604. doi: 10.1152/ajpregu.00255.2019. Epub 2020 Jan 8. Am J Physiol Regul Integr Comp Physiol. 2020. PMID: 31913658 Free PMC article.
References
MeSH terms
Substances
Grants and funding
- U19 AI104209/AI/NIAID NIH HHS/United States
- P30 NS069375/NS/NINDS NIH HHS/United States
- R01 AI023990/AI/NIAID NIH HHS/United States
- R01 CA072074/CA/NCI NIH HHS/United States
- UL1 RR025744/RR/NCRR NIH HHS/United States
- R37 AI023990/AI/NIAID NIH HHS/United States
- R01 AI070813/AI/NIAID NIH HHS/United States
- S10 RR026780/RR/NCRR NIH HHS/United States
LinkOut - more resources
Full Text Sources
Other Literature Sources
Molecular Biology Databases

