TGFβ1-Mediated SMAD3 Enhances PD-1 Expression on Antigen-Specific T Cells in Cancer - PubMed (original) (raw)
. 2016 Dec;6(12):1366-1381.
doi: 10.1158/2159-8290.CD-15-1347. Epub 2016 Sep 28.
Zachary T Freeman 1, Ali Ghasemzadeh 2, Michael A Chattergoon 1, Alleluiah Rutebemberwa 1, Jordana Steigner 1, Matthew E Winter 1, Thanh V Huynh 3, Suzanne M Sebald 3, Se-Jin Lee 3, Fan Pan 2, Drew M Pardoll 2, Andrea L Cox 4 2
Affiliations
- PMID: 27683557
- PMCID: PMC5295786
- DOI: 10.1158/2159-8290.CD-15-1347
TGFβ1-Mediated SMAD3 Enhances PD-1 Expression on Antigen-Specific T Cells in Cancer
Benjamin V Park et al. Cancer Discov. 2016 Dec.
Abstract
Programmed death-1 (PD-1) is a coinhibitory receptor that downregulates the activity of tumor-infiltrating lymphocytes (TIL) in cancer and of virus-specific T cells in chronic infection. The molecular mechanisms driving high PD-1 expression on TILs have not been fully investigated. We demonstrate that TGFβ1 enhances antigen-induced PD-1 expression through SMAD3-dependent, SMAD2-independent transcriptional activation in T cells in vitro and in TILs in vivo The PD-1hi subset seen in CD8+ TILs is absent in Smad3-deficient tumor-specific CD8+ TILs, resulting in enhanced cytokine production by TILs and in draining lymph nodes and antitumor activity. In addition to TGFβ1's previously known effects on T-cell function, our findings suggest that TGFβ1 mediates T-cell suppression via PD-1 upregulation in the tumor microenvironment (TME). They highlight bidirectional cross-talk between effector TILs and TGFβ-producing cells that upregulates multiple components of the PD-1 signaling pathway to inhibit antitumor immunity.
Significance: Engagement of the coinhibitory receptor PD-1 or its ligand, PD-L1, dramatically inhibits the antitumor function of TILs within the TME. Our findings represent a novel immunosuppressive function of TGFβ and demonstrate that TGFβ1 allows tumors to evade host immune responses in part through enhanced SMAD3-mediated PD-1 expression on TILs. Cancer Discov; 6(12); 1366-81. ©2016 AACRThis article is highlighted in the In This Issue feature, p. 1293.
©2016 American Association for Cancer Research.
Figures
Figure 1
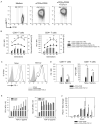
TGF-β1 enhances PD-1 expression on human T cells in a dose-dependent manner. Human CD3+ T cells were isolated from healthy donor PBMCs and were activated with αCD3/αCD28-conjugated beads with or without TGF-β1 (50 ng/ml). (a) Representative plots PD-1 (Y-axis) vs. CFSE (X-axis) are shown for different conditions. (b) PD-1 MFI is shown as filled circle lines (αCD3/αCD28) and open-circle lines (αCD3/αCD28 + TGF-β1). The percentage of cells in each CFSE generation (G0, G1, G2, G3 and G4) is shown as black bar graphs (αCD3/αCD28) and white bar graphs (αCD3/αCD28 + TGF-β1). The data represent combined results of two independent trials. (c) Naïve and memory subset of T cells (CD4+ and CD8+ T cells) were isolated based on CCR7 and CD45RA expression and treated with αCD3/αCD28 activation in the presence or absence of TGF-β1. The representative histogram of PD-1 is shown: shaded histogram (Isotype); thin histogram (αCD3/αCD28); and bold histogram (αCD3/αCD28+TGF-β1). (d) PD-1 MFI was assessed on each subset (X-axis) of CD8+ (left) and CD4+ (right) T cells; αCD3/αCD28 alone (black bars); αCD3/αCD28 with TGF-β1 (grey bars). The data represent combined results of two independent trials. (e) Isolated human CD3+ T cells were activated with αCD3/αCD28-conjugated beads in the presence of varying concentrations of TGF-β1 (5 to 5 × 10⁴ pg/ml). Mean fluorescent intensity (MFI) of PD-1 (left) and HLA-DR (right) expressions were assessed in CD4+ (grey bars) and CD8+ (black bars) T cells. The shown result is the representative of at least three independent trials. (f) Pdcd-1 transcript levels of human CD3+ T cells under different treatments were normalized to that of resting CD3+ T cells. The result is shown as mean +/− SEM of technical replicates and representative of at least three independent trials. The data were analyzed using Student’s t-test and considered significant if *P<0.05, **P<0.01, ***P<0.001.
Figure 2
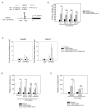
Anti-TGF-β1 neutralizing antibody and a TGF-βRI kinase inhibitor negate TGF-β1 mediated PD-1 enhancement (a, b) Enriched human CD3+ T cells were activated with αCD3/αCD28-conjugated beads and TGF-β1 under varying concentrations of TGF-β1 nAb (a) or SB431542 (b) and PD-1 MFI was assessed: medium alone (closed circles) αCD3/αCD28 only (open circles); αCD3/αCD28 + TGF-β1 (closed triangles). The result shown is representative of at least three independent trials. (c) Western-blot analysis of phosphorylated-Smad2 (p_Smad2_) in human CD3+ T cells treated with varying concentrations of TGF-βRI kinase inhibitor (SB431542). (d) Enriched human CD3+ T cells were activated with αCD3/αCD28-conjugated beads and TGF-β1 under increasing concentrations SB431542. Pdcd-1 transcript levels in each condition were normalized to that of resting human CD3+ T cells. The result is shown as mean +/− SEM of technical replicates and representative of at least three independent trials.
Figure 3
Smad3 directly binds to the Smad-binding elements (SBEs) and regulates PD-1 promoter activity (a) Schematic illustration of the proximal region of human Pdcd-1 promoter. Two Smad-binding-elements (SBEs) are located at 1.2 kb (SBE-D) and 1.0 kb (SBE-P) upstream of the Pdcd-1 transcription start site. NFATc1 consensus sequence is located in immediate proximity to SBE-P. Wild-type (WT) and mutated (Mut) sequences of both SBE-D and SBE-P are shown. (b) Jurkat T cells were transfected with luciferase reporter vectors containing wild-type (WT), mutant SBE-D, mutant SBE-P, and mutant SBE-D/P sequences of PD-1 promoter (1.9 kb). After co-transfection with TGF-βRI and RII expression plasmids, the cells were activated with plate-bound αCD3 and soluble αCD28 in the absence (grey bars) or presence (white bars) of TGF-β1 (50 ng/ml). Luciferase activity was measured as described in the method. (c) Isolated human CD3+ T cells were activated under different conditions: medium alone (white bars); αCD3/αCD28 alone (black bars); αCD3/αCD28 with TGF-β1 (hatched bars); αCD3/αCD28 + TGF-β1 with SB431542 (grey bars). Immunoprecipitated DNA was subjected for qPCR and fold enrichment of binding relative to IgG is shown as mean +/− SEM of triplicate results. (d) Jurkat T cells were co-transfected with 1.5 μM of siRNA against Smad2 or Smad3 and PD-1 promoter-driven luciferase activity was measured in relative luciferase units (ratio of firefly to renilla luciferase activity). (e) Transfected Jurkat T cells were treated with 10μM of specific inhibitor of Smad3 (SIS3) and PD-1 promoter-driven luciferase activity was measured after activation. The results are shown as mean +/− SEM of technical replicates and is representative of at least three independent trials. The data were analyzed using two-way analysis of variance (ANOVA) and considered significant if *p<0.05.
Figure 4
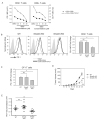
TGF-β1-dependent Smad3 enhances PD-1 expression on human and murine T cells (a) Human CD3+ T cells from healthy donors were isolated and pretreated with SIS3 at varying concentrations. Subsequently, the cells were activated with αCD3/αCD28-conjugated beads with or without TGF-β1. Mean fluorescence intensity (MFI) of PD-1 expression in different conditions was assessed: αCD3/αCD28 (closed circles); αCD3/αCD28 + TGF-β1 (open circles). The result shown is representative of at least three independent trials. (b) CD4+ T cells were isolated from wild-type (WT), Smad2 f/f; _Cd4_-cre (Smad2 cKO), Smad3 f/f; _Cd4_-cre (Smad3 cKO) mice and activated with plated-coated αCD3 and soluble αCD28 with or without TGF-β1 (50 ng/ml). PD-1 expression is shown as overlaid histograms with shaded histogram (isotype control), thin histogram (αCD3/αCD28), bold histogram (αCD3/αCD28+TGF-β1). PD-1 MFI is also shown as mean +/− SEM and represents combined results of two independent trials (bar graphs). (c) Isolated WT, Smad2 cKO, and Smad3 cKO OT-1 cells were activated with type-1 ovalbumin in the presence of irradiated splenocytes. PD-1 MFI is shown as mean +/− SEM and represents combined results of two independent trials (bar graphs). (d) Growth kinetics of B16 melanoma in WT (n=7), Smad2 cKO (n=10), and Smad3 cKO (n=11) mice are shown as the mean volume +/− SEM on different days. The data represent the combined results of two independent experiments. (e) Average CD8+ PD-1+ percentages in Smad2 cKO and Smad3 cKO TIL are shown as normalized values to WT CD8+ PD-1+ percentages. The data were analyzed using Student’s t-test and considered significant if *p<0.05, **p<0.01, ***p<0.001.
Figure 5
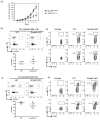
Adoptive transfer of Smad3 cKO CD8+ T cells results in reduced tumor burden and PD1hi subset relative to transfer of WT CD8+ T cells (a) Growth kinetics of B16-Ova in CD45.1 congenic mice that received no T cells (closed circles), WT OT-1 (open circles) or Smad3 cKO OT-1 (triangles). C57/BL6 expressing CD45.1 congenic markers were challenged with 1 × 10⁵ B16-Ova melanoma cell line on Day 0. On Day 10, 107 CD45.2 CD8+ OT-1 T cells from WT (n = 7) or Smad3 cKO (n = 5) mice were adoptively transferred into the mice with comparable tumor sizes. Tumor volume (mm3) is shown as mean +/− SEM on different days, and the data represent combined results of two independent experiments. The data were analyzed using one-way ANOVA and considered significant if *p<0.05, **p<0.01. (b, c) CFSE-labelled tumor infiltrating WT OT-1 (top) or cKO OT-1 (bottom) were isolated from B16-Ova 5 days after adoptive transfer, and tumor infiltrating lymphocytes (TIL) proliferation was assessed: Smad3 cKO (b) and Smad2 cKO OT-1 (c). CD45.2+ donor population was gated from a plot of CD8 (Y-axis) and CD45.2 (X-axis) (left), and a representative histogram of CFSE (right) is shown from pooled TIL from n = 6 mice per group. (d, e) Contour plots of PD-1 (top) and LAG3 (bottom) among the proliferated cells (i.e CFSE negative populations) are shown as isotype (left), WT (middle) and cKO (right): Smad3 cKO (d) and Smad2 cKO (e). The data are representative of two independent experiments.
Figure 6
Loss of Smad3 in CD8+ T cells leads to enhanced cytokine production. (a) Growth kinetics of MC-38 in WT (n=7), Smad2 cKO (n=6), or Smad3 cKO cells (n=6) are shown as the mean volume +/− SEM on different days. Data is representative example from 2 independent experiments. (b) Average CD8+ CD44+ PD-1 MFI in Smad2 cKO and Smad3 cKO TIL are shown as normalized values to WT CD8+ PD-1+ percentages. The data were analyzed using Student’s t-test and considered significant if *p<0.05. (c) Percentage of CD8 T cells producing IFNγ, TNFα, or IL-2 in the spleen, draining lymph node, and tumor. The data were analyzed using Student’s t-test and considered significant if *p<0.05.
Figure 7
Anti-PD-1 blocking antibody enhances anti-tumor immune responses in WT mice, but has minimal effect in _Smad3_-deficient mice. WT and Smad3 cKO were challenged with B16-melanoma cell line on Day 0. WT and Smad3 cKO mice were treated with either isotype-matched control IgG (circles) or anti-PD-1 antibody (squares) from the day of tumor implantation until Day 17. Tumor volume (mm3) on Day 17 is shown as mean +/− SEM on and the data represent combined results of two independent experiments. The data were analyzed using two-way analysis of variance (ANOVA) and considered significant if *p<0.05.
Similar articles
- Autocrine Complement Inhibits IL10-Dependent T-cell-Mediated Antitumor Immunity to Promote Tumor Progression.
Wang Y, Sun SN, Liu Q, Yu YY, Guo J, Wang K, Xing BC, Zheng QF, Campa MJ, Patz EF Jr, Li SY, He YW. Wang Y, et al. Cancer Discov. 2016 Sep;6(9):1022-35. doi: 10.1158/2159-8290.CD-15-1412. Epub 2016 Jun 13. Cancer Discov. 2016. PMID: 27297552 Free PMC article. - The Prognostic Significance of the Tumor-infiltrating Programmed Cell Death-1+ to CD8+ Lymphocyte Ratio in Patients with Colorectal Cancer.
Shibutani M, Maeda K, Nagahara H, Fukuoka T, Nakao S, Matsutani S, Hirakawa K, Ohira M. Shibutani M, et al. Anticancer Res. 2017 Aug;37(8):4165-4172. doi: 10.21873/anticanres.11804. Anticancer Res. 2017. PMID: 28739701 - PD-1 Expression in Head and Neck Squamous Cell Carcinomas Derives Primarily from Functionally Anergic CD4+ TILs in the Presence of PD-L1+ TAMs.
Mattox AK, Lee J, Westra WH, Pierce RH, Ghossein R, Faquin WC, Diefenbach TJ, Morris LG, Lin DT, Wirth LJ, Lefranc-Torres A, Ishida E, Chakravarty PD, Johnson L, Zeng YC, Chen H, Poznansky MC, Iyengar NM, Pai SI. Mattox AK, et al. Cancer Res. 2017 Nov 15;77(22):6365-6374. doi: 10.1158/0008-5472.CAN-16-3453. Epub 2017 Sep 25. Cancer Res. 2017. PMID: 28947422 Free PMC article. - Effector, Memory, and Dysfunctional CD8(+) T Cell Fates in the Antitumor Immune Response.
Reiser J, Banerjee A. Reiser J, et al. J Immunol Res. 2016;2016:8941260. doi: 10.1155/2016/8941260. Epub 2016 May 22. J Immunol Res. 2016. PMID: 27314056 Free PMC article. Review. - PD-1 and its ligands are important immune checkpoints in cancer.
Dong Y, Sun Q, Zhang X. Dong Y, et al. Oncotarget. 2017 Jan 10;8(2):2171-2186. doi: 10.18632/oncotarget.13895. Oncotarget. 2017. PMID: 27974689 Free PMC article. Review.
Cited by
- Clinical and immunological characteristics of high-risk double-hit multiple myeloma.
Shang Y, Chen G, Liu L, Pan R, Li X, Shen H, Tan Y, Ma L, Tong X, Wang W, Chen X, Xia Z, Liu X, Zhou F. Shang Y, et al. BMC Cancer. 2024 Nov 10;24(1):1373. doi: 10.1186/s12885-024-13124-6. BMC Cancer. 2024. PMID: 39523318 - Myofibroblasts persist through immune privilege mechanisms to mediate oral submucous fibrosis: Uncovering the pathogenesis.
Sharma M, Shetty SS, Soi S, Radhakrishnan R. Sharma M, et al. J Oral Biol Craniofac Res. 2024 Nov-Dec;14(6):773-781. doi: 10.1016/j.jobcr.2024.10.008. Epub 2024 Oct 20. J Oral Biol Craniofac Res. 2024. PMID: 39502133 Free PMC article. Review. - Hippo pathway in cancer cells induces NCAM1+αSMA+ fibroblasts to modulate tumor microenvironment.
Thinyakul C, Sakamoto Y, Shimoda M, Liu Y, Thongchot S, Reda O, Nita A, Sakamula R, Sampattavanich S, Maeda A, Chunthaboon P, Nduru D, Niimura M, Kanamori Y, Thuwajit P, Nakayama KI, Guan KL, Satou Y, Thuwajit C, Moroishi T. Thinyakul C, et al. Commun Biol. 2024 Oct 17;7(1):1343. doi: 10.1038/s42003-024-07041-4. Commun Biol. 2024. PMID: 39420139 Free PMC article. - Low-dose SAHA enhances CD8+ T cell-mediated antitumor immunity by boosting MHC I expression in non-small cell lung cancer.
Dong W, He B, Cao Y, Yang R, Zhang S, Kong Y, Lu D, Zheng X, Hou Y, Zhu M, Wang C, Yu S, Cui D, Wang H, Wang B. Dong W, et al. Cell Oncol (Dordr). 2024 Sep 16. doi: 10.1007/s13402-024-00989-9. Online ahead of print. Cell Oncol (Dordr). 2024. PMID: 39283477 - Targeted therapies in hepatocellular carcinoma: past, present, and future.
Gujarathi R, Franses JW, Pillai A, Liao CY. Gujarathi R, et al. Front Oncol. 2024 Aug 29;14:1432423. doi: 10.3389/fonc.2024.1432423. eCollection 2024. Front Oncol. 2024. PMID: 39267840 Free PMC article. Review.
References
- Agata Y, Kawasaki A, Nishimura H, Ishida Y, Tsubat T, Yagita H, et al. Expression of the PD-1 antigen on the surface of stimulated mouse T and B lymphocytes. International Immunology. 1996;8(5):765–72. - PubMed
- Barber DL, Wherry EJ, Masopust D, Zhu B, Allison JP, Sharpe AH, et al. Restoring function in exhausted CD8 T cells during chronic viral infection. Nature. 2006;439(7077):682–87. - PubMed
- Dong H, Strome SE, Salomao DR, Tamura H, Hirano F, Flies DB, et al. Tumor-associated B7-H1 promotes T-cell apoptosis: a potential mechanism of immune evasion. Nat Med. 2002;8(8):793–800. - PubMed
Publication types
MeSH terms
Substances
Grants and funding
- T32 GM007309/GM/NIGMS NIH HHS/United States
- P30 CA006973/CA/NCI NIH HHS/United States
- R01 AR060636/AR/NIAMS NIH HHS/United States
- R01 AI089830/AI/NIAID NIH HHS/United States
- R01 AI099300/AI/NIAID NIH HHS/United States
- T32 AI007247/AI/NIAID NIH HHS/United States
- T32 OD011089/OD/NIH HHS/United States
- U19 AI088791/AI/NIAID NIH HHS/United States
LinkOut - more resources
Full Text Sources
Other Literature Sources
Molecular Biology Databases
Research Materials
Miscellaneous


