Activation of STING-Dependent Innate Immune Signaling By S-Phase-Specific DNA Damage in Breast Cancer - PubMed (original) (raw)
. 2016 Oct 5;109(1):djw199.
doi: 10.1093/jnci/djw199. Print 2017 Jan.
Steven M Walker 1, Laura E Taggart 1, Nuala McCabe 1, Laura A Knight 1, Richard Wilkinson 1, Karen D McCloskey 1, Niamh E Buckley 1, Kienan I Savage 1, Manuel Salto-Tellez 1, Stephen McQuaid 1, Mary T Harte 1, Paul B Mullan 1, D Paul Harkin 1, Richard D Kennedy 1
Affiliations
- PMID: 27707838
- PMCID: PMC5441301
- DOI: 10.1093/jnci/djw199
Activation of STING-Dependent Innate Immune Signaling By S-Phase-Specific DNA Damage in Breast Cancer
Eileen E Parkes et al. J Natl Cancer Inst. 2016.
Abstract
Background: Previously we identified a DNA damage response-deficient (DDRD) molecular subtype within breast cancer. A 44-gene assay identifying this subtype was validated as predicting benefit from DNA-damaging chemotherapy. This subtype was defined by interferon signaling. In this study, we address the mechanism of this immune response and its possible clinical significance.
Methods: We used immunohistochemistry (IHC) to characterize immune infiltration in 184 breast cancer samples, of which 65 were within the DDRD subtype. Isogenic cell lines, which represent DDRD-positive and -negative, were used to study the effects of chemokine release on peripheral blood mononuclear cell (PBMC) migration and the mechanism of immune signaling activation. Finally, we studied the association between the DDRD subtype and expression of the immune-checkpoint protein PD-L1 as detected by IHC. All statistical tests were two-sided.
Results: We found that DDRD breast tumors were associated with CD4+ and CD8+ lymphocytic infiltration (Fisher's exact test P < .001) and that DDRD cells expressed the chemokines CXCL10 and CCL5 3.5- to 11.9-fold more than DNA damage response-proficient cells (P < .01). Conditioned medium from DDRD cells statistically significantly attracted PBMCs when compared with medium from DNA damage response-proficient cells (P < .05), and this was dependent on CXCL10 and CCL5. DDRD cells demonstrated increased cytosolic DNA and constitutive activation of the viral response cGAS/STING/TBK1/IRF3 pathway. Importantly, this pathway was activated in a cell cycle-specific manner. Finally, we demonstrated that S-phase DNA damage activated expression of PD-L1 in a STING-dependent manner.
Conclusions: We propose a novel mechanism of immune infiltration in DDRD tumors, independent of neoantigen production. Activation of this pathway and associated PD-L1 expression may explain the paradoxical lack of T-cell-mediated cytotoxicity observed in DDRD tumors. We provide a rationale for exploration of DDRD in the stratification of patients for immune checkpoint-based therapies.
© The Author 2016. Published by Oxford University Press. All rights reserved. For Permissions, please email: journals.permissions@oup.com.
Figures
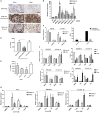
Figure 1.
Immune gene expression in FA/BRCA DNA repair pathway loss. A) Immunohistochemistry (IHC) images (x40) showing absence of CD8+ and CD4+ lymphocytes in DDRD assay–negative tumors, and both intratumoral and stromal CD8+ and CD4+ lymphocytes in DDRD assay–positive breast tumors. Scale bar represents 100 µm. B) Quantitative polymerase chain reaction (qPCR) measurement of CCL5 and CXCL10 chemokine mRNA expression following knockdown of BRCA1, BRCA2, and FANCD2 in HeLa cells using two independent siRNAs (a and b) compared with control siRNA (AS). GAPDH siRNA has also been used as a negative control. C) qPCR measurement (left panel) of CCL5 and CXCL10 chemokine mRNA expression in MDA-MB-436-EV and HCC1937-EV BRCA1-mutant cell lines compared with BRCA1-corrected MDA-MB-436 and HCC1937-BRCA1 cell lines. CXCL10 and CCL5 quantification by enzyme-linked immunosorbent assay (ELISA) of media collected from MDA-MB-436 BRCA1 and empty vector counterparts (EV) are shown in the right panel. D) Migration of activated peripheral blood mononuclear cells (PBMCs) toward conditioned media from MDA-MB-436-EV compared with MDA-MB-436-BRCA1 using a Boyden Invasion Chamber Assay. E) Migration of activated PBMCs toward conditioned media from MDA-MB-436-EV cells treated with CXCL10 and CCL5 siRNA compared with nontargeting siRNA control (AS) using a Boyden invasion chamber assay. See also Supplementary Figure 1, C and D (available online). F) qPCR measurement of CXCL10 and CCL5 mRNA in MDA-MB-436-EV and HCC1937-EV cells arrested in S-phase using double-thymidine block (2.5 mM) (top left panel) and M-phase using nocodazole (100 ng/mL) (bottom left panel). Cell cycle analysis following double-thymidine treatment as compared with phosphate-buffered saline (PBS) control is shown in the top right panel, and nocodazole-treated cells as compared with DMSO control in the bottom right panel. G) qPCR measurement of CXCL10 and CCL5 mRNA expression in HeLa (left panel), MDA-MB-436-EV (center panel), and HCC1937-EV (right panel) cells 24 hours following treatment with cisplatin, HU, or paclitaxel at IC50 concentration for each cell line, and the data was normalized to PUM1 expression. Data are represented as mean ± SD, and P values were calculated using the unpaired, two-tailed Student’s t test. *P < .05, †P < .01, ‡P < .001. DDRD = DNA damage response–deficient; PBMC = peripheral blood mononuclear cell; PBS = phosphate-buffered saline.
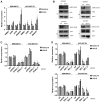
Figure 2.
The role of STING, TBK1, and IRF3 in DNA damage–dependent chemokine expression. A) quantitative polymerase chain (qPCR) measurement of CXCL10 and CCL5 mRNA extracted from MDA-MB-436-EV and HCC1937-EV cells treated with small molecule inhibitors to ATM (1 µm Ku60019), ATR (5 µm ETP46464), and DNA-PK (5 µm Nu7441) for 24 hours. B) Immunoblots of immunoprecipitate from whole cell lysate from MDA-MB-436-EV, MDA-MB-436- BRCA1, HCC1937-EV, and HCC1937-BRCA1 cells for phosphorylation of IRF3 (ser396) and TBK1 (ser172) are shown. IRF3, TBK1, and Actin from whole cell lysates are also shown. C) qPCR measurement of CXCL10 and CCL5 mRNA 72 hours following knockdown of STING using two independent siRNAs (a and b) in MDA-MB-436-EV and HCC1937-EV cells normalized to a nontargeting siRNA control (AS). D) qPCR measurement of CXCL10 and CCL5 mRNA 72 hours following knockdown of TBK1 or IRF3 using two independent siRNAs (a and b) in MDA-MB-436-EV (top panel) and HCC1937-EV cells (bottom panel) normalized to a nontargeting siRNA control (AS), and GAPDH siRNA was used as a negative control. All data are representative of mean ± SD, and P values were calculated using the unpaired, two-tailed Student’s t test. *P < .05, †P < .01, ‡P < .001.
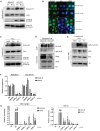
Figure 3.
Analysis of cytosolic DNA in DNA damage response deficiency. A) Immunoblot for Histone H3 in the cytosolic fraction of DNA damage repair–deficient cell lines (MDA-MB-436-EV and HCC1937-EV) compared with isogenic BRCA1–corrected cells (MDA-MB-436-BRCA1 and HCC1937-BRCA1). Actin is included as a loading control. Nuclear Lamin B1 shows degree of fractionation achieved. Densitometry has been performed on Histone H3 expression in Supplementary Figure 3B (available online). B) PicoGreen staining of MDA-MB-436 and HCC1937 BRCA1-complemented and empty vector counterparts. Scale bar represents 10 µm. C) Immunoblot for Histone H3 in the cytosolic of HeLa cells treated with IC50 dose cisplatin (1.46 µM) and hydroxyurea (326 µM) compared with a DMSO control. Actin and Lamin B1 are included as loading controls. Densitometry has been performed on Histone H3 expression in Supplementary Figure 3B (available online). D) Immunoblot for cGAS using Histone H3 immunoprecipitate from the cytoplasmic fraction of MDA-MB-436-EV and HCC1937-EV cells. Total cGAS, Histone H3 input, and Actin loading controls are shown. E) Immunoblot for cGAS using Histone H3 immunoprecipitate from the cytoplasmic fraction of HeLa cells treated with cisplatin and HU compared with DMSO control. Total cGAS, Histone H3 input, and Actin loading controls are shown. F) Quantitative polymerase chain reaction (qPCR) measurement of CXCL10 and CCL5 mRNA expression in MDA-MB-436-EV and HCC1937-EV cells using two independent siRNAs targeting cGAS (a and b), compared with nontargeting siRNA control (AS). G) qPCR measurement of CXCL10 and CCL5 mRNA 48 hours after IC50 dose cisplatin (1.46 µM) (left panel) and hydroxyurea (326 µM) (right panel treatment in HeLa cells). cGAS expression was knocked down 24 hours prior to drug treatment using two independent siRNAs targeting cGAS (a and b). A nontargeting siRNA control (AS) is included. All data are representative of mean ± SD, and P values were calculated using the unpaired, two-tailed Student’s t test. *P < .05, †P < .01, ‡P < .001.
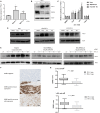
Figure 4.
PD-L1 expression in DNA damage response deficiency. A) Quantitative polymerase chain reaction (qPCR) measurement of PD-L1 expression in HeLa cells using two independent siRNAs targeting BRCA1 (a and b), compared with nontargeting siRNA control (AS). B) Immunoblot of PD-L1 and BRCA1 protein expression in HeLa cells following two independent siRNAs targeting BRCA1 (a and b). Actin is shown as a loading control. C) qPCR measurement of PD-L1 mRNA expression in HeLa, MDA-MB-436-EV, and HCC1937-EV cells 24 hours following treatment with cisplatin, HU, and paclitaxel at the IC50 dose appropriate for each cell line. All data are representative of mean ± SD, and P values were calculated using the unpaired, two-tailed Student’s t test. *P < .05, †P < .01, ‡P < .001. D) Immunoblot for PD-L1 protein expression in HeLa, MDA-MB-436-EV, and HCC1937-EV cells 24 hours following treatment with IC50 doses of cisplatin, HU, and paclitaxel. Actin is included as a loading control. E) Immunoblot for PD-L1 in HeLa cells after siRNA-mediated knockdown of STING using two independent siRNAs (a and b) from one to 12 hours following cisplatin treatment (10 µM). A nontargeting siRNA control (AS) is included. Actin is included as a loading control. F) Immunohistochemistry (IHC) images (x20) representing immunostaining for PD-L1 in no staining (upper panel), epithelial staining (middle panel), and immune staining (lower panel). Scale bar represents 100 µm. G) Boxplot graph showing relationship between DDRD assay score and PD-L1 expression as assessed by IHC at ≥ 1% (upper panel) and ≥5% (lower panel) cut-offs. DDRD = DNA damage response–deficient.
Similar articles
- Targeting DNA Damage Response Promotes Antitumor Immunity through STING-Mediated T-cell Activation in Small Cell Lung Cancer.
Sen T, Rodriguez BL, Chen L, Corte CMD, Morikawa N, Fujimoto J, Cristea S, Nguyen T, Diao L, Li L, Fan Y, Yang Y, Wang J, Glisson BS, Wistuba II, Sage J, Heymach JV, Gibbons DL, Byers LA. Sen T, et al. Cancer Discov. 2019 May;9(5):646-661. doi: 10.1158/2159-8290.CD-18-1020. Epub 2019 Feb 18. Cancer Discov. 2019. PMID: 30777870 Free PMC article. - Radiation Therapy Promotes Hepatocellular Carcinoma Immune Cloaking via PD-L1 Upregulation Induced by cGAS-STING Activation.
Du SS, Chen GW, Yang P, Chen YX, Hu Y, Zhao QQ, Zhang Y, Liu R, Zheng DX, Zhou J, Fan J, Zeng ZC. Du SS, et al. Int J Radiat Oncol Biol Phys. 2022 Apr 1;112(5):1243-1255. doi: 10.1016/j.ijrobp.2021.12.162. Epub 2022 Jan 2. Int J Radiat Oncol Biol Phys. 2022. PMID: 34986380 - Lung adenocarcinoma-intrinsic GBE1 signaling inhibits anti-tumor immunity.
Li L, Yang L, Cheng S, Fan Z, Shen Z, Xue W, Zheng Y, Li F, Wang D, Zhang K, Lian J, Wang D, Zhu Z, Zhao J, Zhang Y. Li L, et al. Mol Cancer. 2019 Jun 20;18(1):108. doi: 10.1186/s12943-019-1027-x. Mol Cancer. 2019. PMID: 31221150 Free PMC article. - STING dependent sensing - Does HIV actually care?
Krapp C, Jønsson K, Jakobsen MR. Krapp C, et al. Cytokine Growth Factor Rev. 2018 Apr;40:68-76. doi: 10.1016/j.cytogfr.2018.03.002. Epub 2018 Mar 9. Cytokine Growth Factor Rev. 2018. PMID: 29548644 Review. - Immune infiltrates in the breast cancer microenvironment: detection, characterization and clinical implication.
Burugu S, Asleh-Aburaya K, Nielsen TO. Burugu S, et al. Breast Cancer. 2017 Jan;24(1):3-15. doi: 10.1007/s12282-016-0698-z. Epub 2016 May 2. Breast Cancer. 2017. PMID: 27138387 Review.
Cited by
- Functional Interfaces, Biological Pathways, and Regulations of Interferon-Related DNA Damage Resistance Signature (IRDS) Genes.
Padariya M, Sznarkowska A, Kote S, Gómez-Herranz M, Mikac S, Pilch M, Alfaro J, Fahraeus R, Hupp T, Kalathiya U. Padariya M, et al. Biomolecules. 2021 Apr 22;11(5):622. doi: 10.3390/biom11050622. Biomolecules. 2021. PMID: 33922087 Free PMC article. Review. - Deubiquitinase USP35 restrains STING-mediated interferon signaling in ovarian cancer.
Zhang J, Chen Y, Chen X, Zhang W, Zhao L, Weng L, Tian H, Wu Z, Tan X, Ge X, Wang P, Fang L. Zhang J, et al. Cell Death Differ. 2021 Jan;28(1):139-155. doi: 10.1038/s41418-020-0588-y. Epub 2020 Jul 16. Cell Death Differ. 2021. PMID: 32678307 Free PMC article. - Chemical and Biomolecular Strategies for STING Pathway Activation in Cancer Immunotherapy.
Garland KM, Sheehy TL, Wilson JT. Garland KM, et al. Chem Rev. 2022 Mar 23;122(6):5977-6039. doi: 10.1021/acs.chemrev.1c00750. Epub 2022 Feb 2. Chem Rev. 2022. PMID: 35107989 Free PMC article. Review. - Positive correlation between programmed death ligand-1 and p53 in triple-negative breast cancer.
Zeng Y, Wang CL, Xian J, Ye Q, Qin X, Tan YW, Cao YD. Zeng Y, et al. Onco Targets Ther. 2019 Sep 3;12:7193-7201. doi: 10.2147/OTT.S209484. eCollection 2019. Onco Targets Ther. 2019. PMID: 31564903 Free PMC article. - Genetic variants in African-American and Hispanic patients with breast cancer.
Dutta P, Keung MY, Wu Y, Vadgama JV. Dutta P, et al. Oncol Lett. 2022 Dec 16;25(2):51. doi: 10.3892/ol.2022.13637. eCollection 2023 Feb. Oncol Lett. 2022. PMID: 36644153 Free PMC article.
References
- Loi S, Sirtaine N, Piette F, et al. Prognostic and predictive value of tumor-infiltrating lymphocytes in a phase III randomized adjuvant breast cancer trial in node-positive breast cancer comparing the addition of docetaxel to doxorubicin with doxorubicin-based chemotherapy: BIG 02-98. J Clin Oncol. 2013;31(7):860–867. - PubMed
- Denkert C, Loibl S, Noske A, et al. Tumor-associated lymphocytes as an independent predictor of response to neoadjuvant chemotherapy in breast cancer. J Clin Oncol. 2010;28(1):105–113. - PubMed
- Woo SR, Corrales L, Gajewski TF. Innate immune recognition of cancer. Annu Rev Immunol. 2015;33:445–474. - PubMed
- Quinn JE, Kennedy RD, Mullan PB, et al. BRCA1 functions as a differential modulator of chemotherapy-induced apoptosis. Cancer Res. 2003;63(19):6221–6228. - PubMed
MeSH terms
Substances
LinkOut - more resources
Full Text Sources
Other Literature Sources
Medical
Research Materials
Miscellaneous


