Hyperoxaluria leads to dysbiosis and drives selective enrichment of oxalate metabolizing bacterial species in recurrent kidney stone endures - PubMed (original) (raw)
Hyperoxaluria leads to dysbiosis and drives selective enrichment of oxalate metabolizing bacterial species in recurrent kidney stone endures
Mangesh V Suryavanshi et al. Sci Rep. 2016.
Abstract
Hyperoxaluria due to endogenously synthesized and exogenously ingested oxalates is a leading cause of recurrent oxalate stone formations. Even though, humans largely rely on gut microbiota for oxalate homeostasis, hyperoxaluria associated gut microbiota features remain largely unknown. Based on 16S rRNA gene amplicons, targeted metagenomic sequencing of formyl-CoA transferase (frc) gene and qPCR assay, we demonstrate a selective enrichment of Oxalate Metabolizing Bacterial Species (OMBS) in hyperoxaluria condition. Interestingly, higher than usual concentration of oxalate was found inhibitory to many gut microbes, including Oxalobacter formigenes, a well-characterized OMBS. In addition a concomitant enrichment of acid tolerant pathobionts in recurrent stone sufferers is observed. Further, specific enzymes participating in oxalate metabolism are found augmented in stone endures. Additionally, hyperoxaluria driven dysbiosis was found to be associated with oxalate content, stone episodes and colonization pattern of Oxalobacter formigenes. Thus, we rationalize the first in-depth surveillance of OMBS in the human gut and their association with hyperoxaluria. Our findings can be utilized in the treatment of hyperoxaluria associated recurrent stone episodes.
Figures
Figure 1. Subjects characterization.
(a) Total volume measurement 24 h urine data in Mean + SEM. (b) Oxalate content in 24 h urine data in Mean + SEM. (c) Surgically removed kidney stones from KSD2 subject (representative). (d) FTIR spectral evaluation of respective stones from KSD2 subject.
Figure 2
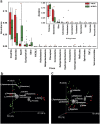
(a) Variations in major bacterial phyla and class in HLT and KSD subjects (*p = <0.1, **p = <0.05). PCoA biplot based on (b) Unweighted and (c) Weighted UniFrac distance matrix: Subjects are represented as HLT (red) and KSD (green) whereas taxonomic group influencing sample segregation are shown as grey sphere whose size demonstrate abundance.
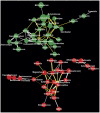
Figure 3. Microbial interaction network in HLT (red colored nodes) and KSD (green colored nodes) subjects represented at genus level.
Size of node is indicative of abundance and color of connecting edge indicate interaction type; co-presence: white and co-exclusion: yellow while its thickness represents weight of interactions.
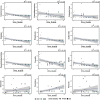
Figure 4. Spearman correlation indicating positive and negative responses of various microbial genera with oxalate concentration in 24 h urine.
Linear regression plot displaying best fit blue line with 95% confidence bands and size of sphere corresponds to oxalate concentration.
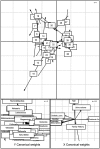
Figure 5. Co-inertia analysis of bacterial genera and subject characteristics.
Upper score plot indicate the best matching of 39 subjects with origin of arrows indicating bacterial genera and arrowhead indicating where spots would move relative to subject characteristics. Lower plots shows contribution of two groups of variable to the canonical space.
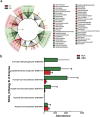
Figure 6. Graphical presentation of imputed metagenome in HLT (red) and KSD (green) subjects.
(a) Cladogram showing differential abundance of microbial originating metabolic functions. (b) Variation in abundance of known KOs involved in oxalate metabolism.
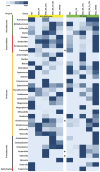
Figure 7. Heatmap representing common bacterial genera detected through 16S rRNA and _frc-_gene amplicon libraries in 5 groups.
*Indicates presence of bacterial genera in PCR-DGGE profile.
Figure 8. Heatmap representing pairwise inter-individual sharing of phylotypes amongst 5 groups.
Gradation of yellow color indicates sharing of phylotypes within KSD groups and blue color indicates sharing of phylotypes between HLT and KSD groups.
Figure 9. Dot plots representing the counts of selected bacterial taxa and genes by qPCR assay in HLT and KSD subjects.
Minimum and maximum count values are displayed for each plot in all tested subjects.
Similar articles
- Inhibition of urinary stone disease by a multi-species bacterial network ensures healthy oxalate homeostasis.
Miller AW, Choy D, Penniston KL, Lange D. Miller AW, et al. Kidney Int. 2019 Jul;96(1):180-188. doi: 10.1016/j.kint.2019.02.012. Epub 2019 Feb 28. Kidney Int. 2019. PMID: 31130222 Free PMC article. - Association of intestinal oxalate-degrading bacteria with recurrent calcium kidney stone formation and hyperoxaluria: a case-control study.
Tavasoli S, Alebouyeh M, Naji M, Shakiba Majd G, Shabani Nashtaei M, Broumandnia N, Basiri A. Tavasoli S, et al. BJU Int. 2020 Jan;125(1):133-143. doi: 10.1111/bju.14840. Epub 2019 Aug 18. BJU Int. 2020. PMID: 31145528 - Functional eubacteria species along with trans-domain gut inhabitants favour dysgenic diversity in oxalate stone disease.
Suryavanshi MV, Bhute SS, Gune RP, Shouche YS. Suryavanshi MV, et al. Sci Rep. 2018 Nov 9;8(1):16598. doi: 10.1038/s41598-018-33773-5. Sci Rep. 2018. PMID: 30413731 Free PMC article. - A critical analysis of the role of gut Oxalobacter formigenes in oxalate stone disease.
Siva S, Barrack ER, Reddy GP, Thamilselvan V, Thamilselvan S, Menon M, Bhandari M. Siva S, et al. BJU Int. 2009 Jan;103(1):18-21. doi: 10.1111/j.1464-410X.2008.08122.x. Epub 2008 Nov 18. BJU Int. 2009. PMID: 19021605 Review. - Forty Years of Oxalobacter formigenes, a Gutsy Oxalate-Degrading Specialist.
Daniel SL, Moradi L, Paiste H, Wood KD, Assimos DG, Holmes RP, Nazzal L, Hatch M, Knight J. Daniel SL, et al. Appl Environ Microbiol. 2021 Aug 26;87(18):e0054421. doi: 10.1128/AEM.00544-21. Epub 2021 Aug 26. Appl Environ Microbiol. 2021. PMID: 34190610 Free PMC article. Review.
Cited by
- Gut and Urinary Microbiota in Cats with Kidney Stones.
Joubran P, Roux FA, Serino M, Deschamps JY. Joubran P, et al. Microorganisms. 2024 May 29;12(6):1098. doi: 10.3390/microorganisms12061098. Microorganisms. 2024. PMID: 38930480 Free PMC article. - Defining Dysbiosis for a Cluster of Chronic Diseases.
Wilkins LJ, Monga M, Miller AW. Wilkins LJ, et al. Sci Rep. 2019 Sep 9;9(1):12918. doi: 10.1038/s41598-019-49452-y. Sci Rep. 2019. PMID: 31501492 Free PMC article. - Yi-Shen-Hua-Shi regulates intestinal microbiota dysbiosis and protects against proteinuria in patients with chronic kidney disease: a randomized controlled study.
Dong X, Zhang J, Li W, Li Y, Jia L, Liu Z, Fu W, Zhang A. Dong X, et al. Pharm Biol. 2024 Dec;62(1):356-366. doi: 10.1080/13880209.2024.2345080. Epub 2024 May 9. Pharm Biol. 2024. PMID: 38720666 Free PMC article. Clinical Trial. - Fecal transplant modifies urine chemistry risk factors for urinary stone disease.
Stern JM, Urban-Maldonado M, Usyk M, Granja I, Schoenfeld D, Davies KP, Agalliu I, Asplin J, Burk R, Suadicani SO. Stern JM, et al. Physiol Rep. 2019 Feb;7(4):e14012. doi: 10.14814/phy2.14012. Physiol Rep. 2019. PMID: 30789675 Free PMC article. - The impact of microbiome in urological diseases: a systematic review.
Li JKM, Chiu PKF, Ng CF. Li JKM, et al. Int Urol Nephrol. 2019 Oct;51(10):1677-1697. doi: 10.1007/s11255-019-02225-y. Epub 2019 Jul 12. Int Urol Nephrol. 2019. PMID: 31301004
References
- Cochat P. & Rumsby G. Primary hyperoxaluria. N. Engl. J. Med. 369, 649–658 (2013). - PubMed
- Ivanovski O. & Drüeke T. B. A new era in the treatment of calcium oxalate stones? Kidney Int. 83, 998–1000 (2013). - PubMed
- Robijn S., Hoppe B., Vervaet B. a., D’Haese P. C. & Verhulst A. Hyperoxaluria: a gut-kidney axis? Kidney Int 80, 1146–1158 (2011). - PubMed
- Jonassen J. A., Cao L.-C., Honeyman T. & Scheid C. R. Mechanisms mediating oxalate-induced alterations in renal cell functions. Crit. Rev. Eukaryot. Gene Expr. 13, 55–72 (2003). - PubMed
Publication types
MeSH terms
Substances
LinkOut - more resources
Full Text Sources
Other Literature Sources

