Emergence of heterogeneity in acute leukemias - PubMed (original) (raw)
Emergence of heterogeneity in acute leukemias
Thomas Stiehl et al. Biol Direct. 2016.
Abstract
Background: Leukemias are malignant proliferative disorders of the blood forming system. Sequencing studies demonstrate that the leukemic cell population consists of multiple clones. The genetic relationship between the different clones, referred to as the clonal hierarchy, shows high interindividual variability. So far, the source of this heterogeneity and its clinical relevance remain unknown. We propose a mathematical model to study the emergence and evolution of clonal heterogeneity in acute leukemias. The model allows linking properties of leukemic clones in terms of self-renewal and proliferation rates to the structure of the clonal hierarchy.
Results: Computer simulations imply that the self-renewal potential of the first emerging leukemic clone has a major impact on the total number of leukemic clones and on the structure of their hierarchy. With increasing depth of the clonal hierarchy the self-renewal of leukemic clones increases, whereas the proliferation rates do not change significantly. The emergence of deep clonal hierarchies is a complex process that is facilitated by a cooperativity of different mutations.
Conclusion: Comparison of patient data and simulation results suggests that the self-renewal of leukemic clones increases with the emergence of clonal heterogeneity. The structure of the clonal hierarchy may serve as a marker for patient prognosis.
Reviewers: This article was reviewed by Marek Kimmel, Tommaso Lorenzi and Tomasz Lipniacki.
Keywords: Acute leukemia; Clonal evolution; Clonal hierarchy; Heterogeneity; Mathematical modeling; Mutation; Patient prognosis; Self-renewal.
Figures
Fig. 1
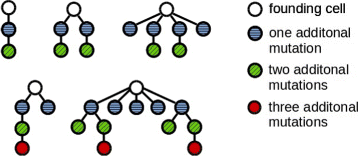
Examples of the clonal architecture detected in leukemic patients. Each tree corresponds to one patient. The cell at the top corresponds to the leukemic founder cell which acquires additional mutations and gives rise to multiple leukemic clones. The examples are taken from [12]. Reconstruction of the clonal architecture from genetic measurements is not always unique. In case of ambiguity only one possibility is shown in the figure
Fig. 2
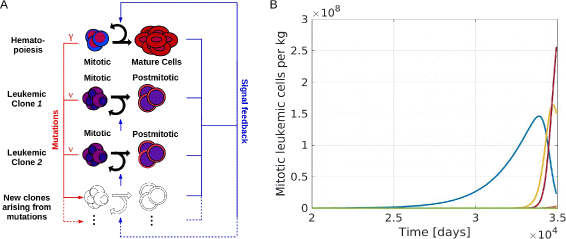
Overview of the mathematical model. a Model structure: The model includes one hematopoietic cell line and an arbitrary number of leukemic clones. Leukemic and healthy cells interact by feedback signals. Due to mutations new clones with different properties arise. Mutation rates of leukemic and healthy cells are denoted as ν and γ resp. b Example simulation: The panel shows the time course of mitotic leukemic cells. The horizontal axis shows the time since appearance of the first leukemic cell. The simulation ends when the mature healthy cell count is below 5 % of its steady state value. This corresponds to the death of the patient. Each color represents one clone
Fig. 3
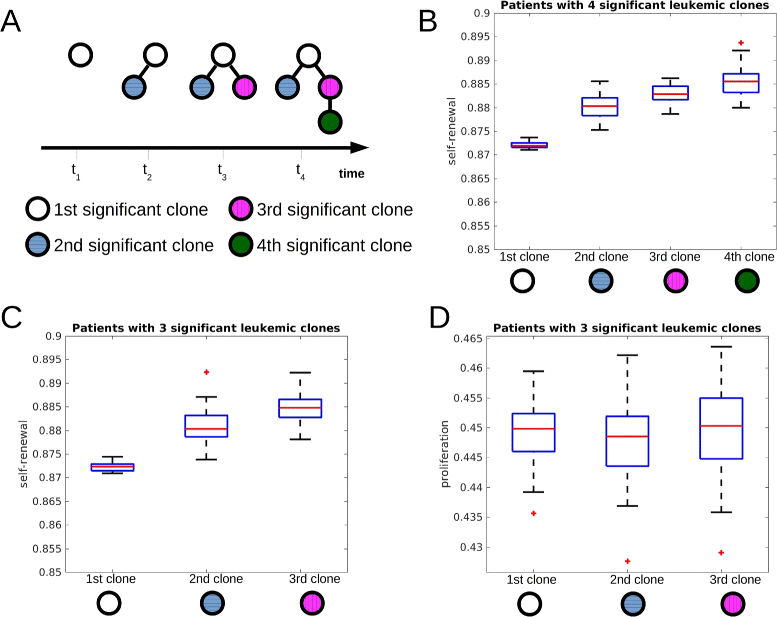
Self-renewal rate of significant clones increases during the course of the disease. The figure is based on 600 simulated patients. a Time evolution of one simulated patient who developed 4 clones during the course of the disease. The first, second, third and fourth significant clone are depicted using different colors. b Self-renewal rates of the first, second, third and fourth significant leukemic clone of the subgroup of patients harboring 4 significant clones at the end of the simulation (reduction of healthy cell count by 95 %). The self-renewal rates differ significantly (p<0.05 in t-test) between first and second, second and third, third and fourth clone. **c** Self-renewal rates of the first, second and third significant leukemic clone of the subgroup of patients harboring 3 clones at the end of simulations. The self-renewal rates differ significantly between the clones (p_<0.05 in t-test). **d** Proliferation rates of the first, second and third significant leukemic clone of the subgroup of patients harboring 3 clones at the end of simulation. The proliferation rates do not differ significantly between the clones (_p_>0.05 in t-test). Parameters: mutation rate ν_=5·10−9, self-renewal and proliferation rates of the new clones are normally distributed with the means of the distributions equal to proliferation and self-renewal rates of the parent clone and standard deviation equal to 0.005. The central mark is the median, the edges of the box are the 25th and 75th percentiles, points are drawn as outliers if they are larger than q 3+1.5(q 3−_q 1) or smaller than q 1−1.5(q 3−_q 1), where q 1 and q 3 are the 25th and 75th percentiles, respectively
Fig. 4
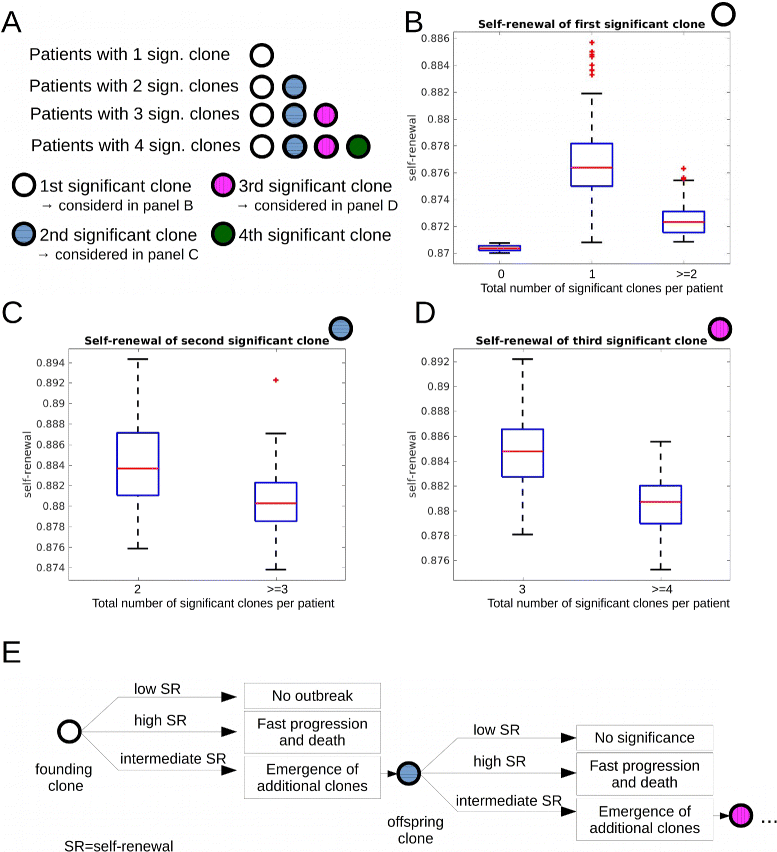
Impact of self-renewal rate on the total number of significant clones. Data from 600 simulated patients. a Overview over panels (b)–(d). b We compare self-renewal rate of the first significant clone in two patient groups. Group 1: patients harboring only one significant clone throughout the disease. Group 2: patients harboring more than one significant clone. The self-renewal rate of the first significant clone is significantly higher in group 1. Leftmost plot in (b): If the self-renewal rate of leukemic clones is close to the self-renewal rate of healthy cells, no significant clones emerge. c We compare the self-renewal rate of the second significant clone in two patient groups. Group 1: patients harboring two significant clones throughout the disease. Group 2: patients harboring more than two significant clones. The self-renewal rate of the second significant clone is significantly higher in group 1. d We compare the self-renewal rates of the third emerging significant clone in two patient groups. Group 1: patients harboring three significant clones throughout the disease. Group 2: patients harboring more than three significant clones. The self-renewal rate of the third significant clone is significantly higher in group 1. e Explanation of data in (b)–(d): Clones with high self-renewal rates lead to fast progression of the disease and death before new significant clones can emerge. Clones with small self-renewal rates never grow to a significant size. Clones with intermediate self-renewal rates grow with moderate speed and their offspring have enough time to grow to a significant size. Proliferation rates do not differ significantly between all considered groups. Parameters: mutation rate _ν_=5·10−9, self-renewal and proliferation rates of the new clones are normally distributed with the mean of the distributions equal to proliferation and self-renewal rates of the parent clone and standard deviation equal to 0.005. Significance: p<0.05 in t-test
Fig. 5
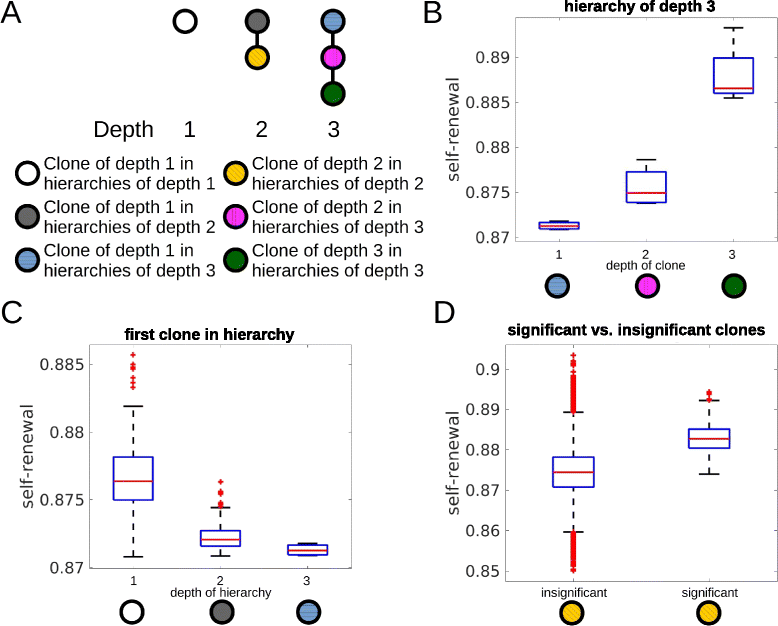
Impact of the self-renewal rate on the depth of the hierarchy. The figure is based on 600 simulated patients. a Examples for hierarchies of different depths. Colors are used to visualize clones of different depths. b Self-renewal rate of significant clones increases significantly (p<0.05 in t-test) with the depth of the clones in hierarchies. Considered are only patients with clonal hierarchies of depth 3. c Properties of the first clone in the hierarchy decides about the depth of the hierarchy. Only if self-renewal rate of the first clone is small enough deep hierarchies emerge. If self-renewal rate of the first clone is high, disease progression and death occur before deep hierarchies can establish. d Comparison of self-renewal rates of significant and insignificant clones of depth 2. Self-renewal rates of insignificant clones is significantly smaller than self-renewal rates of significant clones. This demonstrates that clones do not become significant if their self-renewal rate is too small. Some of the insignificant clones show high self-renewal rates. These clones have originated late during the disease and could not grow to a significant size before death of the patients. If proliferation rate is very slow, clones with high self-renewal cannot grow to a significant size. Proliferation rate has no impact on the depth of the hierarchy. Parameters: mutation rate _ν_=5·10−9, self-renewal and proliferation rates of the new clones are normally distributed with the mean of the distributions equal to proliferation and self-renewal rates of the parent clone and standard deviation equal to 0.005
Fig. 6
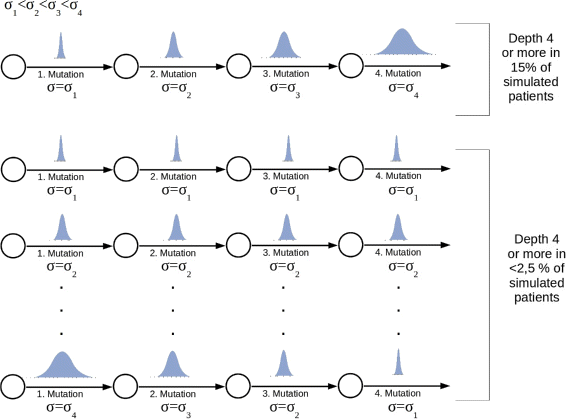
Impact of cooperativity between mutations on depth of the hierarchy. The figure is based on 100 simulated patients. The number of patients harboring a clonal hierarchy of depth 4 or more is maximized, if the jumps in the trait spaces increase with the number of mutations. Parameters: Self-renewal and proliferation rates of the leukemic founder clone are drawn from normal distributions with mean values equal to proliferation and self-renewal rates of healthy cells and standard deviation σ 1=0.0014. First mutation: self-renewal and proliferation rates of the new clone are normally distributed with the means of the distributions equal to proliferation and self-renewal rates of the founder clone and standard deviation σ 2=5·σ 1. Second mutation: self-renewal and proliferation rates of the new clone are normally distributed with the means of the distributions equal to proliferation and self-renewal rates of the parent clone and standard deviation σ 3=20·σ 1. Third and higher mutations: self-renewal and proliferation rates of the new clone are normally distributed with the means of the distributions equal to proliferation and self-renewal rates of the parent clone and standard deviation σ 3=100·σ 1. Mutation rate _ν_=5·10−9
Fig. 7
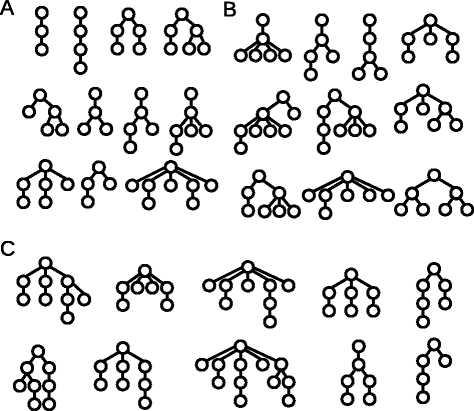
Examples for the clonal architecture detected in leukemic patients and simulations. Each tree corresponds to one patient. a Clonal hierarchies detected in patients from [12] and in simulations. b Clonal hierarchies detected in simulations but not in patients from [12]. c Clonal hierarchies detected in patients from [12] but not in simulations. The reconstruction of the clonal architecture from genetic measurements is not always unique. In case of ambiguity only one possibility is shown in the figure. Parameters were set as specified in the caption of Fig. 6
Similar articles
- A structured population model of clonal selection in acute leukemias with multiple maturation stages.
Lorenzi T, Marciniak-Czochra A, Stiehl T. Lorenzi T, et al. J Math Biol. 2019 Oct;79(5):1587-1621. doi: 10.1007/s00285-019-01404-w. Epub 2019 Jul 26. J Math Biol. 2019. PMID: 31350582 - Clonal Architecture and Evolutionary Dynamics in Acute Myeloid Leukemias.
Duchmann M, Laplane L, Itzykson R. Duchmann M, et al. Cancers (Basel). 2021 Sep 29;13(19):4887. doi: 10.3390/cancers13194887. Cancers (Basel). 2021. PMID: 34638371 Free PMC article. Review. - Computational Reconstruction of Clonal Hierarchies From Bulk Sequencing Data of Acute Myeloid Leukemia Samples.
Stiehl T, Marciniak-Czochra A. Stiehl T, et al. Front Physiol. 2021 Aug 23;12:596194. doi: 10.3389/fphys.2021.596194. eCollection 2021. Front Physiol. 2021. PMID: 34497529 Free PMC article. - Tracing dynamics and clonal heterogeneity of Cbx7-induced leukemic stem cells by cellular barcoding.
Klauke K, Broekhuis MJC, Weersing E, Dethmers-Ausema A, Ritsema M, González MV, Zwart E, Bystrykh LV, de Haan G. Klauke K, et al. Stem Cell Reports. 2015 Jan 13;4(1):74-89. doi: 10.1016/j.stemcr.2014.10.012. Epub 2014 Nov 26. Stem Cell Reports. 2015. PMID: 25434821 Free PMC article. - Clonal heterogeneity as a driver of disease variability in the evolution of myeloproliferative neoplasms.
Prick J, de Haan G, Green AR, Kent DG. Prick J, et al. Exp Hematol. 2014 Oct;42(10):841-51. doi: 10.1016/j.exphem.2014.07.268. Epub 2014 Sep 6. Exp Hematol. 2014. PMID: 25201757 Review.
Cited by
- Predicting Time to Relapse in Acute Myeloid Leukemia through Stochastic Modeling of Minimal Residual Disease Based on Clonality Data.
Dinh KN, Jaksik R, Corey SJ, Kimmel M. Dinh KN, et al. Comput Syst Oncol. 2021 Sep;1(3):e1026. doi: 10.1002/cso2.1026. Epub 2021 Sep 14. Comput Syst Oncol. 2021. PMID: 34541576 Free PMC article. - Mathematical modeling of the impact of cytokine response of acute myeloid leukemia cells on patient prognosis.
Stiehl T, Ho AD, Marciniak-Czochra A. Stiehl T, et al. Sci Rep. 2018 Feb 12;8(1):2809. doi: 10.1038/s41598-018-21115-4. Sci Rep. 2018. PMID: 29434256 Free PMC article. - HSC Niche Dynamics in Regeneration, Pre-malignancy, and Cancer: Insights From Mathematical Modeling.
Pedersen RK, Andersen M, Skov V, Kjær L, Hasselbalch HC, Ottesen JT, Stiehl T. Pedersen RK, et al. Stem Cells. 2023 Mar 17;41(3):260-270. doi: 10.1093/stmcls/sxac079. Stem Cells. 2023. PMID: 36371719 Free PMC article. - Polytherapy and Targeted Cancer Drug Resistance.
Chatterjee N, Bivona TG. Chatterjee N, et al. Trends Cancer. 2019 Mar;5(3):170-182. doi: 10.1016/j.trecan.2019.02.003. Epub 2019 Feb 26. Trends Cancer. 2019. PMID: 30898264 Free PMC article. Review. - Investigation of solid tumor progression with account of proliferation/migration dichotomy via Darwinian mathematical model.
Kuznetsov M, Kolobov A. Kuznetsov M, et al. J Math Biol. 2020 Feb;80(3):601-626. doi: 10.1007/s00285-019-01434-4. Epub 2019 Oct 1. J Math Biol. 2020. PMID: 31576418
References
Publication types
MeSH terms
LinkOut - more resources
Full Text Sources
Other Literature Sources
Medical
