Chm7 and Heh1 collaborate to link nuclear pore complex quality control with nuclear envelope sealing - PubMed (original) (raw)
Chm7 and Heh1 collaborate to link nuclear pore complex quality control with nuclear envelope sealing
Brant M Webster et al. EMBO J. 2016.
Abstract
The integrity of the nuclear envelope barrier relies on membrane remodeling by the ESCRTs, which seal nuclear envelope holes and contribute to the quality control of nuclear pore complexes (NPCs); whether these processes are mechanistically related remains poorly defined. Here, we show that the ESCRT-II/III chimera, Chm7, is recruited to a nuclear envelope subdomain that expands upon inhibition of NPC assembly and is required for the formation of the storage of improperly assembled NPCs (SINC) compartment. Recruitment to sites of NPC assembly is mediated by its ESCRT-II domain and the LAP2-emerin-MAN1 (LEM) family of integral inner nuclear membrane proteins, Heh1 and Heh2. We establish direct binding between Heh2 and the "open" forms of both Chm7 and the ESCRT-III, Snf7, and between Chm7 and Snf7. Interestingly, Chm7 is required for the viability of yeast strains where double membrane seals have been observed over defective NPCs; deletion of CHM7 in these strains leads to a loss of nuclear compartmentalization suggesting that the sealing of defective NPCs and nuclear envelope ruptures could proceed through similar mechanisms.
Keywords: ESCRT; LEM domain; nuclear envelope; nuclear transport; quality control.
© 2016 The Authors.
Figures
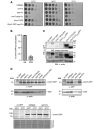
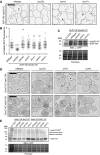
Figure EV1. Expression levels of Chm7‐GFP and truncations
- Tenfold serial dilutions of the indicated yeast strains grown at 23, 30 or 37°C for 2–4 days.
- Plot of the percentage of Chm7‐GFP foci that colocalize with the NE or with Mps3‐mCherry‐labeled SPBs. Error bars are SD from the mean from three independent experiments where > 50 Chm7‐GFP foci were counted.
- Relative levels of GFP fusions of Chm7 and truncations assessed by Western blot with anti‐GFP antibody and ECL detection; anti‐actin is a loading control. Left and right panels are from same nitrocellulose membrane at same exposure. Note that constructs in left panel are expressed from the endogenous CHM7 promoter, whereas right panel constructs are expressed behind the GPD promoter. Numbers reflect positions of molecular weight (MW) standards.
- Western blots (anti‐GFP) detecting Chm7‐GFP levels in the indicated strains with anti‐actin loading control or Ponceau‐stained membrane to assess relative protein loads.
Source data are available online for this figure.
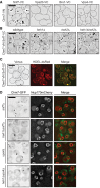
Figure 1. Chm7 localizes to a focus on the NE
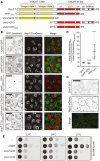
- Schematic of the predicted domain architecture of Chm7 and truncations. Green circle is a Chm7‐specific insertion (relative to Vps25; see Appendix Fig S1). MIM is microtubule interacting motif. Red stripes denote putative autoinhibitory helices. Numbers are amino acid residues.
- Deconvolved fluorescence micrographs of Chm7‐GFP and truncations with Nup170‐mCherry NE marker and merge of green and red channels. Scale bar is 5 μm.
- Scatter plot of the mean fluorescence intensity with SD of individual NE foci (horizontal line is mean). n > 50 foci were measured for each GFP fusion; _P_‐values from unpaired Student's _t_‐test. ***P ≤0.001; ****P ≤0.0001.
- Deconvolved fluorescence micrographs of Chm7‐GFP and Mps3‐mCherry with merge of green and red images (bottom). Scale bar is 5 μm.
- Tenfold serial dilutions of _chm7_Δ_apq12_Δ strains grown at the indicated temperatures with either an empty pRS416 plasmid (−) or those expressing the indicated Chm7 constructs (pRS416‐HA‐CHM7, pRS416‐HA‐chm7‐NTD, pRS416‐HA‐chm7‐CTD). See Appendix Fig S2A for protein levels.
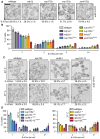
Figure 2. Heh1 is required for Chm7 recruitment to the NE subdomain
- Deconvolved inverted fluorescence micrographs Chm7‐GFP and truncations in the indicated null strains. Scale bar is 5 μm.
- Plot of the percentage (± SD) of cells with Chm7‐GFP (and truncations) NE foci from (A). Data are from three independent replicates where > 200 cells were counted for each strain.
- Deconvolved inverted fluorescence micrographs of Chm7‐GFP in a _heh1_Δ strain containing either an empty pRS426 plasmid (−) or those expressing HEH1 (pRS426‐HEH1) or HEH2 (pRS426‐HEH2).
- Plots of the percentage of cells (± SD) with Chm7‐GFP NE foci from (C). Data are from three independent replicates where > 200 cells were counted for each strain. _P_‐values from unpaired Student's _t_‐test. **P ≤0.01.
Figure 3. Heh2 directly binds Chm7 and Snf7
- A, B
Schematics of the domain organization and secondary structure of Heh2 and Snf7 and truncations with amino acid numbers. LEM is LAP2‐emerin‐MAN1 (green), TM is transmembrane (black), MCHD is MAN1 C‐terminal homology domain (brown), and MIM is microtubule interacting motif (purple). The striped α‐helix 5 represents the autoinhibitory helix. - C
GST, GST‐Snf7, and GST‐snf7OPEN were immobilized on GT‐resin and incubated with buffer (−) or recombinant heh2(1‐308)‐His6. Bound proteins separated by SDS–PAGE were visualized by Coomassie stain and by Western blot with anti‐His6 antibody and ECL detection (WB; top panel). Middle panel shows indicated cropped region of the gel where contrast has been increased. Numbers on the side of the gel show position of molecular weight (MW) markers. - D
In vitro transcription translation (IVT) reactions generating radiolabeled (35S) truncations of Heh2 (inputs) were incubated with bead‐bound GST, GST‐snf7OPEN, or GST‐Snf7 before washing, elution, and detection of bound proteins by autoradiography (top panel) or Coomassie staining (bottom). - E
As in (C) except with GST‐Chm7 constructs. Upper panel shows Western blot (WB) with anti‐His6 antibody. Asterisk (*) indicates that chm7‐NTD is also expressed with a His6 tag. Bottom panel is Coomassie stained. - F
As in (E) except with MBP‐Snf7.
Figure EV2. Co‐incubation of Snf7 and Heh2 does not alter their binding to chm7‐CTDOPEN
GST and GST fusions of Chm7 and truncations were immobilized on GT‐resin and incubated with buffer (−), recombinant heh2(1‐308)‐His6, or MBP‐Snf7. Bound proteins were separated by SDS–PAGE and visualized by Coomassie stain. Numbers on the side of the gel show position of molecular weight (MW) markers.
Figure 4. Heh1‐Chm7 interactions occur at the NE subdomain
- A
Deconvolved inverted fluorescence micrographs of BiFC signal of Chm7‐VC with either Heh1‐VN or Heh2‐VN. Cell borders are outlined. Scale bar is 5 μm. - B
Deconvolved inverted fluorescence micrographs of yeast strains expressing Heh1‐VN and Snf7‐VC with either Chm7‐mCherry or Mps3‐mCherry and merge of both channels. Scale bar is 5 μm. - C
Deconvolved inverted fluorescence micrographs of BiFC signal of the indicated VN and VC fusions in the indicated strains. Cell borders are outlined. Scale bar is 5 μm. - D, E
Plots of the percentage of cells with BiFC signal of the indicated VN VC pairs in the indicated null backgrounds. Data are from three independent replicates where > 225 cells per strain per replicate were quantified. Error bars are SD from the mean of each replicate. _P_‐values from unpaired Student's _t_‐test where ns is P >0.05. *P ≤0.05; **P ≤0.01; ***P ≤0.001; ****P ≤0.0001. - F
Deconvolved inverted fluorescence micrographs of Heh1‐VN Snf7‐VC BiFC signal in a _chm7_Δ strain with either an empty plasmid (−; pRS416) or a plasmid expressing CHM7 (pRS416‐HA‐chM7). Cell borders are outlined. Scale bar is 5 μm. - G
Plot of the percentage of cells with BiFC signal from (F). Error bars are SD from the mean of each replicate. _P_‐values from unpaired Student's _t_‐test where ns is P >0.05. ***P ≤0.001.
Figure EV3. Chm7 BiFC interactions
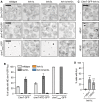
- Deconvolved inverted fluorescence micrographs of BiFC signal of Snf7‐VN and Vps20‐VC in the indicated genetic backgrounds. Cell borders are outlined. Scale bar is 5 μm.
- Plot of total cellular BiFC fluorescence of Snf7‐VN and Vps20‐VC in the indicated strains. Data are from three independent replicates where 100 cells per strain were quantified. Error bars are SD from the mean of each replicate. _P_‐values from unpaired Student's _t_‐test where ns is P >0.05; *P ≤0.05; **P ≤0.01; ****P ≤0.0001.
- Western blot using polyclonal anti‐GFP antibodies to detect both VN and VC fusions of Snf7‐VN and Vps20‐VC in the indicated strains; detection by ECL. Bottom panel shows Ponceau‐stained nitrocellulose membrane as a total protein load reference. Numbers at the side show positions of molecular weight (MW) markers.
- Deconvolved inverted fluorescence micrographs of BiFC signal in the indicated yeast strains expressing Chm7‐VC and either Heh1‐VN or Heh2‐VN. Cell borders are outlined. Scale bar is 5 μm.
- Western blot of VN and VC fusions in the indicated strains detected using a polyclonal anti‐GFP antibody and ECL. To assess relative protein loads, bottom panel shows corresponding Ponceau‐stained nitrocellulose membrane.
Figure EV4. Chm7‐Snf7 interactions can occur outside of the NE
- Deconvolved inverted fluorescence micrographs of BiFC signal in wild‐type yeast strains expressing Chm7‐VN and the indicated VC fusions. Cell borders are outlined. Scale bar is 5 μm.
- Deconvolved inverted fluorescence micrographs of BiFC signal of Chm7‐VN and Snf7‐VC in the indicated null backgrounds. Cell borders are outlined. Scale bar is 5 μm.
- Deconvolved fluorescence micrographs of BiFC signal of Chm7‐VN and Snf7‐VC with NE/ER marker HDEL‐dsRED and merge. Note there is a small amount of bleed‐through of the HDEL‐dsRED into the Venus channel. Cell borders are outlined. Scale bar is 5 μm.
- Deconvolved fluorescence micrographs of Chm7‐GFP and Nup170‐mCherry (with merge) in the indicated strains. Scale bar is 5 μm.
Figure 5. Chm7 accumulates in the SINC
- Deconvolved inverted fluorescence micrographs of Chm7‐GFP in the indicated strains. Scale bar is 5 μm. The percentage of cells ± SD with Chm7‐GFP foci is indicated below each panel.
- Deconvolved fluorescence images of SINC‐containing nuclei in _vps4_Δ and _vps4_Δ_pom152_Δ cells expressing Chm7‐GFP and Nup170‐mCherry (green, red, and merged images are shown). Scale bar is 1 μm.
- Plot of the proportion of nup clusters with Chm7‐GFP enrichment in the indicated genetic backgrounds. Error bars are SD of the mean from three independent replicates.
- Deconvolved fluorescence micrograph showing the lack of colocalization of Chm7‐GFP and clustered Nup170‐mCherry in a _nup133_Δ strain. Scale bar is 1 μm.
- Plot of the total fluorescence/integrated density (in arbitrary units, A.U.) of Chm7‐GFP within (and outside of) the SINC. Error bars represent SD deviation of the mean from > 50 SINC or non‐SINC accumulations pooled from three independent replicates. _P_‐values from unpaired Student's _t_‐tests with Welch's correction. ****P ≤0.0001.
- Correlation of the total fluorescence intensity/integrated density of SINC‐enriched Chm7‐GFP and Nup170‐mCherry within individual SINCs. Linear regression calculated from 150 SINCs pooled from three independent replicates; r is the linear correlation (Pearson's) coefficient.
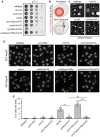
Figure 6. CHM7 is required for SINC formation
- Tenfold serial dilutions of the indicated yeast strains were grown on YPD at 23°C for 3 days before imaging.
- Schematic of Sna3‐mCherry localization. Sna3 accumulates in the vacuole (V) or class E compartment (E) in cells with, or lacking, ESCRT function, respectively.
- Deconvolved fluorescence micrographs of Sna3‐mCherry in the indicated genetic backgrounds. Scale bar is 5 μm.
- Deconvolved fluorescence micrographs (maximum intensity projections of a z‐series of images) of GFP‐Nup49 in the indicated yeast strains (arrows indicate SINCs). Scale bar is 5 ?m.
- Plot of proportion of cells in the indicated strains with SINCs. Error bars are the SD from the mean from three independent replicates quantifying > 300 cells for each strain. _P_‐values from unpaired Student's _t_‐test where ns is P >0.05; *P ≤0.05; **P ≤0.01; ***P ≤0.001.
Figure EV5. Chm7‐GFP analysis in NPC‐defective strains
- Schematic of the yeast NPC depicting distinct nup subcomplexes and corresponding architectural units. Listed nups are referred to in the text.
- Plot of the percentage of cells with Chm7‐GFP foci in the indicated genetic backgrounds and temperatures (23 and 37°C temperature shifts were for 5 h; where not indicated, cells grown at 30°C). Error bars are SD from the mean from three independent experiments where > 175 cells per strain or condition were assessed. _P_‐values from unpaired Student's _t_‐test. **P ≤0.01; ***P ≤0.001; ****P ≤0.0001.
- Western blot using an anti‐GFP antibody and ECL to detect Chm7‐GFP levels in the indicated genetic backgrounds. Cells were grown at the indicated temperatures for 5 h prior to protein harvesting or 3 h for _nup116_Δ cells. Bottom panel is Ponceau‐stained nitrocellulose membrane to show relative protein loads.
- Deconvolved inverted fluorescence micrographs of Chm7‐GFP in wild‐type or _apq12_Δ strains treated as indicated for 45 min. Scale bar is 5 μm.
- Plot of the percentage of cells with Chm7‐GFP foci in wild‐type cells or _apq12_Δ cells treated as indicated. Data are from three independent replicates of > 150 cells per condition. Error bars represent SD from the mean. _P_‐values are from unpaired Student's _t_‐test where ns is P > 0.05; **P ≤ 0.01 ; ****P ≤ 0.0001.
- Plot of the percentage of cells with Chm7‐GFP foci in the indicated strains after 5 h at the indicated temperature or 3 h for _nup116_Δ. Data are from three independent replicates of > 100 cells. Error bars represent SD from the mean. _P‐_values from unpaired Student's _t_‐test where ns is P >0.05; *P ≤0.05; **P ≤0.01; ***P ≤0.001.
- Deconvolved inverted fluorescence micrographs of Chm7‐GFP in the indicated strains. Scale bar is 5 μm.
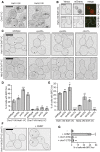
Figure 7. Perturbation of NPC assembly leads to NE accumulation of Chm7
- Deconvolved inverted fluorescence micrographs of the indicated strains expressing Chm7‐GFP (percentages ± SD of the proportion of cells with Chm7‐GFP foci are shown at bottom of each panel, see Fig EV5B). Scale bar is 5 μm.
- Plot of the percentage of cells with the indicated number of Chm7‐GFP foci. Error bars are SD from the mean from three independent replicates of > 50 foci per strain. _P_‐values from two‐way ANOVA where ns represents P >0.05; *P ≤0.05; **P ≤0.01; ****P ≤0.0001.
- Deconvolved inverted fluorescence micrographs of strains expressing Chm7‐GFP after 5 h at 23°C (top) or 37°C (bottom). Scale bar is 5 μm. Percentages ± SD of the proportion of cells with Chm7‐GFP NE foci are shown under each panel (see Fig EV5F).
- Plots of the percentage of cells from (C) with the indicated number of Chm7‐GFP foci at 23°C (left) and 37°C (right). Error bars are SD from the mean from three independent replicates of > 50 foci per strain. _P_‐values from two‐way ANOVA where ns is P >0.05; *P ≤0.05; **P ≤0.01; ***P ≤0.001; ****P ≤0.0001.
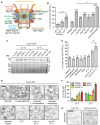
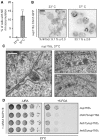
Figure 8. _nup116_Δ cells require CHM7 for growth and accumulate Chm7 and NE herniations
- Plot of the percentage of _nup116_Δ cells incubated for 3 h at 37°C with nuclear rim‐like accumulations of Chm7‐GFP. Error bars are SD from the mean from three independent replicates of > 100 cells. _P‐_values from unpaired Student's _t_‐test; ***P ≤0.001.
- Deconvolved inverted fluorescence micrographs of Chm7‐GFP in _nup116_Δ cells at either 23°C or grown for 3 h at 37°C. Percentages ± SD of the proportion of cells with Chm7‐GFP NE foci are shown under each panel (see Fig EV5F).
- Electron micrographs showing herniations of the NE in _nup116_Δ cells after incubation for 3 h at 37°C. N denotes nuclear interior. Scale bars are 100 nm.
- Tenfold serial dilutions of the indicated strains grown in medium permissive (‐URA) or restrictive (5‐FOA) of the retention of a URA3/NUP116 plasmid. Images acquired after incubation for 3 days (left) or 6 days (right) at 23°C.
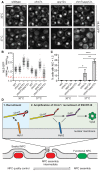
Figure 9. Chm7 protects nuclear compartmentalization
- Deconvolved fluorescence micrographs of NLS‐GFP in the indicated yeast strains at either 30°C or after 2 h at 37°C. Scale bar is 5 μm.
- Plot of the mean nuclear to cytosolic fluorescence intensity ratio of NLS‐GFP from cells represented in (A). Error bars are SD from the mean from three independent replicates of 150 cells from each strain. Only _chm7_Δ and _chm7_Δ_apq12_Δ cells have N:C ratios below 1.2 (dotted red line).
- Re‐plotting of data from (B) showing the percentage of cells with a N:C NLS‐GFP fluorescence ratio < 1.2. Error bars are SD from the mean from three independent replicates of 150 cells/strain. _P_‐values from Student's _t_‐test; *P ≤0.05; **P ≤0.01; ****P ≤0.0001.
- Model of a proposed stepwise recruitment and activation of Chm7 and other ESCRTs at defective NPCs (bottom, red), or NE holes.
Similar articles
- An ESCRT-LEM protein surveillance system is poised to directly monitor the nuclear envelope and nuclear transport system.
Thaller DJ, Allegretti M, Borah S, Ronchi P, Beck M, Lusk CP. Thaller DJ, et al. Elife. 2019 Apr 3;8:e45284. doi: 10.7554/eLife.45284. Elife. 2019. PMID: 30942170 Free PMC article. - ESCRT recruitment by the S. cerevisiae inner nuclear membrane protein Heh1 is regulated by Hub1-mediated alternative splicing.
Capella M, Martín Caballero L, Pfander B, Braun S, Jentsch S. Capella M, et al. J Cell Sci. 2020 Dec 21;133(24):jcs250688. doi: 10.1242/jcs.250688. J Cell Sci. 2020. PMID: 33262311 - Direct binding of ESCRT protein Chm7 to phosphatidic acid-rich membranes at nuclear envelope herniations.
Thaller DJ, Tong D, Marklew CJ, Ader NR, Mannino PJ, Borah S, King MC, Ciani B, Lusk CP. Thaller DJ, et al. J Cell Biol. 2021 Mar 1;220(3):e202004222. doi: 10.1083/jcb.202004222. J Cell Biol. 2021. PMID: 33464310 Free PMC article. - Nuclear envelope insertion of spindle pole bodies and nuclear pore complexes.
Jaspersen SL, Ghosh S. Jaspersen SL, et al. Nucleus. 2012 May-Jun;3(3):226-36. doi: 10.4161/nucl.20148. Epub 2012 May 1. Nucleus. 2012. PMID: 22572959 Free PMC article. Review. - Closing a gap in the nuclear envelope.
Vietri M, Stenmark H, Campsteijn C. Vietri M, et al. Curr Opin Cell Biol. 2016 Jun;40:90-97. doi: 10.1016/j.ceb.2016.03.001. Epub 2016 Mar 24. Curr Opin Cell Biol. 2016. PMID: 27016712 Review.
Cited by
- ESCRT-III: a versatile membrane remodeling machinery and its implications in cellular processes and diseases.
Park J, Kim J, Park H, Kim T, Lee S. Park J, et al. Anim Cells Syst (Seoul). 2024 Jul 25;28(1):367-380. doi: 10.1080/19768354.2024.2380294. eCollection 2024. Anim Cells Syst (Seoul). 2024. PMID: 39070887 Free PMC article. Review. - The ESCRT machinery directs quality control over inner nuclear membrane architecture.
Shankar R, Lettman MM, Whisler W, Frankel EB, Audhya A. Shankar R, et al. Cell Rep. 2022 Jan 18;38(3):110263. doi: 10.1016/j.celrep.2021.110263. Cell Rep. 2022. PMID: 35045304 Free PMC article. - Structure, Maintenance, and Regulation of Nuclear Pore Complexes: The Gatekeepers of the Eukaryotic Genome.
Raices M, D'Angelo MA. Raices M, et al. Cold Spring Harb Perspect Biol. 2022 Mar 1;14(3):a040691. doi: 10.1101/cshperspect.a040691. Cold Spring Harb Perspect Biol. 2022. PMID: 34312247 Free PMC article. Review. - Sealing holes in cellular membranes.
Zhen Y, Radulovic M, Vietri M, Stenmark H. Zhen Y, et al. EMBO J. 2021 Apr 1;40(7):e106922. doi: 10.15252/embj.2020106922. Epub 2021 Mar 1. EMBO J. 2021. PMID: 33644904 Free PMC article. Review. - Nuclear Membrane Rupture and Its Consequences.
Maciejowski J, Hatch EM. Maciejowski J, et al. Annu Rev Cell Dev Biol. 2020 Oct 6;36:85-114. doi: 10.1146/annurev-cellbio-020520-120627. Epub 2020 Jul 21. Annu Rev Cell Dev Biol. 2020. PMID: 32692592 Free PMC article. Review.
References
- Alber F, Dokudovskaya S, Veenhoff LM, Zhang W, Kipper J, Devos D, Suprapto A, Karni‐Schmidt O, Williams R, Chait BT, Sali A, Rout MP (2007) The molecular architecture of the nuclear pore complex. Nature 450: 695–701 - PubMed
- Amberg DC, Burke D, Strathern JN (2005) Methods in yeast genetics. Cold Spring Harbor, NY: CSHL Press;
- von Appen A, Kosinski J, Sparks L, Ori A, DiGuilio AL, Vollmer B, Mackmull M‐T, Banterle N, Parca L, Kastritis P, Buczak K, Mosalaganti S, Hagen W, Andrés‐Pons A, Lemke EA, Bork P, Antonin W, Glavy JS, Bui KH, Beck M (2015) In situ structural analysis of the human nuclear pore complex. Nature 526: 140–143 - PMC - PubMed
MeSH terms
Substances
LinkOut - more resources
Full Text Sources
Other Literature Sources
Molecular Biology Databases
Miscellaneous
