STAT2 Is a Pervasive Cytokine Regulator due to Its Inhibition of STAT1 in Multiple Signaling Pathways - PubMed (original) (raw)
STAT2 Is a Pervasive Cytokine Regulator due to Its Inhibition of STAT1 in Multiple Signaling Pathways
Johnathan Ho et al. PLoS Biol. 2016.
Abstract
STAT2 is the quintessential transcription factor for type 1 interferons (IFNs), where it functions as a heterodimer with STAT1. However, the human and murine STAT2-deficient phenotypes suggest important additional and currently unidentified type 1 IFN-independent activities. Here, we show that STAT2 constitutively bound to STAT1, but not STAT3, via a conserved interface. While this interaction was irrelevant for type 1 interferon signaling and STAT1 activation, it precluded the nuclear translocation specifically of STAT1 in response to IFN-γ, interleukin-6 (IL-6), and IL-27. This is explained by the dimerization between activated STAT1 and unphosphorylated STAT2, whereby the semiphosphorylated dimers adopted a conformation incapable of importin-α binding. This, in turn, substantially attenuated cardinal IFN-γ responses, including MHC expression, senescence, and antiparasitic immunity, and shifted the transcriptional output of IL-27 from STAT1 to STAT3. Our results uncover STAT2 as a pervasive cytokine regulator due to its inhibition of STAT1 in multiple signaling pathways and provide an understanding of the type 1 interferon-independent activities of this protein.
Conflict of interest statement
The authors have declared that no competing interests exist.
Figures
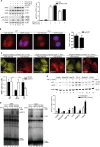
Fig 1. STAT2 binds STAT1 via high affinity N Domain interactions.
(A) Stat2-deficient human U6A cells (S2-/-) and parental 2fTGH cells (WT) were fixed and processed for immunostaining using STAT1 antibody, nuclear counterstaining was with DAPI. Shown are deconvolution fluorescence micrographs. The corresponding bar graphs show STAT1 cytoplasmic/nuclear signal ratios and standard deviation (s.d.) produced using line scanning to acquire mean fluorescence intensities (MeFIs) in cytoplasm and nucleus. Scale bar = 15 μm. (B) STAT1-CFP and STAT2-YFP variants were singly or coexpressed in HeLa cells and their localization was determined by deconvolution fluorescence microscopy. Bar graphs show cytoplasmic/nuclear signal ratios for STAT1 (black bars) and STAT2 (white bar) acquired as described in (A). Scale bar = 15 μm. (C) Equilibration sedimentation analyses of homo- and heterotypic associations of STAT1 and STAT2 recombinant N domains. Equilibrium dissociation constant (KD); (STAT2-mut) STAT2 LL81,82AA. See S1 Data for raw data.
Fig 2. STAT2 inhibits nuclear translocation and DNA-binding of IFN-γ-activated STAT1.
(A) Quantitative western blotting with extracts from HeLa cells expressing STAT2-YFP or empty vector (ctrl). The positions of latent (α) and activated (αp) STAT1 (S1) and STAT2 (S2) are indicated. Transfected (-YFP) and endogenous (-endog.) STAT2 are discriminated. kD, kilo Dalton. Bar graph shows mean and s.d. (B) STAT2-deficient human U6A cells (S2-/-) and parental 2fTGH cells (WT) were treated for 1 h with 1 U/ml IFN-γ, fixed and processed for immunostaining using anti-phospho-Y701 STAT1 antibody, nuclear counterstaining was with DAPI. Shown are deconvolution fluorescence micrographs. The corresponding bar graphs show activated STAT1 cytoplasmic/nuclear signal ratios and s.d. produced using line scanning to acquire MeFIs in cytoplasm and the nucleus. Scale bar = 15 μm. (C) as (B), with HeLa cells overexpressing WT STAT2-YFP or variants L82A and truncated STAT2 (ΔC) treated for 1 h with 50 U/ml IFN-γ. (*) denotes cell nuclei. Bar graphs show cytoplasmic/nuclear signal ratios and s.d. for phospho-Y701 STAT1 in the presence of the indicated STAT2 variants. Scale bar = 15 μm. (D) Electrophoretic mobility shift assays (EMSAs) with radiolabeled interferon-stimulated response element (ISRE) (left) and gamma interferon-activated site (GAS) (right) probes to detect ISGF3 and gamma interferon-activated factor (GAF), respectively, the positions of which and of the free probes are indicated. Extracts from parental (S2-/-) and stably STAT2-reconstituted (S2 WT or S2 L82A) human U6A cells were used. (E) Quantitative western blotting results with extracts from the indicated cell lines showing the positions of STAT1 splice variants (αS1α/β) and STAT2 (αS2). Bar graph shows mean and s.d. See S1 Data for raw data.
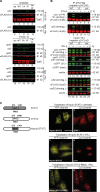
Fig 3. STAT2 inhibits specifically STAT1 in response to both IL-27 and IL-6.
(A) Western blot indicating the positions of latent (α) and activated (αp) STAT1α/β (S1α/β), STAT2 (S2), and STAT3 (S3). STAT2-YFP (S2-YFP) and its YFP-free degradation product (*) are discriminated. Treatment of cells was without or with IFN-γ, IL-27, or combined IL-6 and soluble IL-6 receptor (IL-6/IL-6R). (B) Deconvolution microscopy detecting activated STAT1 (anti-phospho-Y701 STAT1 antibody) and STAT3 (anti-phospho-Y705 STAT3 antibody) in STAT2-YFP-reconstituted U6A cells left untreated (top) or cotreated with IL-6/soluble IL-6 receptor (middle) or with IL-27 (bottom). (*) denotes cell nuclei. Scale bar = 15 μm.
Fig 4. Dimers between latent STAT2 and activated STAT1 adopt an antiparallel conformation incompatible with importin-mediated nuclear import.
(A, B) Immunoblots of precipitates (IP) and cell extracts (input) from immunoprecipitation experiments using anti-FLAG beads and HEK 293T cell extracts. Multicolor imaging results are shown, obtained by the concurrent application of up to three antibodies. (A) Cells were cotransfected with STAT2 and FLAG-tagged STAT1 variants (WT; F77A, FA; Y701F, YF; double mutant, FA-YF) or empty vector (ctrl) and left untreated (top) or treated with IFN-β (bottom). The positions of FLAG-tag (αFLAG) and latent (α) and activated (αp) STAT1 (S1) and STAT2 (S2) are indicated. (B) Cells were cotransfected with FLAG-tagged importin-α5 and YFP-tagged STAT1 (WT) or Y701F (YF) mutant or empty vector (ctrl) and treated without or with IFN-β. Labelling performed as in (A). Transfected (-YFP) and endogenous (-endog.) STATs are discriminated. Native YFP (free) and its STAT1 fusion (S1) were detected with anti-GFP antibody. (*) cross-reacting IgG. Note coprecipitation of the endogenous STAT1 in lanes 2, 4, and 6, i.e., with the IFN-β-treated extracts. (C) Schematic displaying STAT1, STAT2, and hybrid STAT2 structure accompanying widefield microscopy detecting the endogenous STAT1 (anti-STAT1 C terminus antibody decorated with Cy3) in cells expressing YFP-tagged hybrid STAT2. (*) denotes cell nucleus. Scale bar = 15 μm.
Fig 5. Role of IRF9 and STAT2:STAT1 heterodimerization for gene induction by IFN-γ and IFN-β.
(A-D) Gene expression results in response to IFN-γ. (A) STAT1-responsive (3xGAS) luciferase-reporter gene assay with YFP-tagged WT STAT2 (WT S2) or mutant L82A (L82A S2) or empty expression vector (ctrl). Bars show mean and standard error of the mean (s.e.m.) of six independent β-galactosidase-normalized experiments. (B-E) Quantitative RT-PCR analyses with immortalized mouse macrophages (B); parental (S2-/-) and stably STAT2-reconstituted (S2 WT or S2 L82A) human U6A cells (C); and IRF9-deficient U2A (IRF9-/-) and parental 2fTGH cells (WT) (D). Where indicated, cells were pretreated (primed) with IFN-γ (1 U/ml) for 48 h. (E) identical to (C) except that treatment was with IFN-β. * p < 0.05, ** p < 0.01 and *** p < 0.001. Bars show mean and s.d. of 2–3 independent experiments. See S1 Data for raw data.
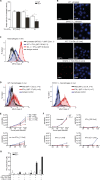
Fig 6. STAT2 modulates key IFN-γ effector functions.
(A) Viability of immortalized macrophages was measured by Alamar blue assay of mitochondrial function after 72 h in the presence of IFN-γ. (B) Widefield microscopy detecting HP1γ (anti-phospho-S83 HP1γ antibody) in immortalized macrophages before (top four panels) and after (bottom four panels) treatment with IFN-γ. Nuclei were DAPI stained. Scale bar = 15 μm. (C) Major histocompatibility complex (MHC) II expression on immortalized WT and STAT2-/- macrophages treated without or with 0.1 U/ml IFN-γ for 72 h was determined by fluorescence-assisted cell sorting (FACS) using Alexa Fluor 488-conjugated specific and isotype control antibodies. Gating for live cells was performed using forward and side scatter analysis, and the same gate was used for the histograms in (C) and (D). MFI, median fluorescence intensity. (D) Same as (C), but using peritoneal leukocytes from mice injected with PBS or IFN-γ. MHC class II expression (PerCP-conjugated antibody) was analyzed on macrophages detected by Alexa-Fluor 488-conjugated anti-F4/80 antibody. A representative histogram is shown and median PerCP fluorescence intensities ± s.d. per cohort (n = animal numbers) are given. (E) Peritoneal macrophages from PBS or IFN-γ-injected mice were cultured without (top) or with added IFN-γ (bottom) in duplicates, infected with Toxoplasma gondii, and extracellular parasites were counted at the indicated time points. Graphs combine the results from five control and eight experimental mice per genotype, bars show mean and s.d. (F) T. gondii release from infected immortalized macrophages treated with different IFN-γ concentrations. Results represent two independent experiments, bars show mean and s.d. (G) Nitric oxide (NO) production by immortalized macrophages determined using Griess reagent in triplicates after 36 h of the indicated treatments, bars show mean and s.d. See S1 Data for raw data.
Fig 7. STAT2 shifts the transcriptional output of IL-27 from STAT1 to STAT3.
(A, B) Gene expression analyses using quantitative reverse transcription polymerase chain reaction (qRT-PCR) with human U3A (S1-/-) cells and parental (S2-/-) and stably STAT2-reconstituted (S2 WT or S2 L82A) human U6A cells treated for 4 h with 100 ng/ml IL-27. * p < 0.05, bars show mean and s.d. of 2–3 independent experiments. See S1 Data for raw data.
Similar articles
- Heartland virus antagonizes type I and III interferon antiviral signaling by inhibiting phosphorylation and nuclear translocation of STAT2 and STAT1.
Feng K, Deng F, Hu Z, Wang H, Ning YJ. Feng K, et al. J Biol Chem. 2019 Jun 14;294(24):9503-9517. doi: 10.1074/jbc.RA118.006563. Epub 2019 Apr 30. J Biol Chem. 2019. PMID: 31040183 Free PMC article. - STAT1 N-terminal domain discriminatively controls type I and type II IFN signaling.
Göder A, Ginter T, Heinzel T, Stroh S, Fahrer J, Henke A, Krämer OH. Göder A, et al. Cytokine. 2021 Aug;144:155552. doi: 10.1016/j.cyto.2021.155552. Epub 2021 May 14. Cytokine. 2021. PMID: 34000478 - Type I interferon-regulated gene expression and signaling in murine mixed glial cells lacking signal transducers and activators of transcription 1 or 2 or interferon regulatory factor 9.
Li W, Hofer MJ, Songkhunawej P, Jung SR, Hancock D, Denyer G, Campbell IL. Li W, et al. J Biol Chem. 2017 Apr 7;292(14):5845-5859. doi: 10.1074/jbc.M116.756510. Epub 2017 Feb 17. J Biol Chem. 2017. PMID: 28213522 Free PMC article. - A Positive Feedback Amplifier Circuit That Regulates Interferon (IFN)-Stimulated Gene Expression and Controls Type I and Type II IFN Responses.
Michalska A, Blaszczyk K, Wesoly J, Bluyssen HAR. Michalska A, et al. Front Immunol. 2018 May 28;9:1135. doi: 10.3389/fimmu.2018.01135. eCollection 2018. Front Immunol. 2018. PMID: 29892288 Free PMC article. Review. - The role of signal transducer and activator of transcription-2 in the interferon response.
Steen HC, Gamero AM. Steen HC, et al. J Interferon Cytokine Res. 2012 Mar;32(3):103-10. doi: 10.1089/jir.2011.0099. Epub 2012 Jan 26. J Interferon Cytokine Res. 2012. PMID: 22280068 Free PMC article. Review.
Cited by
- IFNs Reset the Differential Capacity of Human Monocyte Subsets to Produce IL-12 in Response to Microbial Stimulation.
Muglia Amancio A, Mittereder L, Carletti A, Tosh KW, Green D, Antonelli LR, Gazzinelli RT, Sher A, Jankovic D. Muglia Amancio A, et al. J Immunol. 2021 Apr 1;206(7):1642-1652. doi: 10.4049/jimmunol.2001194. Epub 2021 Feb 24. J Immunol. 2021. PMID: 33627376 Free PMC article. - Downregulation of nuclear STAT2 protein in the spinal dorsal horn is involved in neuropathic pain following chronic constriction injury of the rat sciatic nerve.
Huang Z, Ding Z, Xu Y, Xi C, He L, Luo H, Guo Q, Huang C. Huang Z, et al. Front Pharmacol. 2023 Jan 18;14:1069331. doi: 10.3389/fphar.2023.1069331. eCollection 2023. Front Pharmacol. 2023. PMID: 36744245 Free PMC article. - Severe type I interferonopathy and unrestrained interferon signaling due to a homozygous germline mutation in STAT2.
Duncan CJA, Thompson BJ, Chen R, Rice GI, Gothe F, Young DF, Lovell SC, Shuttleworth VG, Brocklebank V, Corner B, Skelton AJ, Bondet V, Coxhead J, Duffy D, Fourrage C, Livingston JH, Pavaine J, Cheesman E, Bitetti S, Grainger A, Acres M, Innes BA, Mikulasova A, Sun R, Hussain R, Wright R, Wynn R, Zarhrate M, Zeef LAH, Wood K, Hughes SM, Harris CL, Engelhardt KR, Crow YJ, Randall RE, Kavanagh D, Hambleton S, Briggs TA. Duncan CJA, et al. Sci Immunol. 2019 Dec 13;4(42):eaav7501. doi: 10.1126/sciimmunol.aav7501. Sci Immunol. 2019. PMID: 31836668 Free PMC article. - Current prospects of type II interferon γ signaling and autoimmunity.
Green DS, Young HA, Valencia JC. Green DS, et al. J Biol Chem. 2017 Aug 25;292(34):13925-13933. doi: 10.1074/jbc.R116.774745. Epub 2017 Jun 26. J Biol Chem. 2017. PMID: 28652404 Free PMC article. Review.
References
MeSH terms
Substances
LinkOut - more resources
Full Text Sources
Other Literature Sources
Molecular Biology Databases
Research Materials
Miscellaneous


