Situating the default-mode network along a principal gradient of macroscale cortical organization - PubMed (original) (raw)
. 2016 Nov 1;113(44):12574-12579.
doi: 10.1073/pnas.1608282113. Epub 2016 Oct 18.
Satrajit S Ghosh 2 3, Alexandros Goulas 4, Marcel Falkiewicz 5, Julia M Huntenburg 5 6, Georg Langs 7 8, Gleb Bezgin 9, Simon B Eickhoff 10 11, F Xavier Castellanos 12 13, Michael Petrides 14, Elizabeth Jefferies 15 16, Jonathan Smallwood 15 16
Affiliations
- PMID: 27791099
- PMCID: PMC5098630
- DOI: 10.1073/pnas.1608282113
Situating the default-mode network along a principal gradient of macroscale cortical organization
Daniel S Margulies et al. Proc Natl Acad Sci U S A. 2016.
Abstract
Understanding how the structure of cognition arises from the topographical organization of the cortex is a primary goal in neuroscience. Previous work has described local functional gradients extending from perceptual and motor regions to cortical areas representing more abstract functions, but an overarching framework for the association between structure and function is still lacking. Here, we show that the principal gradient revealed by the decomposition of connectivity data in humans and the macaque monkey is anchored by, at one end, regions serving primary sensory/motor functions and at the other end, transmodal regions that, in humans, are known as the default-mode network (DMN). These DMN regions exhibit the greatest geodesic distance along the cortical surface-and are precisely equidistant-from primary sensory/motor morphological landmarks. The principal gradient also provides an organizing spatial framework for multiple large-scale networks and characterizes a spectrum from unimodal to heteromodal activity in a functional metaanalysis. Together, these observations provide a characterization of the topographical organization of cortex and indicate that the role of the DMN in cognition might arise from its position at one extreme of a hierarchy, allowing it to process transmodal information that is unrelated to immediate sensory input.
Keywords: connectivity; cortical organization; default-mode network; gradients; topography.
Conflict of interest statement
The authors declare no conflict of interest.
Figures
Fig. 1.
The principal gradient of connectivity in both the (A) human and (B) macaque monkey cortices shows a spectrum between unimodal regions (dark blue) and transmodal regions (sienna), which in the human cortex, peaks in regions corresponding to the DMN. The proximity of colors can be interpreted as greater similarity of connectivity patterns. (C) The illustration of connectivity organization suggested by Mesulam (23) proposes a hierarchy of processing from distinct unimodal areas to integrative transmodal areas. Labels Gradient 1 and Gradient 2, which were not included in the original figure, correspond to the results in D. Modified from ref. . (D) A scatter plot of the first two connectivity embedding gradients. Gradient 1 extends between primary sensorimotor and transmodal regions (red). Gradient 2 separates somatomotor and auditory cortex (green) from visual cortex (blue). Histograms depicting the distribution of values are presented on the respective axes. (E) Colors from the scatter plot are presented on the cortical surface for anatomical orientation. A1, primary auditory; ag, angular gyrus; cing, anterior cingulate cortex; ifg, inferior frontal gyrus; infs, intermediate frontal sulcus; L, limbic; M1, primary motor; mfg, middle frontal gyrus; mtc, middle temporal cortex; P, parietal; Pf, prefrontal; phf, parahippocampal formation; pmc, posteromedial cortex; ps, principal sulcus; S1, primary somatosensory; sfg, superior frontal gyrus; V1, primary visual; vmpfc, ventromedial prefrontal cortex.
Fig. S1.
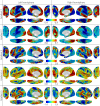
Human connectivity gradients 1–5. The first five components result from diffusion embedding of the human connectivity matrix. The first five are shown because of the drop in variance explained after the fifth component (Fig. S2).
Fig. S2.
The λ values of the diffusion embedding components in humans. The λ values of the first 300 components in the human connectivity data (Left) and cumulative λ values (Right). The gap after the first component indicates that the sorting of the principal gradient is stable.
Fig. 2.
(A) The minimum geodesic distance (in millimeters) from each point on the cortical surface to seven seed nodes located in the positive peaks of the principal gradient. Morphological landmarks of primary areas denoted by white dotted lines, such as the central sulcus (cs; somatosensory/motor), calcarine sulcus (cals; visual), and transverse temporal gyrus (tt; auditory), are equidistant from the surrounding DMN peaks (illustrated by arrows). Gray lines mark the calculated equidistant line. (B) The contour scatter plot shows the negative relationship between geodesic distance from seven positive peak locations and the principal gradient (R2 = 0.55).
Fig. S3.
Geodesic distance along the macaque monkey cortical surface from transmodal peak areas. The minimum geodesic distance along the cortical surface (Left) from the top five regions of the principal gradient (Center) (Fig. 1_B_). The scatter plot (Right) depicts the average geodesic within each region with respect to the principal gradient. Cortical areas are labeled using the Bonin–Bailey parcellation (77, 78).
Fig. 3.
(A) The principal gradient values from each of seven networks (2) are presented as (B) box plots ordered by the mean value. (C) Illustrative cutouts taken from A to show the repeated patterns of network spatial adjacency captured by the principal gradient. Arrows in A indicate the corresponding orientation of the cutouts. (D) A schematic of the spatial relationships of canonical resting-state networks (2) applying the schema suggested in ref. presented in Fig. 1_C_. dmn, default-mode network; dorsal attn, dorsal attention network; sal, salience network; somato/mot, somatosensory/motor network.
Fig. S4.
Distribution of the principal gradient across 17-network parcellation from ref. . Each boxplot presents the principal gradient values within the respective network of interest. The network parcellation includes the 17 networks from ref. .
Fig. S5.
Principal gradient outliers are proximate to the boundaries between networks. The standard deviation (SD) values of principal gradient values are calculated for each node with respect to other values within the same network [seven networks (2)]. SD values greater than 1.0 are presented. Outliers predominantly neighbor the network boundaries (black lines), indicating that the principal gradient captures gradual transitions between network-level connectivity patterns.
Fig. 4.
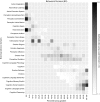
NeuroSynth metaanalysis of regions of interest along the principal gradient using 24 topic terms. Terms are ordered by the weighted mean of their location along the gradient. Sensory processing terms are located at the top followed by domain-general cognitive functions and then, higher-order abstract cognitive and memory-related processes. Similar results using the BrainMap database are available in SI Materials and Methods. autobiographical mem., autobiographical memory; multisensory proc., multisensory processing.
Fig. S6.
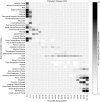
BrainMap behavioral domains. Metaanalysis of the BrainMap behavioral domains with respect to the principal gradient.
Fig. S7.
BrainMap paradigm classes. Metaanalysis of the BrainMap paradigm classes with respect to the principal gradient.
Comment in
- Gradients of Connectivity in the Cerebral Cortex.
Krienen FM, Sherwood CC. Krienen FM, et al. Trends Cogn Sci. 2017 Feb;21(2):61-63. doi: 10.1016/j.tics.2016.12.002. Epub 2016 Dec 20. Trends Cogn Sci. 2017. PMID: 28007482
Similar articles
- The role of default mode network in semantic cue integration.
Lanzoni L, Ravasio D, Thompson H, Vatansever D, Margulies D, Smallwood J, Jefferies E. Lanzoni L, et al. Neuroimage. 2020 Oct 1;219:117019. doi: 10.1016/j.neuroimage.2020.117019. Epub 2020 Jun 6. Neuroimage. 2020. PMID: 32522664 Free PMC article. - Compressed sensorimotor-to-transmodal hierarchical organization in schizophrenia.
Dong D, Yao D, Wang Y, Hong SJ, Genon S, Xin F, Jung K, He H, Chang X, Duan M, Bernhardt BC, Margulies DS, Sepulcre J, Eickhoff SB, Luo C. Dong D, et al. Psychol Med. 2023 Feb;53(3):771-784. doi: 10.1017/S0033291721002129. Epub 2021 Jun 8. Psychol Med. 2023. PMID: 34100349 - Flexing the principal gradient of the cerebral cortex to suit changing semantic task demands.
Gao Z, Zheng L, Krieger-Redwood K, Halai A, Margulies DS, Smallwood J, Jefferies E. Gao Z, et al. Elife. 2022 Sep 28;11:e80368. doi: 10.7554/eLife.80368. Elife. 2022. PMID: 36169281 Free PMC article. - From sensation to cognition.
Mesulam MM. Mesulam MM. Brain. 1998 Jun;121 ( Pt 6):1013-52. doi: 10.1093/brain/121.6.1013. Brain. 1998. PMID: 9648540 Review. - Cortical chemoarchitecture shapes macroscale effective functional connectivity patterns in macaque cerebral cortex.
Turk E, Scholtens LH, van den Heuvel MP. Turk E, et al. Hum Brain Mapp. 2016 May;37(5):1856-65. doi: 10.1002/hbm.23141. Epub 2016 Mar 11. Hum Brain Mapp. 2016. PMID: 26970255 Free PMC article. Review.
Cited by
- Coordinated cortical thickness alterations across six neurodevelopmental and psychiatric disorders.
Hettwer MD, Larivière S, Park BY, van den Heuvel OA, Schmaal L, Andreassen OA, Ching CRK, Hoogman M, Buitelaar J, van Rooij D, Veltman DJ, Stein DJ, Franke B, van Erp TGM; ENIGMA ADHD Working Group; ENIGMA Autism Working Group; ENIGMA Bipolar Disorder Working Group; ENIGMA Major Depression Working Group; ENIGMA OCD Working Group; ENIGMA Schizophrenia Working Group; Jahanshad N, Thompson PM, Thomopoulos SI, Bethlehem RAI, Bernhardt BC, Eickhoff SB, Valk SL. Hettwer MD, et al. Nat Commun. 2022 Nov 11;13(1):6851. doi: 10.1038/s41467-022-34367-6. Nat Commun. 2022. PMID: 36369423 Free PMC article. - Antagonistic behavior of brain networks mediated by low-frequency oscillations: electrophysiological dynamics during internal-external attention switching.
Hammer J, Kajsova M, Kalina A, Krysl D, Fabera P, Kudr M, Jezdik P, Janca R, Krsek P, Marusic P. Hammer J, et al. Commun Biol. 2024 Sep 9;7(1):1105. doi: 10.1038/s42003-024-06732-2. Commun Biol. 2024. PMID: 39251869 Free PMC article. - Processing of social closeness in the human brain.
Roseman-Shalem M, Dunbar RIM, Arzy S. Roseman-Shalem M, et al. Commun Biol. 2024 Oct 10;7(1):1293. doi: 10.1038/s42003-024-06934-8. Commun Biol. 2024. PMID: 39390210 Free PMC article. - Neural Geometrodynamics, Complexity, and Plasticity: A Psychedelics Perspective.
Ruffini G, Lopez-Sola E, Vohryzek J, Sanchez-Todo R. Ruffini G, et al. Entropy (Basel). 2024 Jan 22;26(1):0. doi: 10.3390/e26010090. Entropy (Basel). 2024. PMID: 38275498 Free PMC article. - A Nexus Model of Restricted Interests in Autism Spectrum Disorder.
Carter RM, Jung H, Reaven J, Blakeley-Smith A, Dichter GS. Carter RM, et al. Front Hum Neurosci. 2020 Jun 3;14:212. doi: 10.3389/fnhum.2020.00212. eCollection 2020. Front Hum Neurosci. 2020. PMID: 32581753 Free PMC article.
References
Publication types
MeSH terms
Grants and funding
- 283530/ERC_/European Research Council/International
- U01 MH108168/MH/NIMH NIH HHS/United States
- FDN-143212/CIHR/Canada
- R01 EB020740/EB/NIBIB NIH HHS/United States
- R01 MH092380/MH/NIMH NIH HHS/United States
- P41 EB015902/EB/NIBIB NIH HHS/United States
- R01 MH074457/MH/NIMH NIH HHS/United States
- R01 NS086905/NS/NINDS NIH HHS/United States
- P41 EB019936/EB/NIBIB NIH HHS/United States
- U54 MH091657/MH/NIMH NIH HHS/United States
- BB/J006963/1/BB_/Biotechnology and Biological Sciences Research Council/United Kingdom
LinkOut - more resources
Full Text Sources
Other Literature Sources


