Single-cell RNA-seq supports a developmental hierarchy in human oligodendroglioma - PubMed (original) (raw)
. 2016 Nov 10;539(7628):309-313.
doi: 10.1038/nature20123. Epub 2016 Nov 2.
Andrew S Venteicher 1 2 3, Christine Hebert 1 2, Leah E Escalante 1 2, Anoop P Patel 3, Keren Yizhak 1 2, Jonathan M Fisher 1, Christopher Rodman 1, Christopher Mount 4, Mariella G Filbin 1 2 5, Cyril Neftel 1 2, Niyati Desai 2, Jackson Nyman 1, Benjamin Izar 1, Christina C Luo 2, Joshua M Francis 1 6, Aanand A Patel 2, Maristela L Onozato 2, Nicolo Riggi 2, Kenneth J Livak 1, Dave Gennert 1, Rahul Satija 1, Brian V Nahed 3, William T Curry 3, Robert L Martuza 3, Ravindra Mylvaganam 2, A John Iafrate 2, Matthew P Frosch 2, Todd R Golub 1 5 7, Miguel N Rivera 1 2, Gad Getz 1 2, Orit Rozenblatt-Rosen 1, Daniel P Cahill 3, Michelle Monje 4, Bradley E Bernstein 1 2, David N Louis 2, Aviv Regev 1 7, Mario L Suvà 1 2
Affiliations
- PMID: 27806376
- PMCID: PMC5465819
- DOI: 10.1038/nature20123
Single-cell RNA-seq supports a developmental hierarchy in human oligodendroglioma
Itay Tirosh et al. Nature. 2016.
Abstract
Although human tumours are shaped by the genetic evolution of cancer cells, evidence also suggests that they display hierarchies related to developmental pathways and epigenetic programs in which cancer stem cells (CSCs) can drive tumour growth and give rise to differentiated progeny. Yet, unbiased evidence for CSCs in solid human malignancies remains elusive. Here we profile 4,347 single cells from six IDH1 or IDH2 mutant human oligodendrogliomas by RNA sequencing (RNA-seq) and reconstruct their developmental programs from genome-wide expression signatures. We infer that most cancer cells are differentiated along two specialized glial programs, whereas a rare subpopulation of cells is undifferentiated and associated with a neural stem cell expression program. Cells with expression signatures for proliferation are highly enriched in this rare subpopulation, consistent with a model in which CSCs are primarily responsible for fuelling the growth of oligodendroglioma in humans. Analysis of copy number variation (CNV) shows that distinct CNV sub-clones within tumours display similar cellular hierarchies, suggesting that the architecture of oligodendroglioma is primarily dictated by developmental programs. Subclonal point mutation analysis supports a similar model, although a full phylogenetic tree would be required to definitively determine the effect of genetic evolution on the inferred hierarchies. Our single-cell analyses provide insight into the cellular architecture of oligodendrogliomas at single-cell resolution and support the cancer stem cell model, with substantial implications for disease management.
Figures
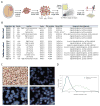
Extended Data Figure 1. Single-cell RNA-seq analysis of human oligodendroglioma samples
a, Experimental workflow. b, Clinical information of the main and validation patient cohorts analysed in this study. Asterisk indicates a borderline result of chromosome 1p loss based on clinical testing. c, ISH (top left) and FISH (all other panels) in a representative tumour (MGH36). All our cases retain ATRX protein expression by ISH (top left) and show loss of chromosomes arms 1p (bottom left) and 19q (top right) by FISH. In addition, tumour-specific CNVs identified by single-cell RNA-seq were confirmed by FISH (for example, loss of chromosome 4 in MGH36, bottom right panel). d, Distributions of the total number of sequenced paired-end reads per cell (grey) and of paired-end reads that were mapped to the transcriptome and used to quantify gene expression (black).
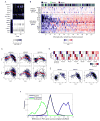
Extended Data Figure 2. Diversity of expression programs in oligodendroglioma
a, Two populations of non-cancer cells identified in oligodendroglioma. Selected genes that are differentially expressed among the two populations of non-cancer cells that lack CNVs (Fig. 1b, top), including markers of microglia (top) and oligodendrocytes (bottom). b, Expression programs in microglia cells from three tumours. The heat map shows relative expression of genes (rows) across microglia cells (columns). Above the dashed line are microglia markers expressed in all microglia cells and below the line are the genes of a microglia activation program, which is variably expressed, and includes cytokines, chemokines, early response genes and other immune effectors. This latter gene set might reflect a microglia activation program that could either be a general microglia program or potentially specific to the context of oligodendroglioma. Microglia cells (n = 235) (columns) are rank ordered by their relative expression of the activation program. The tumour of origin of each cell is colour-coded as indicated in the top row. c, PC2 and PC3 are associated with intermediate values of PC1. PC1 scores are shown along with PC2 (top) and PC3 (bottom) scores for cells in each of the three tumours profiled at high depth. The red line indicates local weighted regression (LOWESS) with a span of 5%, which demonstrates that PC2 and PC3 values tend to be highest in intermediate values of PC1 and to decrease in either high PC1 (that is, oligodendrocyte-like cells) or low PC1 (that is, astrocyte-like cells). d, Consistency of PCA across tumours. Shown are the Pearson correlations in gene loadings (over all analysed genes) between the top three PCs in PCA of the three tumours profiled at high depth (y axis, as shown in Fig. 1) and the top four PCs in alternative PCA of either all six tumours (left), as well as of PCA of each individual tumour (right). PC1–3 are highly consistent between the three-tumour and six-tumour PCAs (R > 0.9); PC1 is highly consistent (R > 0.8) between the three-tumour analysis and all other analysis. e, PC1 (x axis) and PC2 plus PC3 (y axis) scores of malignant cells from each of the three tumours profiled at intermediate depth, showing consistent patterns with those shown in Fig. 1d. f, Distribution of differences in PC1 loadings between the original PCA and the shuffled PCA (see description in the Methods section for principal component analysis) for all genes (black), oligodendrocyte-like (OC-like) genes (blue) and astrocyte-like (AC-like) genes (green). This analysis demonstrates that oligodendrocyte-like and astrocyte-like gene sets are highly skewed in the original PCA and their loadings are not recapitulated by shuffled data reflecting the effect of complexity.
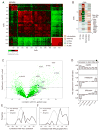
Extended Data Figure 3. The stemness program in oligodendroglioma
a, Cell–cell correlation matrix based on all analysed genes across all malignant cells in MGH54 (n = 1,174). Cells are ordered by average linkage hierarchical clustering, and coloured boxes indicate distinct clusters. Clusters are marked based on the identity of differentially expressed genes as OC-like (blue), AC-like (yellow), cycling (pink) stem-like (purple) and intermediate cells that do not score highly for any of those expression programs (orange). b, Most differentially expressed genes. Shown is the average expression in each of the OC-like, AC-like, stem-like and intermediate cell clusters (columns) of differentially expressed genes (rows) defined by comparing cells from each of the OC-like, AC-like and stem-like clusters to cells from the remaining clusters with a _t_-test. Similar genes are highlighted as in Fig. 1 (OC-like: OMG, OLIG1, OLIG2, SOX8; AC-like: ALDOC, APOE, SOX9; Stem-like: SOX4, SOX11, CCND2, SOX2). Stem-like genes also include _CTNNB_1, USP22, and MSI1. c, Overlap with human GBM stemness program. We previously identified a GBM stemness program and determined the association of each gene with that program by the correlation between the expression of that gene and the average expression of the stemness program’s genes across individual cells (‘CSC gradient’) in each of five GBM tumours. Shown is the average correlation (x axis) of each analysed gene (green dots) across the five cases and the P values of those correlations as determined with a _t_-test (y axis). Genes identified in the oligodendroglioma stemness program (this work) are marked in black and are significantly enriched for the GBM stemness genes (1.5 × 10⁻⁴, hypergeometric test), defined as those with P < 0.05 and an average correlation above 0.1. d, Preferential expression of the oligodendroglioma stemness program in neurons but not in OPCs. Genes expressed in the oligodendroglioma single cells were divided into six bins (bars) based on their relative expression (log2-ratio) in stem-like cells with high PC2/3 and intermediate PC1 scores compared to all other cells. Each panel shows for each bin the average relative expression in each of three normal brain cell types (y axis) based on data from the Barres laboratory RNA-seq database,: mice oligodendrocyte progenitor cells (mOPC, top), mouse neurons (mNeurons, middle), and human neurons (hNeurons, bottom). Relative expression of each gene in each cell type was defined as the log2-ratio between the respective cell type divided by the average over AC, OC and neurons. Error bars denote standard error as defined by bootstrapping. Asterisks denote bins with significantly different relative expression (in the respective normal cell type) compared to all genes expressed in oligodendroglioma, based on P < 0.001 (by _t_-test) and average expression change of at least 30%. e, Correlation with mouse activated NSC program. Shown is the distribution of correlation values (x axis) of either all genes (grey) or genes from the oligodendroglioma stemness program (black) with the expression program of mice NSC activation states, as previously quantified by ‘pseudotime’, across single mouse NSCs. The average correlation of the NSC activation program genes with oligodendroglioma stemness genes is significantly higher than with all other genes (P = 3 × 10⁻⁶; _t_-test). f, Correlation with human NPC program. Shown is the distribution of correlation values (x axis) of either all genes (grey) or genes from the oligodendroglioma stemness program (black) with an expression program of human NPCs identified by PCA (Extended Data Fig. 4). Each gene’s correlation to the average expression of the NPC program genes was calculated across single human NPCs. The average correlation with oligodendroglioma stemness genes is significantly higher than with all other genes (P = 2 × 10⁻³⁵, _t_-test).
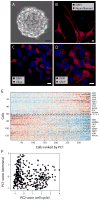
Extended Data Figure 4. Analysis of human NPCs
a–d, Differentiation potential of human SVZ NPCs. Human SVZ NPCs isolated from 19-week-old fetuses form neurospheres in culture (a), and can be differentiated to neuronal (neurofilament, b), oligodendrocytic (OLIG2, c), or astrocytic (GFAP, d) lineages in vitro. Scale bars, 25 μm (a), 10 μm (b–d). We note that although OLIG2 can represent different cell types, it is expressed at a low level in the fetal NPCs before differentiation (an average log2(TPM + 1) of 0.82, compared to a threshold of 4 that we use to define expressed genes in our analysis, and with zero cells with expression above this threshold). Thus, the undifferentiated NPCs do not express OLIG2, and we interpret the expression of OLIG2 as a sign of oligodendroglial lineage differentiation. e, f, Single-cell RNA-seq analysis of NPCs. e, NPCs have an expression program similar to the oligodendroglioma stemness program. Heat map shows the expression of genes (rows) most positively (top) or negatively (bottom) correlated with PC1 of a PCA of RNA-seq profiles for 431 single NPCs, across NPC cells (columns) rank ordered by their PC1 scores. Selected genes are indicated, and a full list of correlated genes for PC1 and PC2 is given in Supplementary Table 2. f, NPC cell scores for PC1 (y axis) and PC2 (x axis). PC2 correlated genes are associated with the cell cycle. Cells with the highest PC1 scores tend to be non-cycling (low PC2 score), indicating that while the stemness program is coupled to the cell cycle in oligodendroglioma, it is decoupled from the cell cycle in NPCs.
Extended Data Figure 5. Developmental hierarchy in oligodendroglioma
a, Shown are plots as in Fig. 2d for each of the six tumours with cycling cells coloured as in Fig. 3. b, Lineage and stemness scores for three tumours with high-depth profiling, coloured based on sequencing batches, demonstrating the lack of considerable batch effects. c, For each of the three tumours profiled at high depth (horizontal panels) and for the two lineages (vertical panels), we calculated the significance of co-expression among sets of AC-related (top panels) or OC-related (bottom panels) genes within limited ranges of lineage scores (between the value of the x axis and that of the y axis). Significance was calculated by comparison of average co-expression to that of 100,000 control gene-sets with similar number of genes and distribution of average expression levels, and is indicated by colour. The significant co-expression patterns within limited ranges of lineage scores suggest that variability of lineage scores in these ranges cannot be driven by noise alone, and implies the existence of multiple states within each lineage, presumably reflecting intermediate differentiation states (see Supplementary Note 2). d, Characterization of tumour subpopulations by histopathology and tissue staining. Top/middle panels denote two predominant lineages of AC-like and OC-like cells. Shown are MGH53 with haematoxylin and eosin (H&E, top left), immunohistochemistry for OLIG2 (oligodendrocyte marker, top right) and GFAP (astrocyte marker, middle left), as well as in situ RNA hybridization for astrocytic markers ApoE (apolipoprotein E, astrocytic lineage, middle right), with patterns similar to GFAP immunohistochemistry. Bottom panels denote stem-like cells and association with cell cycle. In situ RNA hybridization for the stem/progenitor markers SOX4 and CCND2 (bottom left) and the proliferation marker Ki-67 (bottom right) in MGH36 identifies cells positive for both markers (arrows). Immunohistochemistry for GFAP (arrowhead, bottom right) and Ki-67 (arrow, bottom right) shows mutually exclusive expression patterns. e, Consistency of MGH60 hierarchy between the full-length SMART-Seq2 protocol used throughout this work (left panels), and an alternative protocol (right panels) in which only the 5′-ends of transcripts are analysed while incorporating random molecular tags (RMTs, also known us unique molecular identifiers, or UMIs) that decrease the biases of PCR amplification. Top panels: PC1 reflects an AC-like and OC-like distinction. Shown are heatmaps of the AC-like and OC-like specific genes (rows, as defined in Supplementary Table 1 and restricted to genes with average expression log2(TPM + 1) > 4 in each data set) with cells ordered by their PC1 score. Bottom, lineage (x axis) and stemness (y axis) scores (defined as in Fig. 2d).
Extended Data Figure 6. Cell-cycle analysis
a, High expression of G1/S and G2/M gene sets in a subset of cycling cells. Shown are the average expression (top panels, lines) or the expression of all individual genes (bottom, heat maps) of the G1/S and G2/M gene sets, in all cells (n = 2,594) (left) or only among the putative cycling cells (n = 119) (right) from the three tumours profiled at high-depth ordered by cell cycle expression. Dashed lines (top right) separates the four inferred phases of cycling cells, corresponding to light blue, blue, green and red in Fig. 3a, respectively. b, Estimated fraction of cycling cells (y axis) in each of 3 tumours (x axis) based on single cell RNA-seq (left; different phases marked by colour code as in Fig. 3a) or Ki-67 immunohistochemistry (right). c, Variation in cycling cells between regions of the same tumour. Shown is Ki-67 immunohistochemistry in two regions in MGH36. Such regional variability in proliferation complicates direct comparisons as done in b. d, Cycling cells are enriched in stem-like and undifferentiated cells compared to differentiated cells. Shown is the percentage of cycling cells (y axis) in four bins based on stemness scores (top) or lineage scores (bottom). Black squares and error-bars correspond to the mean and standard deviation of the percentages in the three tumours profiled at high depth (MGH36, MGH53, MGH54), and red circles denote the percentages in individual tumours. Bins in left panel were defined as stemness scores below − 1.5 (n = 711), between − 1.5 and 0.5 (n = 1,100), between − 0.5 and 0.5 (n = 939), and above 0.5 (n = 274), respectively. The first two bins are significantly depleted with cycling cells, while the last two bins are significantly enriched (P < 0.05, hypergeometric test). Bins in left panel were defined as AC score above 1 (n = 503), AC score between 0.5 and 1 (n = 1,013), AC and OC scores below 0.5 (n = 1,130), OC score between 0.5 and 1 (n = 855), and OC score above 1 (n = 597), respectively. The third bin is significantly enriched with cycling cells, while the four other bins are significantly depleted (P < 0.05, hypergeometric test). e, Correlation between the average expression of cell cycle (y axis) and that of stemness genes (x axis) across molecularly defined oligodendrogliomas (by IDH mutation, chromosome 1p and 19q co-deletion, and absence of P53 and ATRX mutations) profiled by TCGA (n = 69) with bulk RNA-seq. Average expression was defined by centring the log2-transformed RSEM gene quantifications. Also shown are the linear least-square regression and Pearson correlation coefficient. f, Specific enrichment of S/G2/M cells compared to G1 cells among stem-like or undifferentiated cells. Shown is the proportion (y axis) of each marked category of cells among the stem-like or undifferentiated subpopulations. Significant enrichments are marked (P < 0.01, hypergeometric test).
Extended Data Figure 7. CCND2 is associated with both cycling and non-cycling stem/progenitor cells
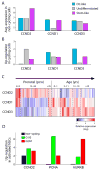
a, CCND2, but not CCND1 or _CCND_3, is upregulated in non-cycling stem-like oligodendroglioma cells. Shown are the average expression levels (y axis, log-scale) of three cyclin D genes (x axis) in non-cycling cells classified as OC-like cells (light blue), undifferentiated cells (grey) and stem-like cells (purple). CCND2 is approximately fourfold higher in stem-like non-cycling cells than in OC-like and undifferentiated cells (P < 0.001 by permutation test). Conversely, CCND1 and CCND3 are expressed at comparable levels in stem-like and OC-like cells. b, Upregulation of cyclin D genes in cycling cells compared to non-cycling cells. As in a but for up regulation (log2-ratio) in cycling cells vs. non-cycling cells. CCND2 levels further increase in cycling undifferentiated and stem-like cells but not in OC-like cells, whereas CCND1 and CCND3 levels increase in OC-like cycling cells more than in undifferentiated and stem-like cycling cells. c, Distinct expression patterns of cyclin D genes in human brain development. Shown are the expression patterns of three cyclin D genes (rows) in human brain samples at different points in pre- and post-natal development, sorted by age (columns) from the Allen Brain Atlas. CCND2 is associated with prenatal samples, whereas CCND1 and CCND3 are expressed mostly in childhood and adult samples. d, CCND2 is upregulated in activated versus quiescent NSCs, both among cycling and non-cycling cells. Activated NSCs were partitioned into non-cycling cells (black) and cycling cells in the G1/S (green) or G2/M (red) phases (Methods). Expression difference (y axis) for each of three genes (x axis) was quantified for each of these subsets as the log2-ratio of the average expression in the respective subset versus the quiescent NSCs, and was significant for each of the three subsets (P < 0.05 by permutation test). Although CCND2 (left) is induced in both cycling and non-cycling activated NSCs, two canonical cell cycle genes (PCNA, middle; and AURKB, right) are not induced in non-cycling genes but were induced preferentially in G1/S and G2/M cells, respectively.
Extended Data Figure 8. Distribution of cellular states in distinct genetic clones of MGH36 and MGH97
a, Stemness (y axis) and lineage (x axis) score plots for MGH36 (top) and MGH97 (bottom), each separated into clone 1 (left) and clone 2 (right) as determined by CNV analysis (Fig. 1a, b). Cycling cells are coloured as in Fig. 3, with G1/S cells in blue, S/G2 cells in green, and G2/M cells in red. b, Colour-coded density of cells across the cellular hierarchy as shown in Fig. 2e, for the two clones (left: clone 1, right: clone 2) in each of the two tumours (top: MGH36, bottom: MGH97). c, The fraction of cells assigned to the different tumour compartments (y axis, Methods) based on either single-cell RNA-seq (blue) or RNA in situ hybridization (orange). Circles denote individual tumours; squares denote average of all tumours; error bars denote standard deviation across tumours, showing general agreement between scRNA-Seq and IHC estimates.
Extended Data Figure 9. Subclonal mutations tend to span the cellular hierarchy
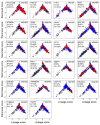
Each panel shows lineage (x axis) and stemness (y axis) scores of cells in which we ascertained by single cell RNA-seq a mutant (red), a wild-type (blue) or none (black) of the alleles. Included are mutations for which at least three cells were identified as mutants and that were identified by WES as subclonal (fraction < 60%). The gene names, tumour name, ABSOLUTE-derived fraction of mutant cells (E, expected fraction) and the fraction of cells detected as mutant by RNA-seq (O, observed) are also indicated within each panel. We note that identification of a wild-type allele (blue) does not imply a wild-type cell because mutations may be heterozygous, and thus cells could contain both alleles while only one may be detected by single-cell RNA-seq. The observed fraction of mutations (O) is much lower than expected (E) due to limited coverage of the single-cell RNA-seq data, as well as due to heterozygosity. The vast majority of mutations (20 of 22) are distributed across the hierarchy and span multiple compartments. Two remaining mutations (H2AFV and EIF2AK2) appear more restricted to the ‘undifferentiated’ region (intermediate lineage and stemness scores), which could reflect our limited detection rate of mutant cells and/or a bias of the mutation to a particular region. To test the significance of potential biases in the distribution of mutations we calculated, for each mutation, a Euclidean distance among all pairs of mutant cells (based on their lineage and stemness scores), and compared the average pairwise distances among mutant cells to that among randomly selected subsets of the same number of cells. None of the mutations were significant with a false discovery rate (FDR) of 0.1, although this could reflect our limited statistical power and we cannot exclude a potential bias. The apparent bias of mutant cells to the OC lineage over the AC lineage (that is, positive versus negative lineage scores) reflects the lower frequencies of AC-like cells compared to OC-like cells in MGH53 and MGH54 (MGH53: 17% AC versus 39% OC; MGH54: 23% AC vs. 45% OC); this bias is also observed for the detection of wild-type alleles (blue) demonstrating that there is no bias against mutation detection in the AC lineage.
Extended Data Figure 10. Loss-of-heterozygosity event in MGH54 reveals two clones that span the cellular hierarchy
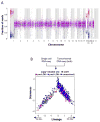
a, Chromosome 18 loss of heterozygosity (LOH) in MGH54. Allelic fraction analysis of MGH54 SNPs from WES shows an imbalance (red and blue dots) in the frequency of alternative alleles in chromosome 1p, 19q, as well as chromosome 18, despite the normal copy number at this chromosome (Fig. 1a). This is consistent with an LOH event in which presumably one copy of chromosome 18 was deleted, and the other copy amplified. The weaker imbalance compared to chromosomes 1p and 19q further suggests that this is a subclonal event. b, Each of two clones defined by chromosome 18 LOH status spans the full hierarchy. Shown are the lineage (x axis) and stemness (y axis) scores for each cell from MGH54 (n = 1,174) classified as pre-LOH (red), post-LOH (blue) and unresolved (black) based on RNA-seq reads that map to SNPs in the minor (that is, deleted) chromosome. Both the pre- and post-LOH clones span the different tumour subpopulations. Pre-LOH cells were defined as all cells with reads that map to minor alleles in chromosome 18; post-LOH cells were defined as all cells with reads that map to at least five different major alleles, but no reads that map to minor alleles in chromosome 18; all other cells were defined as unresolved.
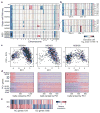
Figure 1. Single-cell RNA-seq of cancer and non-cancer cells in six oligodendrogliomas
a, CNV profiles inferred from scRNA-seq (top) and DNA whole-exome sequencing (WES) (bottom) of oligodendrogliomas. Cells (rows, n = 4,347) are ordered from non-tumoural cells (NT, n = 303) to cancer cells (n = 4,044), ordered into six oligodendrogliomas. b, In MGH36 and MGH97, cells are ordered by CNVs, with zoomed in view shown. c, PCA of malignant cells. Shown are PC1 (x axis) versus PC2 and PC3 (y axis) scores of cells from three tumours based on a single combined PCA. d, Astrocyte-like and oligodendrocyte-like signatures. Relative expression of genes correlated most positively (bottom) or negatively (top) with PC1, in cancer cells from each of the three tumours (marked as in c), ranked by PC1 scores. Selected astrocyte (AC) and oligodendrocyte (OC) marker genes are highlighted. e, Relative expression of the mice orthologues of the genes shown in d (log2-ratio of the respective cell type compared to the average of oligodendrocyte, astrocyte, OPC and neurons).
Figure 2. Stemness expression program and a developmental hierarchy in oligodendroglioma
a, Average relative expression of genes most highly correlated with PC2 and PC3 (top), and selected astrocyte and oligodendrocyte genes (bottom), in stem-like cells, undifferentiated cells, oligodendrocyte-like and astrocyte-like cells (Methods). Genes were sorted by relative expression in stem-like cells. b, Stemness genes are preferentially expressed in early human brain development. Relative expression of PC2 and PC3 putative stemness genes (top) and oligodendrocyte and astrocyte marker genes (bottom) across 524 human brain samples (Allen Brain Atlas). Samples are ordered in columns by age, from prenatal (left) to adult (right). c, The stemness program is correlated to mouse activated NSC and human NPCs. Pearson correlation coefficients between the expression of PC2 and PC3 genes (rows) and expression programs of mouse NSC activation (left) and human NPCs (right) across single cells from the respective datasets (Extended Data Figs 3e, f and 4). d, Inferred developmental hierarchy in oligodendroglioma cells (n = 4,044). Lineage and stemness scores (Methods) of malignant cells from the six tumours. Grey lines indicate the ‘backbone’ used in e and Extended Data Fig. 8b. e, Colour-coded density of cells (fraction of cells within a Euclidean distance of 0.3) from each tumour across the backbone of the hierarchy.
Figure 3. Cycling cells are enriched among oligodendroglioma stem/progenitor cells
a, Classification of cells (n = 4,044) to non-cycling (black) and categories of cycling cells (colour-coded by approximated phase as per inset) based on the relative expression of gene-sets associated with G1/S (x axis) and G2/M (y axis). b, c, Only stem/progenitor cells are cycling. b, Hierarchy plot, as in Fig. 2d, for MGH54 cells (n = 1,174), with cycling cells colour-coded as in a. c, Hierarchy plot for the six tumours, with each cell colour-coded based on the fraction of neighbouring cells (within Euclidean distance of 0.3) that are cycling. d, Immunohistochemistry for astrocytic marker (GFAP) in MGH54, with expression in subset of cells (left). In situ RNA hybridization shows mutually exclusive expression of astrocytic (APOE, arrowhead) and oligodendrocytic (OMG, arrow) markers, and of stem/progenitor (CCND2, arrowhead) and APOE (arrow) markers, but co-expression of stemness (SOX4) and cell cycle (Ki-67) markers (arrowhead) (middle). Double immunohistochemistry for GFAP (red, arrows) and Ki-67 (brown, arrowheads), showing mutual exclusivity (right).
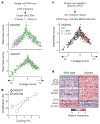
Figure 4. Intra-tumoural genetic heterogeneity and association with gene expression states
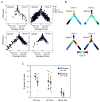
a–d, Cells were classified into genetic subclones based on CNVs (a, b) or CIC point mutation status (c, d), and examined for differences in gene expression states. a, Two CNV clones (green and grey) in MGH36 and MGH97 mapped to the cellular hierarchy defined by lineage (x axis) and stemness (y axis) scores. b, Percentages of cycling cells (x axis) and of stem/progenitor cells (y axis) in clone 1 (green) and clone 2 (grey) of MGH36 (square) and MGH97 (diamond). c, Cells were classified using mutation-specific qPCR as wild-type CIC (green), mutant CIC (orange) or CIC status not detected (black) and mapped to the cellular hierarchy. The fraction of mutant CIC cells as observed by qPCR (O) and as expected by ABSOLUTE (E) is indicated. d, An expression signature for mutant CIC cells. Shown is a heatmap of relative expression levels for _CIC-_dependent genes (rows) in mutant CIC cells (right) and wild-type CIC cells (left). Selected gene names are indicated.
Comment in
- CNS cancer: Tracing stem cells in oligodendroglioma.
Romero D. Romero D. Nat Rev Clin Oncol. 2017 Jan;14(1):2-3. doi: 10.1038/nrclinonc.2016.192. Epub 2016 Nov 22. Nat Rev Clin Oncol. 2017. PMID: 27874063 No abstract available. - Cancer genomics: Single-cell RNA-seq to decipher tumour architecture.
Cloney R. Cloney R. Nat Rev Genet. 2017 Jan;18(1):2-3. doi: 10.1038/nrg.2016.151. Epub 2016 Nov 28. Nat Rev Genet. 2017. PMID: 27890926 No abstract available.
Similar articles
- Pinpointing Cancer Stem Cells in Oligodendroglioma.
[No authors listed] [No authors listed] Cancer Discov. 2017 Jan;7(1):6. doi: 10.1158/2159-8290.CD-NB2016-149. Epub 2016 Nov 18. Cancer Discov. 2017. PMID: 27864226 - Mutant IDH inhibitors induce lineage differentiation in IDH-mutant oligodendroglioma.
Spitzer A, Gritsch S, Nomura M, Jucht A, Fortin J, Raviram R, Weisman HR, Gonzalez Castro LN, Druck N, Chanoch-Myers R, Lee JJY, Mylvaganam R, Lee Servis R, Fung JM, Lee CK, Nagashima H, Miller JJ, Arrillaga-Romany I, Louis DN, Wakimoto H, Pisano W, Wen PY, Mak TW, Sanson M, Touat M, Landau DA, Ligon KL, Cahill DP, Suvà ML, Tirosh I. Spitzer A, et al. Cancer Cell. 2024 May 13;42(5):904-914.e9. doi: 10.1016/j.ccell.2024.03.008. Epub 2024 Apr 4. Cancer Cell. 2024. PMID: 38579724 - Decoupling genetics, lineages, and microenvironment in IDH-mutant gliomas by single-cell RNA-seq.
Venteicher AS, Tirosh I, Hebert C, Yizhak K, Neftel C, Filbin MG, Hovestadt V, Escalante LE, Shaw ML, Rodman C, Gillespie SM, Dionne D, Luo CC, Ravichandran H, Mylvaganam R, Mount C, Onozato ML, Nahed BV, Wakimoto H, Curry WT, Iafrate AJ, Rivera MN, Frosch MP, Golub TR, Brastianos PK, Getz G, Patel AP, Monje M, Cahill DP, Rozenblatt-Rosen O, Louis DN, Bernstein BE, Regev A, Suvà ML. Venteicher AS, et al. Science. 2017 Mar 31;355(6332):eaai8478. doi: 10.1126/science.aai8478. Science. 2017. PMID: 28360267 Free PMC article. - Enchondromatosis-associated oligodendroglioma: case report and literature review.
Achiha T, Arita H, Kagawa N, Murase T, Ikeda JI, Morii E, Kanemura Y, Fujimoto Y, Kishima H. Achiha T, et al. Brain Tumor Pathol. 2018 Jan;35(1):36-40. doi: 10.1007/s10014-017-0303-y. Epub 2017 Dec 9. Brain Tumor Pathol. 2018. PMID: 29224049 Review. - Oligodendroglioma arising in the glial component of ovarian teratomas: a series of six cases and review of literature.
Ud Din N, Memon A, Aftab K, Ahmad Z, Ahmed R, Hassan S. Ud Din N, et al. J Clin Pathol. 2012 Jul;65(7):631-4. doi: 10.1136/jclinpath-2012-200714. Epub 2012 Apr 11. J Clin Pathol. 2012. PMID: 22496515 Review.
Cited by
- Single-cell transcriptomics reveals regulators underlying immune cell diversity and immune subtypes associated with prognosis in nasopharyngeal carcinoma.
Chen YP, Yin JH, Li WF, Li HJ, Chen DP, Zhang CJ, Lv JW, Wang YQ, Li XM, Li JY, Zhang PP, Li YQ, He QM, Yang XJ, Lei Y, Tang LL, Zhou GQ, Mao YP, Wei C, Xiong KX, Zhang HB, Zhu SD, Hou Y, Sun Y, Dean M, Amit I, Wu K, Kuang DM, Li GB, Liu N, Ma J. Chen YP, et al. Cell Res. 2020 Nov;30(11):1024-1042. doi: 10.1038/s41422-020-0374-x. Epub 2020 Jul 20. Cell Res. 2020. PMID: 32686767 Free PMC article. - Single-Cell Reconstruction of Human Basal Cell Diversity in Normal and Idiopathic Pulmonary Fibrosis Lungs.
Carraro G, Mulay A, Yao C, Mizuno T, Konda B, Petrov M, Lafkas D, Arron JR, Hogaboam CM, Chen P, Jiang D, Noble PW, Randell SH, McQualter JL, Stripp BR. Carraro G, et al. Am J Respir Crit Care Med. 2020 Dec 1;202(11):1540-1550. doi: 10.1164/rccm.201904-0792OC. Am J Respir Crit Care Med. 2020. PMID: 32692579 Free PMC article. - Integrative insights and clinical applications of single-cell sequencing in cancer immunotherapy.
Liu Z, Li H, Dang Q, Weng S, Duo M, Lv J, Han X. Liu Z, et al. Cell Mol Life Sci. 2022 Oct 31;79(11):577. doi: 10.1007/s00018-022-04608-4. Cell Mol Life Sci. 2022. PMID: 36316529 Review. - Single-cell transcriptomic profiling for inferring tumor origin and mechanisms of therapeutic resistance.
Lin M, Sade-Feldman M, Wirth L, Lawrence MS, Faden DL. Lin M, et al. NPJ Precis Oncol. 2022 Oct 10;6(1):71. doi: 10.1038/s41698-022-00314-3. NPJ Precis Oncol. 2022. PMID: 36210388 Free PMC article. - World Cancer Day 2021 - Perspectives in Pediatric and Adult Neuro-Oncology.
Sulman EP, Eisenstat DD. Sulman EP, et al. Front Oncol. 2021 May 10;11:659800. doi: 10.3389/fonc.2021.659800. eCollection 2021. Front Oncol. 2021. PMID: 34041027 Free PMC article.
References
- Kreso A, Dick JE. Evolution of the cancer stem cell model. Cell Stem Cell. 2014;14:275–291. - PubMed
- Louis DN, Ohgaki H, Wiestler OD, Cavenee WK. WHO Classification of Tumors of the Central Nervous System. 4. IARC; 2016. - PubMed
- Picelli S, et al. Full-length RNA-seq from single cells using Smart-seq2. Nature Protocols. 2014;9:171–181. - PubMed
Publication types
MeSH terms
Substances
Grants and funding
- R25 NS065743/NS/NINDS NIH HHS/United States
- U24 CA180922/CA/NCI NIH HHS/United States
- P30 CA014051/CA/NCI NIH HHS/United States
- S10 RR023440/RR/NCRR NIH HHS/United States
- R33 CA202820/CA/NCI NIH HHS/United States
- U24 AI118672/AI/NIAID NIH HHS/United States
- 1U24CA180922/CA/NCI NIH HHS/United States
- HHMI_/Howard Hughes Medical Institute/United States
LinkOut - more resources
Full Text Sources
Other Literature Sources
Molecular Biology Databases
Miscellaneous
