Electric stimulation of the vagus nerve reduced mouse neuroinflammation induced by lipopolysaccharide - PubMed (original) (raw)
doi: 10.1186/s12950-016-0140-5. eCollection 2016.
M Bautista 1, A Florentino 1, G Díaz 1, G Acero 1, H Besedovsky 2, D Meneses 3, A Fleury 4, A Del Rey 2, G Gevorkian 1, G Fragoso 1, E Sciutto 1
Affiliations
- PMID: 27807399
- PMCID: PMC5086408
- DOI: 10.1186/s12950-016-0140-5
Electric stimulation of the vagus nerve reduced mouse neuroinflammation induced by lipopolysaccharide
G Meneses et al. J Inflamm (Lond). 2016.
Abstract
Background: Neuroinflammation (NI) is a key feature in the pathogenesis and progression of infectious and non-infectious neuropathologies, and its amelioration usually improves the patient outcome. Peripheral inflammation may promote NI through microglia and astrocytes activation, an increased expression of inflammatory mediators and vascular permeability that may lead to neurodegeneration. Several anti-inflammatory strategies have been proposed to control peripheral inflammation. Among them, electrical stimulation of the vagus nerve (VNS) recently emerged as an alternative to effectively attenuate peripheral inflammation in a variety of pathological conditions with few side effects. Considering that NI underlies several neurologic pathologies we explored herein the possibility that electrically VNS can also exert anti-inflammatory effects in the brain.
Methods: NI was experimentally induced by intraperitoneal injection of bacterial lipopolysaccharide (LPS) in C57BL/6 male mice; VNS with constant voltage (5 Hz, 0.75 mA, 2 ms) was applied for 30 s, 48 or 72 h after lipopolysaccharide injection. Twenty four hours later, pro-inflammatory cytokines (IL-1β, IL-6, TNFα) levels were measured by ELISA in brain and spleen extracts and total brain cells were isolated and microglia and macrophage proliferation and activation was assessed by flow cytometry. The level of ionized calcium binding adaptor molecule (Iba-1) and glial fibrillary acidic protein (GFAP) were estimated in whole brain extracts and in histologic slides by Western blot and immunohistochemistry, respectively.
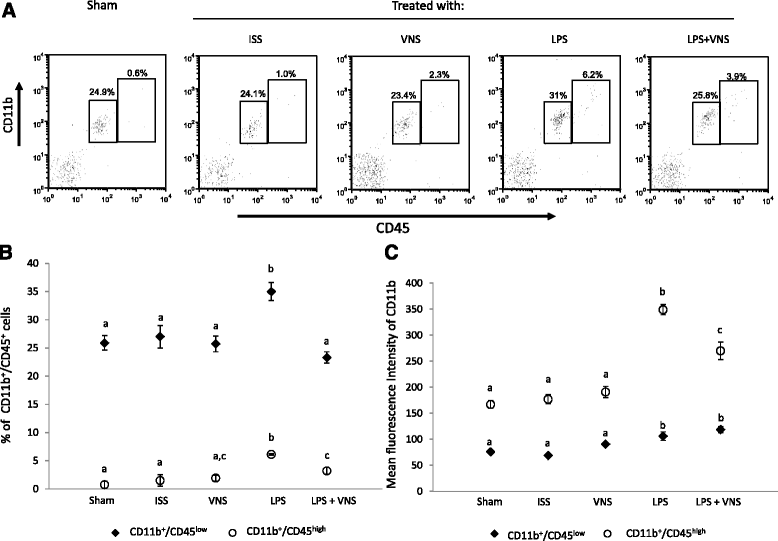
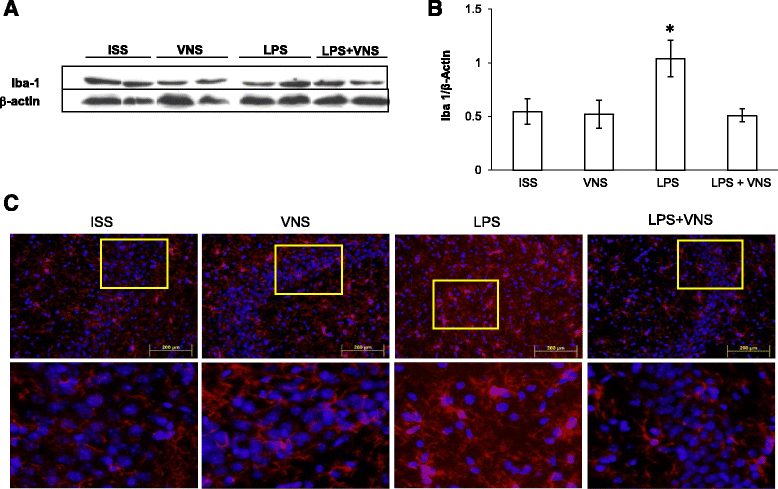
Results: VNS significantly reduced the central levels of pro-inflammatory cytokines and the percentage of microglia (CD11b/CD45low) and macrophages (CD11b/CD45high), 24 h after the electrical stimulus in LPS stimulated mice. A significantly reduced level of Iba-1 expression was also observed in whole brain extracts and in the hippocampus, suggesting a reduction in activated microglia.
Conclusions: VNS is a feasible therapeutic tool to attenuate the NI reaction. Considering that NI accompanies different neuropathologies VNS is a relevant alternative to modulate NI, of particular interest for chronic neurological diseases.
Keywords: Antiinflammatory; Lipopolysaccharide neuropathologies; Microglia; Neuroinflammation; Stimulation of vagus nerve.
Figures
Fig. 1
Procedure of implanted electrodes and location by CTscan. a Procedure of electrode insertion into the vagus nerve. 1. Photograph showing the trachea and the sternocleidomastoid muscle, carotid. 2. Sheath with carotid and vagus nerve. 3. Vagus nerve is shown isolated. 4. Electrodes applied to the vagus nerve. t = trachea, ECOM = sternocleidomastoid, c = carotid, VN = vagus nerve. b Representative view of the electrodes inserted in the vagus nerve by Computed Tomography Scan
Fig. 2
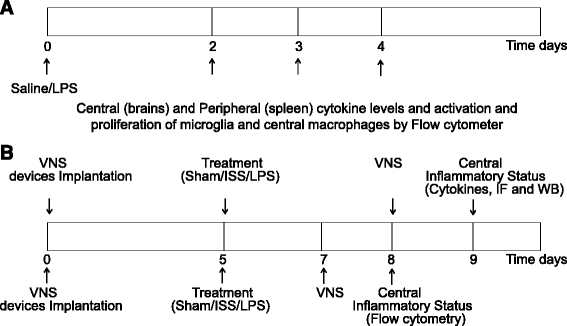
Experimental design line. a LPS or ISS were injected at day 0. The inflammatory peripheral and central status was evaluated before and at the different times after injection. b Electrodes were implanted at day 0. Five days later, mice were randomly divided into five groups: sham, isotonic saline solution treated mice (ISS), Vagus Nerve Stimulation (VNS), LPS and LPS + VNS
Fig. 3
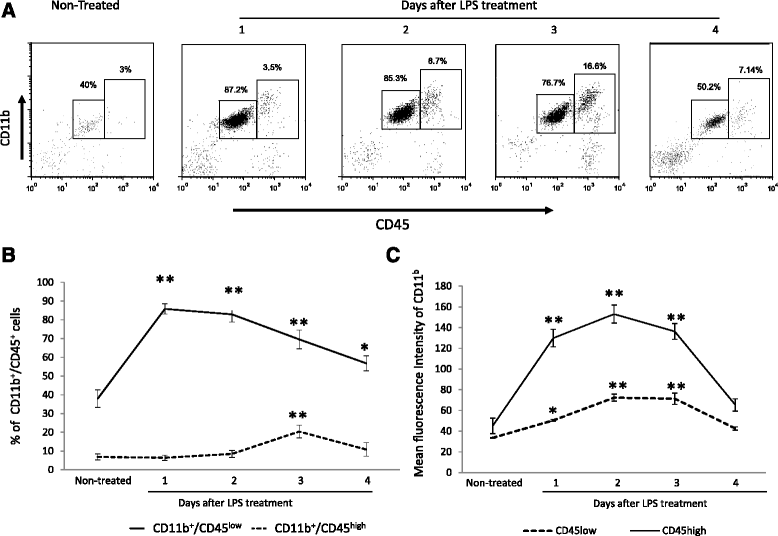
a A representative dot plot of isolated brain cells from saline or LPS treated mice analyzed by flow cytometry. b Mean ± SD of the percentage of CD11b/CD45low and CD11b/CD45high before and 48, 72, and 96 h after LPS treatment and mean ± SD of the fluorescence intensities of CD11b (c). Different literals indicate significant differences between the different groups (p < 0.05) using the Kruskal-Wallis test (non-parametric ANOVA) plus the Dunn’s multiple comparisons test. Data are representative of four experiments
Fig. 4
a Representative dot plot of isolated brain cells analyzed by flow citometry. b Mean ± SD of the percentage of CD11b/CD45low and CD11b/CD45high cells and the respective Mean ± SD of the fluorescence intensities of CD11b (c) of five mice per group. Data are representative of two different independent assays. Different literals indicate significant differences in the percent of CD11b/CD45low and CD11b/CD45high cells (P < 0.05) between the different groups using the Kruskal- Wallis test (non-parametric ANOVA) plus the Dunn’s multiple comparisons test
Fig. 5
Analysis of brain Iba-1 expression in ISS, VNS, LPS, and LPS + VNS- treated mice. a Representative Western blot showing Iba-1 and β-actin. b Western blot analysis of Iba-1 in whole brain homogenates of SSI, VNS, LPS, and LPS + VNS-treated mice. Each column represents the level of Iba-1 expressed as mean ± SEM, normalized to β-actin in a same gel. Different literals indicate significant differences in the expression level of Iba-1 among the different groups using one-way Analysis of Variance plus the Tukey-Kramer multiple comparisons test. F (3,16) = 6.7, p < 0.004. c Representative mouse brain sections of the different groups stained with anti-Iba-1 antibody (to detect microglia). Bottom images represent a nine-fold magnification of the region outlined in the box in the corresponding upper image. In LPS-treated mice, higher numbers of microglia with morphological characteristics of activated cells were observed
Fig. 6
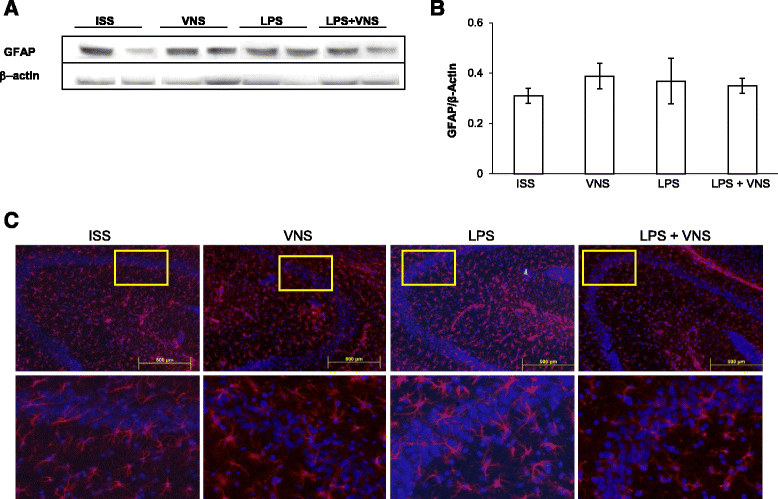
Analysis of GFAP expression in the brain of ISS, VNS, LPS-treated and LPS + VNS-treated. a Representative Western blots showing GFAP and β-actin levels. b Western blot analysis of GFAP in whole brain homogenates of untreated, VNS, LPS-treated, and LPS + VNS-treated mice. Each column in the graph represents the level of GFAP expressed as Mean ± SEM, normalized to β-actin in a same gel. No significant differences between GFAP levels were observed using one-way Analysis of Variance plus the Tukey-Kramer multiple comparisons test. F (3,16) = 0.44, p = 0.72. c Representative mouse brain sections of the different groups of mice stained with anti-GFAP antibody (to detect astrocytes). Bottom images represent a nine-fold magnification of the region outlined in the box in the corresponding upper image
Similar articles
- Acute in utero exposure to lipopolysaccharide induces inflammation in the pre- and postnatal brain and alters the glial cytoarchitecture in the developing amygdala.
O'Loughlin E, Pakan JMP, Yilmazer-Hanke D, McDermott KW. O'Loughlin E, et al. J Neuroinflammation. 2017 Nov 2;14(1):212. doi: 10.1186/s12974-017-0981-8. J Neuroinflammation. 2017. PMID: 29096641 Free PMC article. - Vagus nerve stimulation modulates hippocampal inflammation caused by continuous stress in rats.
Namgung U, Kim KJ, Jo BG, Park JM. Namgung U, et al. J Neuroinflammation. 2022 Feb 2;19(1):33. doi: 10.1186/s12974-022-02396-z. J Neuroinflammation. 2022. PMID: 35109857 Free PMC article. - Electrical vagus nerve stimulation attenuates systemic inflammation and improves survival in a rat heatstroke model.
Yamakawa K, Matsumoto N, Imamura Y, Muroya T, Yamada T, Nakagawa J, Shimazaki J, Ogura H, Kuwagata Y, Shimazu T. Yamakawa K, et al. PLoS One. 2013;8(2):e56728. doi: 10.1371/journal.pone.0056728. Epub 2013 Feb 12. PLoS One. 2013. PMID: 23424673 Free PMC article. - The induction of neuronal death by up-regulated microglial cathepsin H in LPS-induced neuroinflammation.
Fan K, Li D, Zhang Y, Han C, Liang J, Hou C, Xiao H, Ikenaka K, Ma J. Fan K, et al. J Neuroinflammation. 2015 Mar 19;12:54. doi: 10.1186/s12974-015-0268-x. J Neuroinflammation. 2015. PMID: 25889123 Free PMC article. - Intranasal delivery of dexamethasone efficiently controls LPS-induced murine neuroinflammation.
Meneses G, Gevorkian G, Florentino A, Bautista MA, Espinosa A, Acero G, Díaz G, Fleury A, Pérez Osorio IN, Del Rey A, Fragoso G, Sciutto E, Besedovsky H. Meneses G, et al. Clin Exp Immunol. 2017 Dec;190(3):304-314. doi: 10.1111/cei.13018. Epub 2017 Sep 7. Clin Exp Immunol. 2017. PMID: 28752628 Free PMC article.
Cited by
- An Effective Method for Acute Vagus Nerve Stimulation in Experimental Inflammation.
Caravaca AS, Gallina AL, Tarnawski L, Tracey KJ, Pavlov VA, Levine YA, Olofsson PS. Caravaca AS, et al. Front Neurosci. 2019 Aug 27;13:877. doi: 10.3389/fnins.2019.00877. eCollection 2019. Front Neurosci. 2019. PMID: 31551672 Free PMC article. - Trigeminal, Visceral and Vestibular Inputs May Improve Cognitive Functions by Acting through the Locus Coeruleus and the Ascending Reticular Activating System: A New Hypothesis.
De Cicco V, Tramonti Fantozzi MP, Cataldo E, Barresi M, Bruschini L, Faraguna U, Manzoni D. De Cicco V, et al. Front Neuroanat. 2018 Jan 8;11:130. doi: 10.3389/fnana.2017.00130. eCollection 2017. Front Neuroanat. 2018. PMID: 29358907 Free PMC article. Review. - The Cholinergic System Modulates Memory and Hippocampal Plasticity via Its Interactions with Non-Neuronal Cells.
Maurer SV, Williams CL. Maurer SV, et al. Front Immunol. 2017 Nov 8;8:1489. doi: 10.3389/fimmu.2017.01489. eCollection 2017. Front Immunol. 2017. PMID: 29167670 Free PMC article. Review. - Inflammation-Induced Histamine Impairs the Capacity of Escitalopram to Increase Hippocampal Extracellular Serotonin.
Hersey M, Samaranayake S, Berger SN, Tavakoli N, Mena S, Nijhout HF, Reed MC, Best J, Blakely RD, Reagan LP, Hashemi P. Hersey M, et al. J Neurosci. 2021 Jul 28;41(30):6564-6577. doi: 10.1523/JNEUROSCI.2618-20.2021. Epub 2021 Jun 3. J Neurosci. 2021. PMID: 34083254 Free PMC article. - Vagus nerve stimulation in pregnant rats and effects on inflammatory markers in the brainstem of neonates.
Judkins A, Johnson RL, Murray ST, Yellon SM, Wilson CG. Judkins A, et al. Pediatr Res. 2018 Feb;83(2):514-519. doi: 10.1038/pr.2017.265. Epub 2017 Nov 22. Pediatr Res. 2018. PMID: 29053705 Free PMC article.
References
LinkOut - more resources
Full Text Sources
Other Literature Sources
Research Materials
Miscellaneous

