Loss of ULK1 increases RPS6KB1-NCOR1 repression of NR1H/LXR-mediated Scd1 transcription and augments lipotoxicity in hepatic cells - PubMed (original) (raw)
Loss of ULK1 increases RPS6KB1-NCOR1 repression of NR1H/LXR-mediated Scd1 transcription and augments lipotoxicity in hepatic cells
Rohit Anthony Sinha et al. Autophagy. 2017.
Abstract
Lipotoxicity caused by saturated fatty acids (SFAs) induces tissue damage and inflammation in metabolic disorders. SCD1 (stearoyl-coenzyme A desaturase 1) converts SFAs to mono-unsaturated fatty acids (MUFAs) that are incorporated into triglycerides and stored in lipid droplets. SCD1 thus helps protect hepatocytes from lipotoxicity and its reduced expression is associated with increased lipotoxic injury in cultured hepatic cells and mouse models. To further understand the role of SCD1 in lipotoxicity, we examined the regulation of Scd1 in hepatic cells treated with palmitate, and found that NR1H/LXR (nuclear receptor subfamily 1 group H) ligand, GW3965, induced Scd1 expression and lipid droplet formation to improve cell survival. Surprisingly, ULK1/ATG1 (unc-51 like kinase) played a critical role in protecting hepatic cells from SFA-induced lipotoxicity via a novel mechanism that did not involve macroautophagy/autophagy. Specific loss of Ulk1 blocked the induction of Scd1 gene transcription by GW3965, decreased lipid droplet formation, and increased apoptosis in hepatic cells exposed to palmitate. Knockdown of ULK1 increased RPS6KB1 (ribosomal protein S6 kinase, polypeptide 1) signaling that, in turn, induced NCOR1 (nuclear receptor co-repressor 1) nuclear uptake, interaction with NR1H/LXR, and recruitment to the Scd1 promoter. These events abrogated the stimulation of Scd1 gene expression by GW3965, and increased lipotoxicity in hepatic cells. In summary, we have identified a novel autophagy-independent role of ULK1 that regulates NR1H/LXR signaling, Scd1 expression, and intracellular lipid homeostasis in hepatic cells exposed to a lipotoxic environment.
Keywords: LXR; NASH; NCOR1; RPS6KB1; SCD1; ULK1; autophagy; lipid droplets; lipotoxicity.
Figures
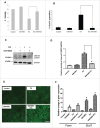
Figure 1.
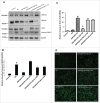
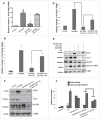
NR1H/LXR agonist GW3965 protects against PA-induced apoptosis. (A) MTS assay showing percent viability of AML-12 cells cotreated with 0.75 mM PA +/− 10 µM GW3965 for 24 h. (B) Flow cytometric sub-G1 peak analysis using propidium iodide staining of AML-12 cells cotreated with 0.75 mM PA +/− 10 µM GW3965 for 24 h. (C, D) Representative immunoblot and densitometric anaylysis showing CASP3 cleavage products in AML-12 cells cotreated with 0.75 mM PA +/− 10 µM GW3965 for 24 h. (E) Lipophilic fluorescent dye BODIPY 493/503 staining showing LDs (bright green stain) in AML-12 with 0.75 mM PA +/− 10 µM GW3965 for 12 h (scale bar: 200 µm). (F) qRT-PCR analysis showing Scd1 and Fasn levels in AML-12 cells cotreated with 0.75 mM PA +/− 10 µM GW3965 for 24 h. Bars represent the mean of the respective individual ratios ±SD (n = 5, *p < 0 .05).
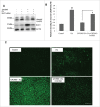
Figure 2.
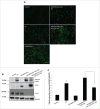
NR1H/LXR-induced Scd1 is essential for GW3965-mediated protection against lipotoxicity. (A, B) Representative blots and densitometric analysis showing the effect of Scd1 KD on apoptotic marker cleaved CASP3 (p17) and SCD1 in AML-12 cells cotreated with 0.75 mM PA +/− 10 µM GW3965 for 24 h. Bars represent the mean of the respective individual ratios ±SD (n = 5, #p < 0 .05 denotes significant difference in cleaved CASP3 levels between PA vs. Control and PA + GW3965, *p < 0 .05 denotes difference between PA + GW3965 + Scd1 KD vs. PA + GW3965). (C) Lipophilic fluorescent dye BODIPY 493/503 staining showing LDs (bright green stain) in AML-12 cells +/− Scd1 siRNA cotreated with 0.75 mM PA +/− 10 µM GW3965 for 12 h (scale bar: 200 µm).
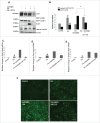
Figure 3.
Loss of Ulk1 impairs GW3965-induced SCD1 induction and protection from PA toxicity. (A, B) Representative blot and densitometric analysis showing the effect of Ulk1 KD on apoptotic marker cleaved CASP3 (p17), autophagy marker MAP1LC3B-II and SCD1 in AML-12 cells cotreated with 0.75 mM PA +/− 10 µM GW3965 for 24 h. Bars represent the mean of the respective individual ratios ±SD (n = 5, #p < 0 .05 denotes significant difference in cleaved CASP3 and SCD1 levels between PA vs. Control and PA + GW3965, *p < 0 .05 denotes significant difference in cleaved CASP3 and SCD1 levels between PA + GW3965 vs. PA + GW3965 + Ulk1 KD). (C-E) qRT-PCR analysis showing the effect of Ulk1 KD on Scd1, Fasn and Srebf1 levels in AML-12 cells cotreated with 0.75 mM PA +/− 10 µM GW3965 for 24 h. (n = 5, #p < 0 .05) (F) Lipophilic fluorescent dye BODIPY 493/503 staining showing LDs (bright green stain) in AML-12 cells +/− Ulk1 siRNA cotreated with 0.75 mM PA +/− 10 µM GW3965 for 12 h (scale bar: 200 µm).
Figure 4.
Ulk1 kinase activity is required in regulating GW3965-mediated SCD1 expression. (A, B) Representative blot and densitometric analysis showing the effect of ULK1/2 kinase inhibitor MRT0068921 (1 µM) on SCD1 levels in AML-12 cells treated with 10 µM GW3965 for 24 h. Bars represent the mean of the respective individual ratios ±SD (n = 5, *p < 0 .05). (C-E) Representative blot and densitometric analysis showing the recue effect of Ulk1 overexpression (OE) in Ulk1 KD cells on SCD1 and CASP3 cleavage in AML-12 cells. Bars represent the mean of the respective individual ratios ±SD (n = 5, #p < 0 .05 denotes significant difference in cleaved CASP3 and SCD1 levels between PA vs. Control and PA + GW3965, *p < 0 .05 denotes significant difference in cleaved CASP3 and SCD1 levels between PA + GW3965 + Ulk1 KD vs. PA + GW3965 + Ulk1 KD + Ulk1 OE).
Figure 5.
ULK1 regulation of NR1H/LXR-mediated SCD1 expression is independent of autophagy. (A, B) Representative blot and densitometric analysis showing comparative effect of Ulk1, Rb1cc1 and Becn1 KD treatment on CASP3 cleavage levels in AML-12 cells treated with 0.75 mM PA +/− 10 µM GW3965 for 24 h (n = 5, #p < 0 .05 denotes significant difference in cleaved CASP3 levels between PA vs. Control and PA + GW3965, *p < 0 .05 denotes significant difference in cleaved CASP3 levels between PA + GW3965 vs. PA + GW3965 +Ulk1, Rb1cc1 or Becn1 KD). (C) qRT-PCR analysis showing comparative effect of Ulk1, Rb1cc1 and Becn1 KD treatment on Scd1 mRNA levels in AML-12 cells treated with 0.75 mM PA +/− 10 µM GW3965 for 24 h (n = 5, *p < 0 .05 denotes significant difference between PA + GW3965 vs. PA + GW3965 + Ulk1, Rb1cc1 or Becn1 KD). (D) BODIPY 493/503 staining showing comparative effect of Ulk1, Rb1cc1 and Becn1 KD treatment on LD formation in AML-12 cells treated with 0.75 mM PA +/− 10 µM GW3965 for 12 h (scale bar: 200 µm).
Figure 6.
Ectopic expression of SCD1 rescues the effect of Ulk1 KD on GW3965-induced LD formation and cell survival. (A) BODIPY 493/503 staining showing comparative effect of Scd1 overexpression (OE) treatment on LD formation in AML-12 cells treated with 0.75 mM PA +/− 10 µM GW3965 for 12 h in a background of Ulk1 KD (scale bar: 200 µm). (C, D) Representative blot and densitometric analysis showing the rescue effect of Scd1 overexpression (OE) in Ulk1 KD cells on CASP3 cleavage in AML-12 cells. Bars represent the mean of the respective individual ratios ±SD (n = 5, #p < 0 .05 denotes significant difference in cleaved CASP3 levels between PA vs. Control and PA + GW3965, *p < 0 .05 denotes significant difference in cleaved CASP3 levels between PA + GW3965 + Ulk1 KD vs. PA + GW3965 + Ulk1 KD + Scd1 OE.
Figure 7.
Upregulated RPS6KB1 activity mediates suppression of SCD1 in Ulk1 KD cells. (A, B) Representative blot and densitometric analysis showing p-RPTOR:RPTOR levels in AML-12 after 48 h of Ulk1 KD. Bars represent the mean of the respective individual ratios ±SD (n = 5, *p < 0 .05). (C, D) Representative blot and densitometric analysis showing p-RPS6KB1:RPS6KB1 levels in AML-12 after 48 h of Ulk1 KD. Bars represent the mean of the respective individual ratios ±SD (n = 5, *p < 0 .05). (E, F) Representative blot and densitometric analysis showing the effect of Ulk1 KD +/− RPS6KB1 KD on SCD1 and cleaved CASP3 levels in AML-12 cells cotreated with 0.75 mM PA +/− 10 µM GW3965 for 24 h. Bars represent the mean of the respective individual ratios ±SD (n = 5, #p < 0 .05 denotes significant difference in cleaved CASP3 and SCD1 levels between PA vs. Control and PA + GW3965, *p < 0 .05 denotes significant difference in cleaved CASP3 and SCD1 levels between PA + GW3965 + Ulk1 KD vs. PA + GW3965 +Ulk1 KD + Rps6kb1 KD).
Figure 8.
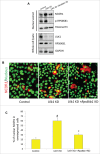
RPS6KB1 drives NCOR1 nuclear localization upon loss of ULK1 activity. (A) Representative immunoblot shows the level of NCOR1 in nuclear extracts in control, Ulk1 KD and Ulk1 + Rps6kb1 double knockdown AML-12cells. Whole cell lysates were used to assess the knockdown efficiency. (B, C) Representative immunofluorescence image and quantification of NCOR1-FLAG-transfected cells using anti-FLAG antibody (red) and DAPI (green pseudo color) in cells treated with Ulk1 alone or ULK1 + RPS6KB1 siRNA for 48 h (scale bar: 200 µm). Bars represent the mean of the respective individual ratios ±SD (n = 5, #p < 0 .05 denotes significant between Ulk1 KD vs.Control and, *p < 0 .05 denotes significant difference between Ulk1 KD vs. Ulk1 KD + Rps6kb1 KD cells.
Figure 9.
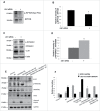
Ulk1 KD increases NCOR1-NR1H/LXR interaction and NCOR1 recruitment to Scd1 promoter NR1HEs. (A, B) Representative blot and densitometric analysis following Co-IP of NR1H3/LXRα using NCOR1 antibody in cells treated +/− Ulk1 siRNA for 48 h. For quantifying the NR1H3/LXRα-NCOR1 interaction as shown in panel (B), relative densities of affinity isolated NR1H3/LXRα and NCOR1 were were first normalized to their levels in the Input and later in the IP samples +/− Ulk1 KD. (C) ChIP-qPCR analysis of NCOR1 recruitment to NR1HE on the Scd1 promoter in cells treated +/− Ulk1 siRNA for 48 h. Bars represent the mean of the respective individual ratios ±SD (n = 3, *p < 0 .05).
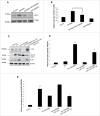
Figure 10.
NCOR1-mediated inhibition of NR1H/LXR-induced SCD1 expression increases lipotoxicity in hepatic cells. (A) qRT-PCR analysis showing the effect of WT and ΔID mutant NCOR1 overexpression on GW3965 (10 µM/24 h)-induced SCD1 expression in AML-12 cells. Bars represent the mean of the respective individual ratios ±SD (n = 3, #p < 0 .05 denotes significant difference between Control and GW3965, *p < 0 .05 denotes significant difference between Scd1 levels between GW3965 vs. GW3965 + WT Ncor1 overexpression). (B) qRT-PCR analysis showing the effect of Ulk1 KD +/− Ncor1 KD on Scd1 mRNA levels in AML-12 cells treated with 10 µM GW3965 for 24 h. Bars represent the mean of the respective individual ratios ±SD (n = 5, #p < 0 .05 denotes significant difference in Scd1 mRNA levels between GW3965 vs. Control and GW3965 + Ulk1 KD, *p < 0 .05 denotes significant difference in Scd1 mRNA levels between GW3965 + Ulk1 KD vs. GW3965 + Ulk1 KD + Ncor1 KD). (C, D) Representative blot and densitometric analysis showing the effect of Ulk1 KD +/− Ncor1 KD on SCD1 levels in AML-12 cells treated with 10 µM GW3965 for 24 h. Bars represent the mean of the respective individual ratios ±SD (n = 5, *p < 0 .05). (E, F) Representative blot and densitometric analysis showing the effect of Ulk1 KD +/− Ncor1 KD on SCD1 and cleaved CASP3 levels in AML-12 cells cotreated with 0.75 mM PA +/− 10 µM GW3965 for 24 h. Bars represent the mean of the respective individual ratios ±SD (n = 5, #p < 0 .05 denotes significant difference in cleaved CASP3 and SCD1 levels between PA vs. Control and PA + GW3965, *p < 0 .05 denotes significant difference between cleaved CASP3 and SCD1 levels between PA + GW3965 + Ulk1 KD vs. PA + GW3965 + Ulk1 KD + Ncor1 KD).
Figure 11.
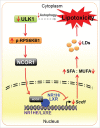
Proposed model elucidating the effect of ULK1 loss on SFA-induced lipotoxicity in cells. Our study suggests that besides the impairment of autophagy-mediated signaling, ULK1 downregulation in a lipotoxic environment leads to increased activation of RPS6KB1. This in turn causes increased nuclear localization of NCOR1 in the nucleus. NCOR1-mediated inactivation of NR1H/LXRs causes suppression of Scd1 transcription hence leading to an increased SFA/MUFA ratio. This would further decrease the generation of neutral LDs and eventually cause cell death via lipotoxicity.
Similar articles
- Stearoyl-CoA Desaturase-1 Protects Cells against Lipotoxicity-Mediated Apoptosis in Proximal Tubular Cells.
Iwai T, Kume S, Chin-Kanasaki M, Kuwagata S, Araki H, Takeda N, Sugaya T, Uzu T, Maegawa H, Araki SI. Iwai T, et al. Int J Mol Sci. 2016 Nov 9;17(11):1868. doi: 10.3390/ijms17111868. Int J Mol Sci. 2016. PMID: 27834856 Free PMC article. - Dual roles of ULK1 (unc-51 like autophagy activating kinase 1) in cytoprotection against lipotoxicity.
Park JS, Lee DH, Lee YS, Oh E, Bae KH, Oh KJ, Kim H, Bae SH. Park JS, et al. Autophagy. 2020 Jan;16(1):86-105. doi: 10.1080/15548627.2019.1598751. Epub 2019 Apr 9. Autophagy. 2020. PMID: 30907226 Free PMC article. - Hepatic lipid partitioning and liver damage in nonalcoholic fatty liver disease: role of stearoyl-CoA desaturase.
Li ZZ, Berk M, McIntyre TM, Feldstein AE. Li ZZ, et al. J Biol Chem. 2009 Feb 27;284(9):5637-44. doi: 10.1074/jbc.M807616200. Epub 2009 Jan 1. J Biol Chem. 2009. PMID: 19119140 Free PMC article. - Role of stearoyl-CoA desaturase-1 in skeletal muscle function and metabolism.
Stamatikos AD, Paton CM. Stamatikos AD, et al. Am J Physiol Endocrinol Metab. 2013 Oct 1;305(7):E767-75. doi: 10.1152/ajpendo.00268.2013. Epub 2013 Aug 13. Am J Physiol Endocrinol Metab. 2013. PMID: 23941875 Review. - SCD1 is the critical signaling hub to mediate metabolic diseases: Mechanism and the development of its inhibitors.
Sun Q, Xing X, Wang H, Wan K, Fan R, Liu C, Wang Y, Wu W, Wang Y, Wang R. Sun Q, et al. Biomed Pharmacother. 2024 Jan;170:115586. doi: 10.1016/j.biopha.2023.115586. Epub 2023 Dec 1. Biomed Pharmacother. 2024. PMID: 38042113 Review.
Cited by
- Loss of ULK1 Attenuates Cholesterogenic Gene Expression in Mammalian Hepatic Cells.
Rajak S, Iannucci LF, Zhou J, Anjum B, George N, Singh BK, Ghosh S, Yen PM, Sinha RA. Rajak S, et al. Front Cell Dev Biol. 2020 Sep 30;8:523550. doi: 10.3389/fcell.2020.523550. Front Cell Dev Biol. 2020. PMID: 33083385 Free PMC article. - A review of experimental and clinical studies on the therapeutic effects of pomegranate (Punica granatum) on non-alcoholic fatty liver disease: Focus on oxidative stress and inflammation.
Zamanian MY, Sadeghi Ivraghi M, Khachatryan LG, Vadiyan DE, Bali HY, Golmohammadi M. Zamanian MY, et al. Food Sci Nutr. 2023 Sep 21;11(12):7485-7503. doi: 10.1002/fsn3.3713. eCollection 2023 Dec. Food Sci Nutr. 2023. PMID: 38107091 Free PMC article. Review. - Flightless-I Controls Fat Storage in Drosophila.
Park JE, Lee EJ, Kim JK, Song Y, Choi JH, Kang MJ. Park JE, et al. Mol Cells. 2018 Jun;41(6):603-611. doi: 10.14348/molcells.2018.0120. Epub 2018 Jun 12. Mol Cells. 2018. PMID: 29890821 Free PMC article. - Hyperphosphorylation of RPS6KB1, rather than overexpression, predicts worse prognosis in non-small cell lung cancer patients.
Chen B, Yang L, Zhang R, Gan Y, Zhang W, Liu D, Chen H, Tang H. Chen B, et al. PLoS One. 2017 Aug 9;12(8):e0182891. doi: 10.1371/journal.pone.0182891. eCollection 2017. PLoS One. 2017. PMID: 28792981 Free PMC article. - Regulation of Autophagy via Carbohydrate and Lipid Metabolism in Cancer.
Alizadeh J, Kavoosi M, Singh N, Lorzadeh S, Ravandi A, Kidane B, Ahmed N, Mraiche F, Mowat MR, Ghavami S. Alizadeh J, et al. Cancers (Basel). 2023 Apr 7;15(8):2195. doi: 10.3390/cancers15082195. Cancers (Basel). 2023. PMID: 37190124 Free PMC article. Review.
References
- Tumova J, Andel M, Trnka J. Excess of free fatty acids as a cause of metabolic dysfunction in skeletal muscle. Physiol Res 2015; PMID:26447514 - PubMed
- Brenner C, Galluzzi L, Kepp O, Kroemer G. Decoding cell death signals in liver inflammation. J Hepatol 2013; 59:583-94; PMID:23567086; http://dx.doi.org/10.1016/j.jhep.2013.03.033 - DOI - PubMed
- Cusi K. The role of adipose tissue and lipotoxicity in the pathogenesis of type 2 diabetes. Curr Diab Rep 2010; 10:306-15; PMID:20556549; http://dx.doi.org/10.1007/s11892-010-0122-6 - DOI - PubMed
- Ibrahim SH, Kohli R, Gores GJ. Mechanisms of lipotoxicity in NAFLD and clinical implications. J Pediatr Gastroenterol Nutr 2011; 53:131-40; PMID:21629127; http://dx.doi.org/10.1097/MPG.0b013e31820e82a1 - DOI - PMC - PubMed
- Neuschwander-Tetri BA. Hepatic lipotoxicity and the pathogenesis of nonalcoholic steatohepatitis: the central role of nontriglyceride fatty acid metabolites. Hepatology 2010; 52:774-88; PMID:20683968; http://dx.doi.org/10.1002/hep.23719 - DOI - PubMed
MeSH terms
Substances
LinkOut - more resources
Full Text Sources
Other Literature Sources
Research Materials
