One-Cell Doubling Evaluation by Living Arrays of Yeast, ODELAY! - PubMed (original) (raw)
One-Cell Doubling Evaluation by Living Arrays of Yeast, ODELAY!
Thurston Herricks et al. G3 (Bethesda). 2017.
Abstract
Cell growth is a complex phenotype widely used in systems biology to gauge the impact of genetic and environmental perturbations. Due to the magnitude of genome-wide studies, resolution is often sacrificed in favor of throughput, creating a demand for scalable, time-resolved, quantitative methods of growth assessment. We present ODELAY (One-cell Doubling Evaluation by Living Arrays of Yeast), an automated and scalable growth analysis platform. High measurement density and single-cell resolution provide a powerful tool for large-scale multiparameter growth analysis based on the modeling of microcolony expansion on solid media. Pioneered in yeast but applicable to other colony forming organisms, ODELAY extracts the three key growth parameters (lag time, doubling time, and carrying capacity) that define microcolony expansion from single cells, simultaneously permitting the assessment of population heterogeneity. The utility of ODELAY is illustrated using yeast mutants, revealing a spectrum of phenotypes arising from single and combinatorial growth parameter perturbations.
Keywords: carrying capacity; fitness assessment; growth rate; lag time; yeast.
Copyright © 2017 Herricks et al.
Figures
Figure 1
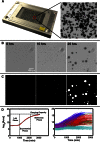
One-cell Doubling Evaluation by Living Arrays of Yeast (ODELAY). Solid-phase growth parameters are extracted by collecting time course image of growing colonies (A and B). Colony areas are measured from thresholded and binarized images from the time course image series (C). Colonies seeded from single yeast cells are tracked over time and the log2(Area) is used to fit a parameterized version of the Gompertz function (D, left). A control yeast strain (BY4741) was pregrown to saturation with glucose as a carbon source and then assayed on galactose-containing agar. The resulting heterogeneous colonies were clustered based on growth curve characteristics and graphed using colors to represent each cluster (D, right).
Figure 2
Complex phenotypes observed by ODELAY. Comparisons of doubling times and lag times for repeated measurements (A). Red lines indicate Bioscreen C results. Median ODELAY measurements show good agreement with BioScreen C measurements in doubling time but less so in lag time (B). Population histograms of doubling time from SWR1 complex deletion and GFP-tagged strains (blue) with comparison to the parent strain BY4742 (gray) (C). Heterogeneity in doubling times is observed in strains _swc3_Δ and ARP6-GFP while _arp6_Δ and SWC3-GFP appear similar to the parent strain BY4742. GFP, green fluorescent protein; ODELAY, One-cell Doubling Evaluation by Living Arrays of Yeast.
Figure 3
Observing lag time after a carbon source switch: Growth curves and histograms depicting lag time (TLag) and doubling time (Td) for control yeast strain (BY4742) pregrown in Gal (left) or Glu (right) and then spotted on Gal media (A). Differing growth phenotypes are observed from samples of a control yeast strain taken from the same culture at multiple times after seeding a source culture (B and C). Histograms of the Td and TLag are depicted below each set of growth curves. Note the changes in the lag time distributions as the source culture is aged. This demonstrates ODELAY’s utility and sensitivity to culture conditions of yeast. Gal, galactose; Glu, glucose; ODELAY, One-cell Doubling Evaluation by Living Arrays of Yeast.
Figure 4
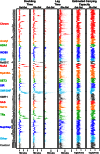
Comparison of 140 deletion strains: doubling times, lag times, and estimated carrying capacities of 140 deletion strains that underwent a Glu to Gal switch vs. those that were maintained on Gal as a carbon source. Strains are grouped into categories according to annotated gene function (yeastgenome.org) including chromatin modifiers (Chrom), acetyltransferase enzymes (Acetyl), protein complexes (HDA1, INO80, ISWI NatB/C, NuA4, Rpd3S/L, SET3, SIR, SWI/SNF, SWR1, SAS, and SetC), transcriptional regulators (TRs), nucleoporins and karyopherins (Nup/Kap), and other genes associated with carbon source switching (other). Gal, galactose; Glu, glucose.
Similar articles
- ODELAY: A Large-scale Method for Multi-parameter Quantification of Yeast Growth.
Herricks T, Mast FD, Li S, Aitchison JD. Herricks T, et al. J Vis Exp. 2017 Jul 3;(125):55879. doi: 10.3791/55879. J Vis Exp. 2017. PMID: 28715382 Free PMC article. - Accurate, precise modeling of cell proliferation kinetics from time-lapse imaging and automated image analysis of agar yeast culture arrays.
Shah NA, Laws RJ, Wardman B, Zhao LP, Hartman JL 4th. Shah NA, et al. BMC Syst Biol. 2007 Jan 8;1:3. doi: 10.1186/1752-0509-1-3. BMC Syst Biol. 2007. PMID: 17408510 Free PMC article. - Genome-wide analysis of yeast aging.
Sutphin GL, Olsen BA, Kennedy BK, Kaeberlein M. Sutphin GL, et al. Subcell Biochem. 2012;57:251-89. doi: 10.1007/978-94-007-2561-4_12. Subcell Biochem. 2012. PMID: 22094426 Review. - Chemostat-based micro-array analysis in baker's yeast.
Daran-Lapujade P, Daran JM, van Maris AJ, de Winde JH, Pronk JT. Daran-Lapujade P, et al. Adv Microb Physiol. 2009;54:257-311. doi: 10.1016/S0065-2911(08)00004-0. Adv Microb Physiol. 2009. PMID: 18929070 Review. - A picture is worth a thousand words: genomics to phenomics in the yeast Saccharomyces cerevisiae.
Vizeacoumar FJ, Chong Y, Boone C, Andrews BJ. Vizeacoumar FJ, et al. FEBS Lett. 2009 Jun 5;583(11):1656-61. doi: 10.1016/j.febslet.2009.03.068. Epub 2009 Apr 5. FEBS Lett. 2009. PMID: 19351535 Review.
Cited by
- LI Detector: a framework for sensitive colony-based screens regardless of the distribution of fitness effects.
Parikh SB, Castilho Coelho N, Carvunis AR. Parikh SB, et al. G3 (Bethesda). 2021 Feb 9;11(2):jkaa068. doi: 10.1093/g3journal/jkaa068. G3 (Bethesda). 2021. PMID: 33693606 Free PMC article. - ODELAY: A Large-scale Method for Multi-parameter Quantification of Yeast Growth.
Herricks T, Mast FD, Li S, Aitchison JD. Herricks T, et al. J Vis Exp. 2017 Jul 3;(125):55879. doi: 10.3791/55879. J Vis Exp. 2017. PMID: 28715382 Free PMC article. - ODELAM, rapid sequence-independent detection of drug resistance in isolates of Mycobacterium tuberculosis.
Herricks T, Donczew M, Mast FD, Rustad T, Morrison R, Sterling TR, Sherman DR, Aitchison JD. Herricks T, et al. Elife. 2020 May 13;9:e56613. doi: 10.7554/eLife.56613. Elife. 2020. PMID: 32401195 Free PMC article. - ODELAM: Rapid Sequence-independent Detection of Drug Resistance in Mycobacterium tuberculosis Isolates.
Herricks T, Donczew M, Sherman DR, Aitchison JD. Herricks T, et al. Bio Protoc. 2021 May 20;11(10):e4027. doi: 10.21769/BioProtoc.4027. eCollection 2021 May 20. Bio Protoc. 2021. PMID: 34150934 Free PMC article. - Systematic Y2H Screening Reveals Extensive Effector-Complex Formation.
Alcântara A, Bosch J, Nazari F, Hoffmann G, Gallei M, Uhse S, Darino MA, Olukayode T, Reumann D, Baggaley L, Djamei A. Alcântara A, et al. Front Plant Sci. 2019 Nov 14;10:1437. doi: 10.3389/fpls.2019.01437. eCollection 2019. Front Plant Sci. 2019. PMID: 31803201 Free PMC article.
References
MeSH terms
Grants and funding
- P41 GM109824/GM/NIGMS NIH HHS/United States
- P50 GM076547/GM/NIGMS NIH HHS/United States
- R01 GM112108/GM/NIGMS NIH HHS/United States
- U54 RR022220/RR/NCRR NIH HHS/United States
LinkOut - more resources
Full Text Sources
Other Literature Sources
Molecular Biology Databases


