Extending colonic mucosal microbiome analysis-assessment of colonic lavage as a proxy for endoscopic colonic biopsies - PubMed (original) (raw)
Extending colonic mucosal microbiome analysis-assessment of colonic lavage as a proxy for endoscopic colonic biopsies
Euan Watt et al. Microbiome. 2016.
Abstract
Background: Sequencing-based analysis has become a well-established approach to deciphering the composition of the gut microbiota. However, due to the complexity of accessing sufficient material from colonoscopic biopsy samples, most studies have focused on faecal microbiota analysis, even though it is recognised that differences exist between the microbial composition of colonic biopsies and faecal samples. We determined the suitability of colonic lavage samples to see if it had comparable microbial diversity composition to colonic biopsies as they are without the limitations associated with sample size. We collected paired colonic biopsies and lavage samples from subjects who were attending for colorectal cancer screening colonoscopy.
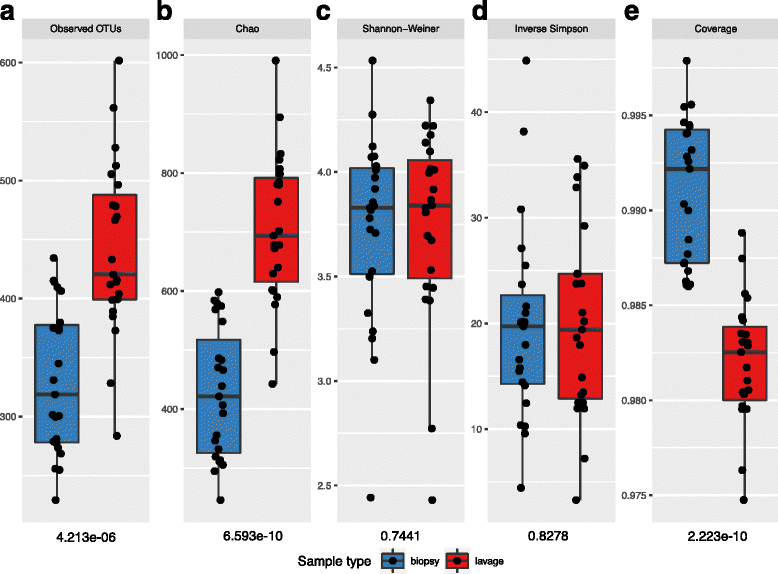
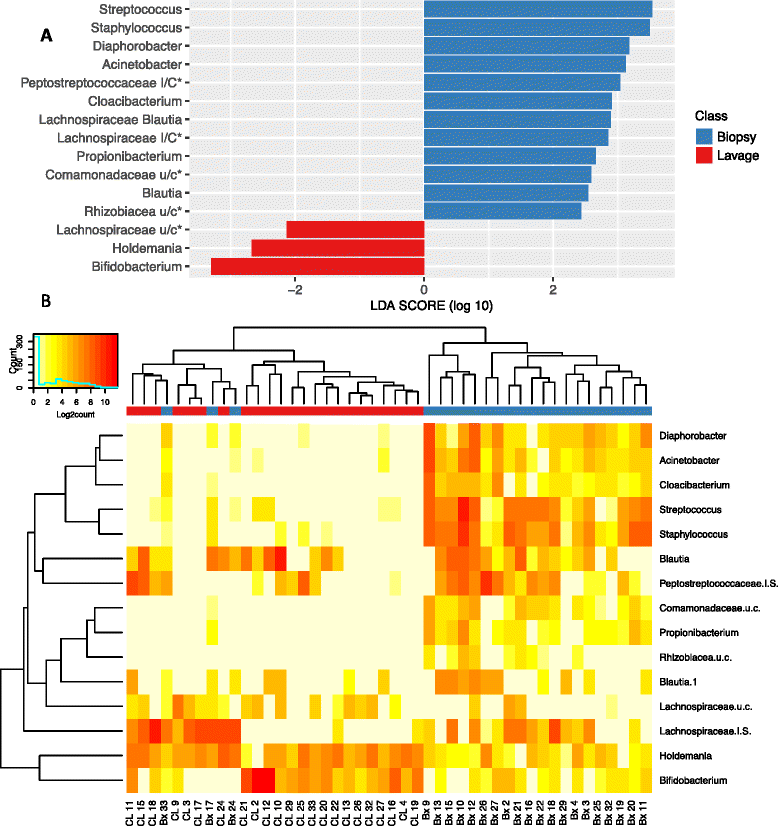
Results: Next-generation sequencing and qPCR validation were performed with multiple bioinformatics analyses to determine the composition and predict function of the microbiota. Colonic lavage samples contained significantly higher numbers of operational taxonomic units (OTUs) compared to corresponding biopsy samples, however, diversity and evenness between lavage and biopsy samples were similar. The differences seen were driven by the presence of 12 OTUs which were in higher relative abundance in biopsies and were either not present or in low relative abundance in lavage samples, whilst a further 3 OTUs were present in higher amounts in the lavage samples compared to biopsy samples. However, predicted functional community profiling based on 16S ribosomal ribonucleic acid (rRNA) data indicated minimal differences between sample types.
Conclusions: We propose that colonic lavage samples provide a relatively accurate representation of biopsy microbiota composition and should be considered where biopsy size is an issue.
Keywords: Colonic biopsies; Colonic lavage; Microbiome analysis; Next-generation sequencing.
Figures
Fig. 1
Species diversity comparison between colonic biopsy and lavage sample. The extent of microbiota structural and composition diversities were measured using (a) Observed OTUs and (b) Chao (species richness), (c) Shannon-Weiner diversity index, (d) inverse Simpson’s evenness index and (e) Good’s coverage (species richness). Alpha diversity scores calculated by subsampling samples to 11000 reads with 1000 iterations. Each point represents the diversity score for a patient sample. Error bars represent SEM. Between-group variations were measured using Mann-Whitney U test. P values of Mann-Whitney U test for each alpha diversity measure are below the relevant facet
Fig. 2
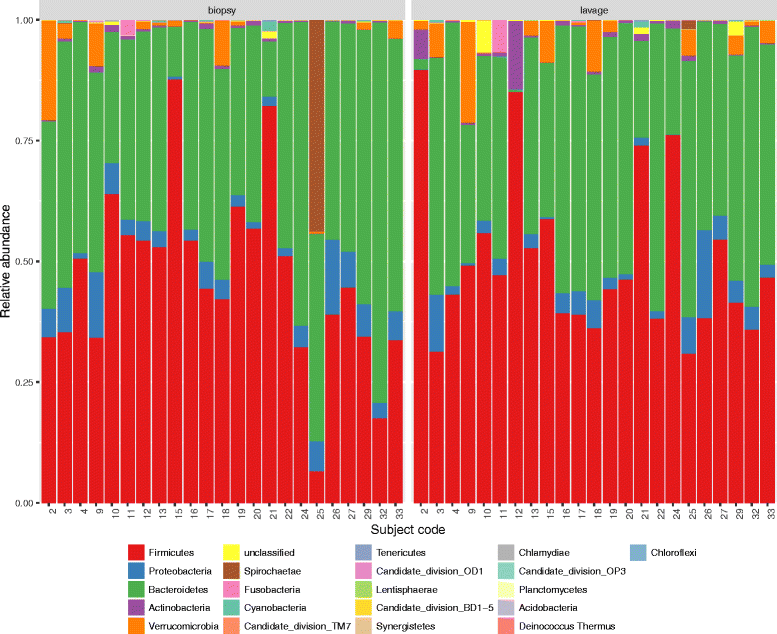
Relative abundance at phylum level for colonic biopsy and lavage samples
Fig. 3
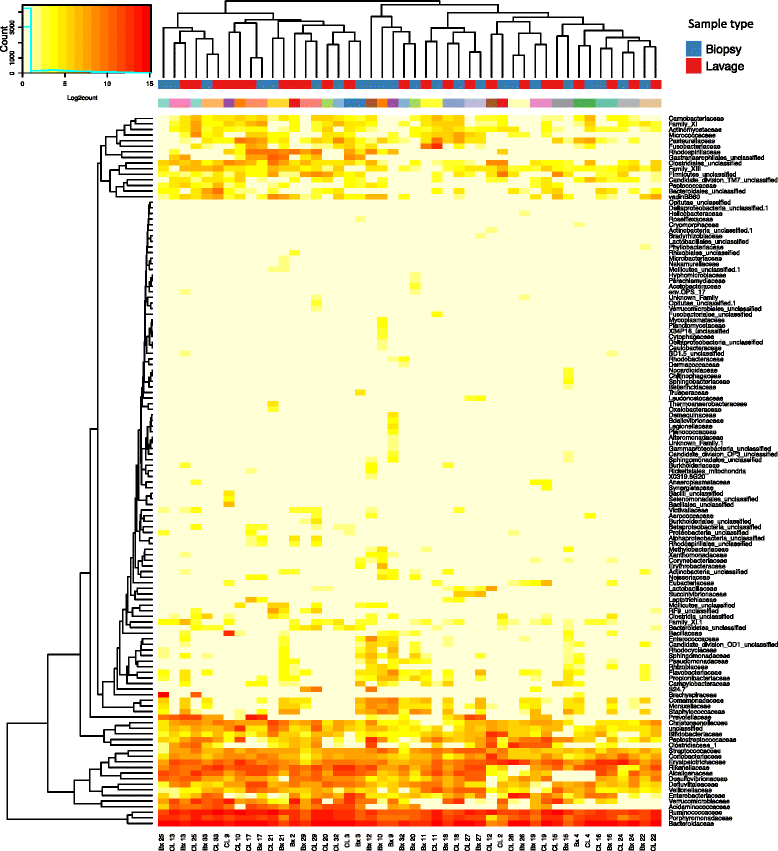
The distribution of bacteria in colonic biopsy and lavage samples at family level. Heat maps show Log2count of sequences within each classification level. Two sets of colours on the column caps: red/blue depicts sample type (red = lavage (CL), blue = biopsy (Bx)). Multicolour panel reflects individual subjects
Fig. 4
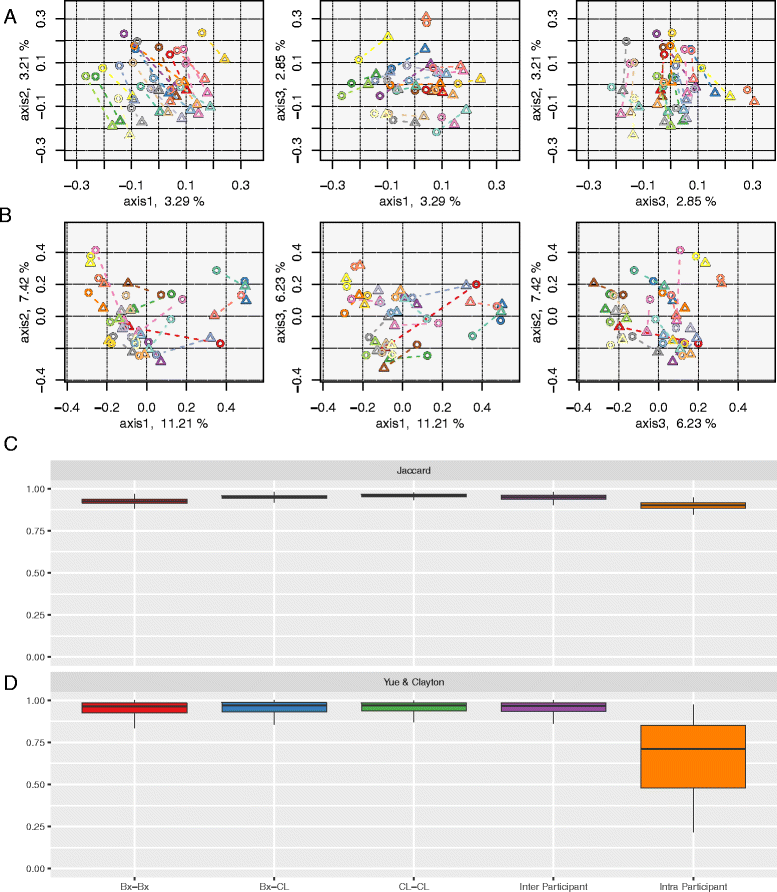
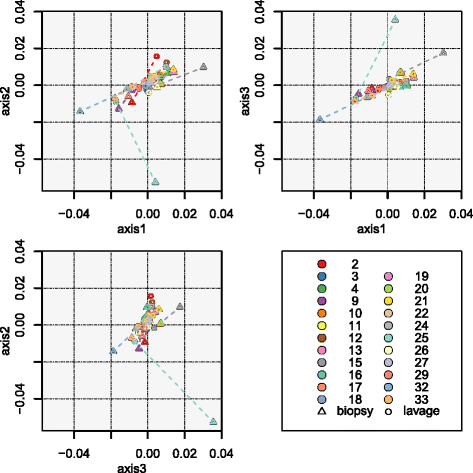
Beta diversity comparisons. Clustering of samples according to sample type (colonic biopsy and lavage) by PCoA, based on (a) Jaccard and (b) Yue & Clayton similarity distances, and box plots of paired samples’ similarity distances, based on (c) Jaccard and (d) Yue & Clayton. Within the PCoA plots, loadings of the three axes sum up to 9.35 and 24.86%. Colonic biopsy and lavage samples from the same individual are connected together. Each subject is depicted in a unique colour, and colonic biopsy points are depicted as triangles whilst lavage samples are circles. Within the box plots, Bx-Bx refers to all pairs of biopsy samples, Bx-CL refers to all biopsy and lavage sample pairs, CL-CL refers to all pairs of lavage samples, inter-participant refers to all pairs of samples between participants, and intra-participant refers to all pairs of samples within participants
Fig. 5
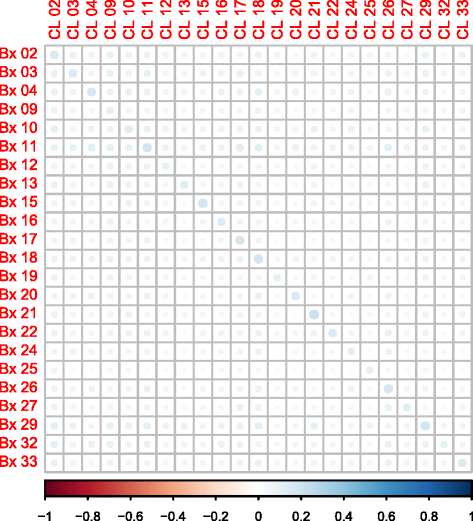
Spearman correlation plot of biopsy against lavage samples using OTU counts. Spearman correlations with non-significant p values (>0.05) were excluded
Fig. 6
Differentially abundant OTUs between biopsy and lavage samples by LefSe. a LEfSe LDA scores. b Heat map of Log2count of OTUs. Colours on the column caps depict sample type (red = lavage (CL), blue = biopsy (Bx)). OTUs were labelled by their genera
Fig. 7
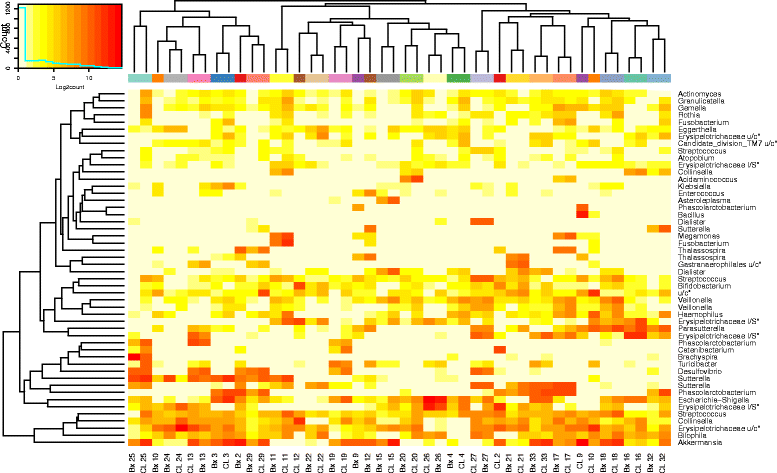
Heat map of Log2count of top 50 OTUs found to not be differentially abundant between biopsy and lavage samples by LEfSe. Colours on the column caps reflect individual subjects
Fig. 8
Clustering of samples’ PICRUSt predicted KEGG pathways according to sample type (colonic biopsy and lavage) by NMDS, based on Yue & Clayton similarity distance. The R-squared configuration of the three axes was equal to 0.94413 with a lowest stress of 0.188611. Colonic biopsy and lavage samples from the same individual are connected together. Each subject is depicted in a unique colour. Colonic biopsy points are depicted as triangles, lavage samples are circles
Similar articles
- Faecal and mucosal microbiota in patients with functional gastrointestinal disorders: Correlation with toll-like receptor 2/toll-like receptor 4 expression.
Dong LN, Wang JP, Liu P, Yang YF, Feng J, Han Y. Dong LN, et al. World J Gastroenterol. 2017 Sep 28;23(36):6665-6673. doi: 10.3748/wjg.v23.i36.6665. World J Gastroenterol. 2017. PMID: 29085211 Free PMC article. - Analysis of colonic mucosa-associated microbiota using endoscopically collected lavage.
Miyauchi E, Taida T, Kawasumi M, Ohkusa T, Sato N, Ohno H. Miyauchi E, et al. Sci Rep. 2022 Feb 2;12(1):1758. doi: 10.1038/s41598-022-05936-y. Sci Rep. 2022. PMID: 35110685 Free PMC article. - Inflammation-related differences in mucosa-associated microbiota and intestinal barrier function in colonic Crohn's disease.
Libertucci J, Dutta U, Kaur S, Jury J, Rossi L, Fontes ME, Shajib MS, Khan WI, Surette MG, Verdu EF, Armstrong D. Libertucci J, et al. Am J Physiol Gastrointest Liver Physiol. 2018 Sep 1;315(3):G420-G431. doi: 10.1152/ajpgi.00411.2017. Epub 2018 May 31. Am J Physiol Gastrointest Liver Physiol. 2018. PMID: 29848021 - Analyses of Intestinal Microbiota: Culture versus Sequencing.
Hiergeist A, Gläsner J, Reischl U, Gessner A. Hiergeist A, et al. ILAR J. 2015;56(2):228-40. doi: 10.1093/ilar/ilv017. ILAR J. 2015. PMID: 26323632 Review. - From Culture to High-Throughput Sequencing and Beyond: A Layperson's Guide to the "Omics" and Diagnostic Potential of the Microbiome.
O'Toole PW, Flemer B. O'Toole PW, et al. Gastroenterol Clin North Am. 2017 Mar;46(1):9-17. doi: 10.1016/j.gtc.2016.09.003. Gastroenterol Clin North Am. 2017. PMID: 28164855 Review.
Cited by
- Comparison of the fecal, cecal, and mucus microbiome in male and female mice after TNBS-induced colitis.
Kozik AJ, Nakatsu CH, Chun H, Jones-Hall YL. Kozik AJ, et al. PLoS One. 2019 Nov 8;14(11):e0225079. doi: 10.1371/journal.pone.0225079. eCollection 2019. PLoS One. 2019. PMID: 31703107 Free PMC article. - Spatial distribution of live gut microbiota and bile acid metabolism in various parts of human large intestine.
Chinda D, Takada T, Mikami T, Shimizu K, Oana K, Arai T, Akitaya K, Sakuraba H, Katto M, Nagara Y, Makino H, Fujii D, Oishi K, Fukuda S. Chinda D, et al. Sci Rep. 2022 Mar 4;12(1):3593. doi: 10.1038/s41598-022-07594-6. Sci Rep. 2022. PMID: 35246580 Free PMC article. - Meta-analysis of 16S rRNA Microbial Data Identified Distinctive and Predictive Microbiota Dysbiosis in Colorectal Carcinoma Adjacent Tissue.
Mo Z, Huang P, Yang C, Xiao S, Zhang G, Ling F, Li L. Mo Z, et al. mSystems. 2020 Apr 14;5(2):e00138-20. doi: 10.1128/mSystems.00138-20. mSystems. 2020. PMID: 32291348 Free PMC article. - Oxidative stress gene expression, DNA methylation, and gut microbiota interaction trigger Crohn's disease: a multi-omics Mendelian randomization study.
Xu S, Li X, Zhang S, Qi C, Zhang Z, Ma R, Xiang L, Chen L, Zhu Y, Tang C, Bourgonje AR, Li M, He Y, Zeng Z, Hu S, Feng R, Chen M. Xu S, et al. BMC Med. 2023 May 11;21(1):179. doi: 10.1186/s12916-023-02878-8. BMC Med. 2023. PMID: 37170220 Free PMC article. - Diversity of the microbiota communities found in the various regions of the intestinal tract in healthy individuals and inflammatory bowel diseases.
Lawal SA, Voisin A, Olof H, Bording-Jorgensen M, Armstrong H. Lawal SA, et al. Front Immunol. 2023 Nov 2;14:1242242. doi: 10.3389/fimmu.2023.1242242. eCollection 2023. Front Immunol. 2023. PMID: 38022505 Free PMC article. Review.
References
- Hansen R, Russell RK, Reiff C, Louis P, McIntosh F, Berry SH, et al. Microbiota of de-novo pediatric IBD: increased Faecalibacterium prausnitzii and reduced bacterial diversity in Crohn’s but not in ulcerative colitis. Am J Gastroenterol. 2012;107(12):1913–22. doi: 10.1038/ajg.2012.335. - DOI - PubMed
Publication types
MeSH terms
Substances
LinkOut - more resources
Full Text Sources
Other Literature Sources
Medical
