Structural insights into the LCIB protein family reveals a new group of β-carbonic anhydrases - PubMed (original) (raw)
Structural insights into the LCIB protein family reveals a new group of β-carbonic anhydrases
Shengyang Jin et al. Proc Natl Acad Sci U S A. 2016.
Abstract
Aquatic microalgae have evolved diverse CO2-concentrating mechanisms (CCMs) to saturate the carboxylase with its substrate, to compensate for the slow kinetics and competing oxygenation reaction of the key photosynthetic CO2-fixing enzyme rubisco. The limiting CO2-inducible B protein (LCIB) is known to be essential for CCM function in Chlamydomonas reinhardtii To assign a function to this previously uncharacterized protein family, we purified and characterized a phylogenetically diverse set of LCIB homologs. Three of the six homologs are functional carbonic anhydrases (CAs). We determined the crystal structures of LCIB and limiting CO2-inducible C protein (LCIC) from C. reinhardtii and a CA-functional homolog from Phaeodactylum tricornutum, all of which harbor motifs bearing close resemblance to the active site of canonical β-CAs. Our results identify the LCIB family as a previously unidentified group of β-CAs, and provide a biochemical foundation for their function in the microalgal CCMs.
Keywords: CO2-concentrating mechanism; LCIB; carbonic anhydrases; limiting-CO2 inducible protein; photosynthesis.
Conflict of interest statement
The authors declare no conflict of interest.
Figures
Fig. 1.
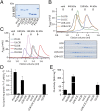
Purification and characterization of LCIB homologs. (A) SDS/PAGE analysis. (B) Gel filtration analysis of recombinant CrLCIB and CrLCIC complexes. LCIB-LCIC was prepared by recombinantly coexpressing CrLCIB and CrLCIC. LCIB+LCIC was prepared by mixing and incubating separately expressed CrLCIB and CrLCIC in vitro. In each experiment, a total of 25 μg per sample was loaded, and the corresponding fractions were separated by SDS/PAGE and are shown below the chromatograph. (C) Gel filtration analysis of diatom and prokaryotic LCIB homologs, with 50 μg per isoform loaded in each experiment. (D) MIMS CA activity assay for LCIB homologs reported as the first-order rate constant for the hydration of CO2 (_k_CA), μmol mg protein−1 s−1 μM CO2−1 at 25 °C. LCIB-LCIC (native), CrLCIB-LCIC complex purified from C. reinhardtii cells. (E) Wilbur–Anderson CA activity assay of the LCIB proteins. Error bars indicate the mean and SD of at least three independent repeats.
Fig. 2.
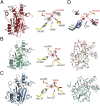
Overall structures, active sites, and comparison of CrLCIB-ΔC, CrLCIC-ΔC, and PtLCIB4 subunits. Zn ion and water are colored in bright red and represented as larger and smaller spheres, respectively. The active site residues are in yellow. The Fo-Fc electron density maps are calculated with omission of the enveloped atoms. The side chains of the residues involved in Zn and water binding are shown as sticks, with C, O, and N atoms colored in yellow, red, and blue, respectively (same as below). Coordination of the Zn ion and polar interactions are indicated by dashed lines. (A) The structure of the PtLCIB4 (red, same as below) and the Zn-binding site. The acetate molecule is shown as sticks, with O atom colored in red. (B) The structure of the CrLCIB-ΔC subunit (green, same as below), an enlarged view of the Zn-binding site and the CrLCIB-ΔC subunit overlaid with PtLCIB4. (C) The structure of the CrLCIC-ΔC subunit (blue, same as below), the Zn-binding site, and the CrLCIC-ΔC subunit overlaid with CrLCIB-ΔC. (D) Active site residue superposition of CrLCIB-ΔC (green), CrLCIC-ΔC (blue), PtCIB4 (red), and PSCA (gray). Zn, water, and acetate are from the PtLCIB4 structure. The dashed lines indicate that those atoms are within interacting distance of the water molecule.
Fig. 3.
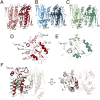
Comparison of dimerization among CrLCIB-ΔC, CrLCIC-ΔC and PtLCIB4. (A–C) The two subunits of the PtLCIB4 dimer (red and pale red), CrLCIC-ΔC dimer (blue and pale blue), and CrLCIB-ΔC (green and pale green) are depicted with one zinc ion per subunit. (D and E) The secondary structure elements of PtLCIB4 (D) and CrLCIB-ΔC (E) involved in dimerization are shown. (F) Comparison of CrLCIB-ΔC and PtLCIB4 dimers by alignment based on one subunit (shown in transparency). Secondary structure elements of CrLCIB-ΔC and PtLCIB4 are labeled in dark green and black, respectively. The intersubunit gap distance is measured as the distance between α2 and α2′ and is highlighted by a curved arrow with the distance indicated. The two loops (Lβ3-α4 and Lβ4-β5) that are clearly defined in PtLCIB4 but disordered in CrLCIB/C-ΔC are shown as ribbons with a thicker radius. An alternative view is also depicted with the dimer rotated 90 degrees around an axis perpendicular to the dimeric axis.
Fig. 4.
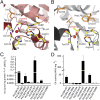
Detailed view of the active site in PtLCIB4 and PSCA, and activity assay. (A and B) The detailed view of the active site in PtLCIB4 (A) and PSCA (B). The two subunits of PSCA from pea P. sativum are colored dark gray and light gray. The side chains of the polar residues at the active site of the two structures are shown as yellow sticks. The hydrophobic residues involved in acetate binding at the active site are shown as orange sticks. (C and D) MIMS (C) and Wilbur–Anderson (D) CA activity assays of PtLCIB4, PtLCIB3, and their mutants are shown. Error bars indicate the mean and SD of at least three independent repeats.
Fig. 5.
Comparison of the positioning of Arg121 and Ser47 in CrLCIB-ΔC, PtLCIB4, and PtLCIB4 S47R mutant. (A) The CrLCIB-ΔC dimer (green) and PtLCIB4 dimer (red) are aligned based on one subunit. The subunit used for alignment in the PtLCIB4 dimer is shown as a gray surface, excluding Zn, its binding residues (Cys46, His102, and Cys126), and Ser47. The residues from the other subunit in proximity to Arg121 (CrLCIB-ΔC) and Ser47 (PtLCIB4) are shown as sticks. The secondary structure elements are labeled in dark green (CrLCIB-ΔC) and black (PtLCIB). (B) Structure of the PtLCIB4 S47R dimer at the mutation site. The two subunits of the mutant dimer are depicted in dark gray and light gray, respectively. Arg47 from both subunits are colored yellow. The 2Fo-Fc electron density map (gray mesh) clearly shows the mutation of Ser47 to arginine. (C and D) The dimer of PtLCIB4 S47R (gray) compared with CrLCIB-ΔC (C, green) and PtLCIB4 (D, red) by alignment based on one subunit (shown in transparency).
Similar articles
- Thylakoid luminal θ-carbonic anhydrase critical for growth and photosynthesis in the marine diatom Phaeodactylum tricornutum.
Kikutani S, Nakajima K, Nagasato C, Tsuji Y, Miyatake A, Matsuda Y. Kikutani S, et al. Proc Natl Acad Sci U S A. 2016 Aug 30;113(35):9828-33. doi: 10.1073/pnas.1603112113. Epub 2016 Aug 16. Proc Natl Acad Sci U S A. 2016. PMID: 27531955 Free PMC article. - Periplasmic carbonic anhydrase CAH1 contributes to high inorganic carbon affinity in Chlamydomonas reinhardtii.
Shimamura D, Ikeuchi T, Matsuda A, Tsuji Y, Fukuzawa H, Mochida K, Yamano T. Shimamura D, et al. Plant Physiol. 2024 Dec 2;196(4):2395-2404. doi: 10.1093/plphys/kiae463. Plant Physiol. 2024. PMID: 39213413 Free PMC article. - Towards assembling functional cyanobacterial β-carboxysomes in Oryza sativa chloroplasts.
Sidhu GK, Pandey R, Kaur G, Singh A, Lenka SK, Reddy PM. Sidhu GK, et al. Funct Integr Genomics. 2025 Jan 3;25(1):5. doi: 10.1007/s10142-024-01518-5. Funct Integr Genomics. 2025. PMID: 39752022 - Depressing time: Waiting, melancholia, and the psychoanalytic practice of care.
Salisbury L, Baraitser L. Salisbury L, et al. In: Kirtsoglou E, Simpson B, editors. The Time of Anthropology: Studies of Contemporary Chronopolitics. Abingdon: Routledge; 2020. Chapter 5. In: Kirtsoglou E, Simpson B, editors. The Time of Anthropology: Studies of Contemporary Chronopolitics. Abingdon: Routledge; 2020. Chapter 5. PMID: 36137063 Free Books & Documents. Review. - Intratympanic corticosteroids for Ménière's disease.
Webster KE, Lee A, Galbraith K, Harrington-Benton NA, Judd O, Kaski D, Maarsingh OR, MacKeith S, Ray J, Van Vugt VA, Westerberg B, Burton MJ. Webster KE, et al. Cochrane Database Syst Rev. 2023 Feb 27;2(2):CD015245. doi: 10.1002/14651858.CD015245.pub2. Cochrane Database Syst Rev. 2023. PMID: 36847608 Free PMC article. Review.
Cited by
- Anthoceros genomes illuminate the origin of land plants and the unique biology of hornworts.
Li FW, Nishiyama T, Waller M, Frangedakis E, Keller J, Li Z, Fernandez-Pozo N, Barker MS, Bennett T, Blázquez MA, Cheng S, Cuming AC, de Vries J, de Vries S, Delaux PM, Diop IS, Harrison CJ, Hauser D, Hernández-García J, Kirbis A, Meeks JC, Monte I, Mutte SK, Neubauer A, Quandt D, Robison T, Shimamura M, Rensing SA, Villarreal JC, Weijers D, Wicke S, Wong GK, Sakakibara K, Szövényi P. Li FW, et al. Nat Plants. 2020 Mar;6(3):259-272. doi: 10.1038/s41477-020-0618-2. Epub 2020 Mar 13. Nat Plants. 2020. PMID: 32170292 Free PMC article. - Pyrenoid Starch Sheath Is Required for LCIB Localization and the CO2-Concentrating Mechanism in Green Algae.
Toyokawa C, Yamano T, Fukuzawa H. Toyokawa C, et al. Plant Physiol. 2020 Apr;182(4):1883-1893. doi: 10.1104/pp.19.01587. Epub 2020 Feb 10. Plant Physiol. 2020. PMID: 32041908 Free PMC article. - DNA-Specific DAPI Staining of the Pyrenoid Matrix During its Fission in Dunaliella salina (Dunal) Teodoresco (Chlorophyta).
Oleksienko AA, Kot YG, Komaristaya VP. Oleksienko AA, et al. Curr Microbiol. 2020 Nov;77(11):3450-3459. doi: 10.1007/s00284-020-02159-0. Epub 2020 Aug 11. Curr Microbiol. 2020. PMID: 32780204 - Physiology of microalgae and their application to sustainable agriculture: A mini-review.
Çakirsoy I, Miyamoto T, Ohtake N. Çakirsoy I, et al. Front Plant Sci. 2022 Nov 17;13:1005991. doi: 10.3389/fpls.2022.1005991. eCollection 2022. Front Plant Sci. 2022. PMID: 36466259 Free PMC article. Review. - CO2-dependent migration and relocation of LCIB, a pyrenoid-peripheral protein in Chlamydomonas reinhardtii.
Yamano T, Toyokawa C, Shimamura D, Matsuoka T, Fukuzawa H. Yamano T, et al. Plant Physiol. 2022 Feb 4;188(2):1081-1094. doi: 10.1093/plphys/kiab528. Plant Physiol. 2022. PMID: 34791500 Free PMC article.
References
- Field CB, Behrenfeld MJ, Randerson JT, Falkowski P. Primary production of the biosphere: Integrating terrestrial and oceanic components. Science. 1998;281(5374):237–240. - PubMed
- Spreitzer RJ, Salvucci ME. Rubisco: Structure, regulatory interactions, and possibilities for a better enzyme. Annu Rev Plant Biol. 2002;53:449–475. - PubMed
- Meyer M, Griffiths H. Origins and diversity of eukaryotic CO2-concentrating mechanisms: Lessons for the future. J Exp Bot. 2013;64(3):769–786. - PubMed
- Giordano M, Beardall J, Raven JA. CO2-concentrating mechanisms in algae: Mechanisms, environmental modulation, and evolution. Annu Rev Plant Biol. 2005;56:99–131. - PubMed
Publication types
MeSH terms
Substances
LinkOut - more resources
Full Text Sources
Other Literature Sources


