Tau prions from Alzheimer's disease and chronic traumatic encephalopathy patients propagate in cultured cells - PubMed (original) (raw)
Tau prions from Alzheimer's disease and chronic traumatic encephalopathy patients propagate in cultured cells
Amanda L Woerman et al. Proc Natl Acad Sci U S A. 2016.
Abstract
Tau prions are thought to aggregate in the central nervous system, resulting in neurodegeneration. Among the tauopathies, Alzheimer's disease (AD) is the most common, whereas argyrophilic grain disease (AGD), corticobasal degeneration (CBD), chronic traumatic encephalopathy (CTE), Pick's disease (PiD), and progressive supranuclear palsy (PSP) are less prevalent. Brain extracts from deceased individuals with PiD, a neurodegenerative disorder characterized by three-repeat (3R) tau prions, were used to infect HEK293T cells expressing 3R tau fused to yellow fluorescent protein (YFP). Extracts from AGD, CBD, and PSP patient samples, which contain four-repeat (4R) tau prions, were transmitted to HEK293 cells expressing 4R tau fused to YFP. These studies demonstrated that prion propagation in HEK cells requires isoform pairing between the infecting prion and the recipient substrate. Interestingly, tau aggregates in AD and CTE, containing both 3R and 4R isoforms, were unable to robustly infect either 3R- or 4R-expressing cells. However, AD and CTE prions were able to replicate in HEK293T cells expressing both 3R and 4R tau. Unexpectedly, increasing the level of 4R isoform expression alone supported the propagation of both AD and CTE prions. These results allowed us to determine the levels of tau prions in AD and CTE brain extracts.
Keywords: Pick’s disease; argyrophilic grain disease; corticobasal degeneration; progressive supranuclear palsy; tauopathies.
Conflict of interest statement
A provisional patent application has been submitted in connection with this work. Inventors include A.L.W., A.A., S.P., S.A.K., S.H.O., and S.B.P.
Figures
Fig. 1.
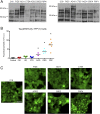
4R tau prions propagate in Tau(4RD*LM)–YFP(1) cells. (A) Crude brain homogenate from 14 patient samples (n = 2 for control, PiD, AD, CTE, AGD, CBD, and PSP) was analyzed for the presence of total tau by Western blot with the Tau12 antibody. (B and C) Tau prions were isolated from human brain homogenates by precipitating protein aggregates with sodium PTA. Protein aggregates were then incubated for 4 d with Tau(4RD*LM)–YFP(1) cells, which express the RD of 4R tau containing the mutations P301L and V337M. This protein fragment is fused to YFP and is expressed in HEK293 cells. (B) Quantification of cell infection using control (n = 6), PiD (n = 6), AD (n = 7), CTE (n = 5), AGD (n = 2), CBD (n = 5), and PSP (n = 6) patient samples. Prions isolated from the 4R tauopathies AGD (P < 0.05), CBD (P < 0.001), and PSP (P < 0.001) showed a significant increase in infectivity over the control samples, whereas PiD (P = 0.74), AD (P = 0.17), and CTE (P = 0.41) did not. Data are shown as the mean from five images per well in six wells. *P < 0.05. All values are shown in Table S2. (C) Representative images of Tau(4RD*LM)–YFP(1) cells infected with AGD, CBD, and PSP but not control, PiD, AD, and CTE patient samples. YFP is shown in green. (Scale bar, 50 μm.)
Fig. 2.
PiD prions infect Tau(3RD*VM)–YFP cells. Tau prions were precipitated from control, PiD, AD, CTE, AGD, CBD, and PSP patient samples using sodium PTA. The resulting protein pellets were incubated for 4 d with Tau(3RD*VM)–YFP cells expressing the repeat domain of 3R tau containing the L266V and V337M mutations and fused to YFP. (A) Quantification of cell infection using control (n = 6), PiD (n = 6), AD (n = 7), CTE (n = 5), AGD (n = 2), CBD (n = 5), and PSP (n = 6) patient samples was determined by summing the total fluorescence in each image and normalizing to the cell count. Prions isolated from PiD alone infected the Tau(3RD*VM)–YFP cells (P < 0.001) compared with controls. AD (P = 0.94), CTE (P = 0.18), AGD (P = 0.81), CBD (P = 0.67), and PSP (P = 0.14) showed no infectivity. Data are shown as the mean of five images per well in six wells. *P < 0.001. All values are shown in Table S2. (B) Representative images of HEK293T cells infected with PiD but not control, AD, CTE, AGD, CBD, or PSP patient samples. YFP is shown in green. (Scale bar, 50 μm.)
Fig. S1.
Tau expression in human tissue samples. Tau prions were isolated from two representative patient samples from each patient group by PTA precipitation. The aggregated proteins were then analyzed by Western blot, probing with the 3R isoform-specific antibody (A) or the total tau antibody, Tau12 (B).
Fig. 3.
Tau prions in AD and CTE contain both 3R and 4R tau isoforms. Tau prions were isolated using sodium PTA from control, PiD, AD, CTE, AGD, CBD, and PSP patient samples and were then incubated with Tau(3RD*VM,4RD*LM)–YFP cells for 4 d. Tau(3RD*VM,4RD*LM)–YFP cells express both the 3R and 4R repeat domains of tau with mutations L266V and V337M (3RD) and P301L and V337M (4RD). (A) Quantification of cell infection using control (n = 6), PiD (n = 6), AD (n = 7), CTE (n = 5), AGD (n = 2), CBD (n = 5), and PSP (n = 6) patient samples was determined by standardizing the total fluorescence in each image to the total cell count. Prions from all six tauopathies, including AD and CTE, infected the Tau(3RD*VM,4RD*LM)–YFP cells, whereas the control samples showed no infection (PiD, P = 0.07; AD, P = 0.05; CTE, P < 0.001; AGD, P < 0.01; CBD, P < 0.001; PSP, P < 0.001). *P < 0.01. Data are shown as the mean from five images per well in six wells. All values are shown in Table S2. (B) Representative images of HEK293T cells infected with PiD, AD, CTE, AGD, CBD, and PSP but not control patient samples. YFP is shown in green. (Scale bar, 50 μm.)
Fig. 4.
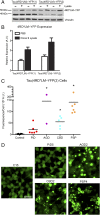
Increased fusion protein expression improves assay sensitivity for 4R tau prions. HEK293T cells with a higher expression of the same fusion protein as the Tau(4RD*LM)–YFP(1) cells were created [Tau(4RD*LM)–YFP(2) cells]. (A) Western blot analysis of Tau(4RD*LM)–YFP(1) and Tau(4RD*LM)–YFP(2) cells in the absence and presence of infection with lysate from clone 9 cells, which stably propagate synthetic tau prions. The 4RD*LM–YFP construct was probed with anti-GFP (green fluorescent protein) antibody (Top). The membrane was reprobed for vinculin as a loading control (Bottom). (B) Quantification of protein expression in the Western blot was performed using ImageJ software (NIH). Expression levels were normalized to basal 4RD*LM–YFP expression in HEK293 cells. Data shown as mean ± SD (n = 2). (C and D) Crude brain homogenates from control (n = 6), PiD (n = 6), AGD (n = 2), CBD (n = 5), and PSP (n = 6) patient samples were diluted in DPBS and incubated with Tau(4RD*LM)–YFP(2) cells for 4 d. (C) Quantification of cell infection after incubation was determined by dividing the total fluorescence in each image by the total cell count. Tau prions from the 4R tauopathies were all capable of infecting the Tau(4RD*LM)–YFP(2) cells (AGD, P < 0.001; CBD, P < 0.05; PSP, P < 0.001), whereas the control samples did not. Of the six PiD samples, two infected the Tau(4RD*LM)–YFP(2) cells (PiD3 and PiD4) and the other four did not (P = 0.41). *P < 0.05. Data are shown as the mean of five images per well in six wells. All values are shown in Table S2. (D) Representative images of HEK293T cells infected with AGD, CBD, and PSP but not control or PiD patient samples. YFP is shown in green. (Scale bar, 50 μm.)
Fig. S2.
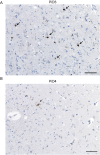
4R tau inclusions in PiD patient samples. Immunostaining with the 4R isoform-specific tau antibody was performed on fixed tissue from the angular gyrus from PiD patients 3 (A) and 4 (B). Both patient samples contained 4R tau-positive lesions (arrows). (Scale bars, 30 µm.)
Fig. 5.
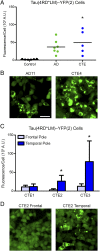
Overexpression of 4R tau supports propagation of AD and CTE prions. Crude brain homogenates from control, AD, and CTE patient samples were diluted in DPBS and incubated for 4 d with Tau(4RD*LM)–YFP(2) cells. (A) Quantification of cell infection with control (n = 6; data also shown in Fig. 4_C_), AD (n = 7), and CTE (n = 5) patient samples. Both AD (P = 0.1) and CTE (P < 0.05) patient samples infected the Tau(4RD*LM)–YFP(2) cells. *P < 0.05. Data are shown as the mean of five images per well in six wells. All values are shown in Table S2. (B) Representative images of HEK293T cells infected with AD and CTE. YFP is shown in green. (Scale bar, 50 μm.) (C) Quantification of cell infection using two brain regions from three CTE patient samples. The frontal pole and temporal pole contain a significantly different concentration of tau prions in two of the CTE patient samples tested. Data are shown as the mean ± SD measured from five images per well in six wells. All values are shown in Table S2. *P < 0.05. (D) Representative images of HEK293T cells infected with samples from the frontal and temporal poles from patient CTE2. YFP is shown in green. The scale is the same as shown in B.
Similar articles
- Tau isoforms are differentially expressed across the hippocampus in chronic traumatic encephalopathy and Alzheimer's disease.
Cherry JD, Esnault CD, Baucom ZH, Tripodis Y, Huber BR, Alvarez VE, Stein TD, Dickson DW, McKee AC. Cherry JD, et al. Acta Neuropathol Commun. 2021 May 12;9(1):86. doi: 10.1186/s40478-021-01189-4. Acta Neuropathol Commun. 2021. PMID: 33980303 Free PMC article. - Novel tau filament fold in corticobasal degeneration.
Zhang W, Tarutani A, Newell KL, Murzin AG, Matsubara T, Falcon B, Vidal R, Garringer HJ, Shi Y, Ikeuchi T, Murayama S, Ghetti B, Hasegawa M, Goedert M, Scheres SHW. Zhang W, et al. Nature. 2020 Apr;580(7802):283-287. doi: 10.1038/s41586-020-2043-0. Epub 2020 Feb 12. Nature. 2020. PMID: 32050258 Free PMC article. - Development of a novel tau propagation mouse model endogenously expressing 3 and 4 repeat tau isoforms.
Hosokawa M, Masuda-Suzukake M, Shitara H, Shimozawa A, Suzuki G, Kondo H, Nonaka T, Campbell W, Arai T, Hasegawa M. Hosokawa M, et al. Brain. 2022 Mar 29;145(1):349-361. doi: 10.1093/brain/awab289. Brain. 2022. PMID: 34515757 - [Neuropathology of tauopathy].
Yoshida M. Yoshida M. Brain Nerve. 2013 Dec;65(12):1445-58. Brain Nerve. 2013. PMID: 24323931 Review. Japanese. - Comparative biochemistry of tau in progressive supranuclear palsy, corticobasal degeneration, FTDP-17 and Pick's disease.
Buée L, Delacourte A. Buée L, et al. Brain Pathol. 1999 Oct;9(4):681-93. doi: 10.1111/j.1750-3639.1999.tb00550.x. Brain Pathol. 1999. PMID: 10517507 Free PMC article. Review.
Cited by
- Aβ and Tau Prions Causing Alzheimer's Disease.
Condello C, Merz GE, Aoyagi A, DeGrado WF, Prusiner SB. Condello C, et al. Methods Mol Biol. 2023;2561:293-337. doi: 10.1007/978-1-0716-2655-9_16. Methods Mol Biol. 2023. PMID: 36399277 - Nasal Extracts from Patients with Alzheimer's Disease Induce Tau Aggregates in a Cellular Model of Tau Propagation.
Pahrudin Arrozi A, Yanagisawa D, Kato T, Akatsu H, Hashizume Y, Kaneda D, Tooyama I. Pahrudin Arrozi A, et al. J Alzheimers Dis Rep. 2021 Apr 6;5(1):263-274. doi: 10.3233/ADR-210298. J Alzheimers Dis Rep. 2021. PMID: 34113783 Free PMC article. - Assessment of the efficacy of different procedures that remove and disassemble alpha-synuclein, tau and A-beta fibrils from laboratory material and surfaces.
Fenyi A, Coens A, Bellande T, Melki R, Bousset L. Fenyi A, et al. Sci Rep. 2018 Jul 17;8(1):10788. doi: 10.1038/s41598-018-28856-2. Sci Rep. 2018. PMID: 30018327 Free PMC article. - Ultrastructural and biochemical classification of pathogenic tau, α-synuclein and TDP-43.
Tarutani A, Adachi T, Akatsu H, Hashizume Y, Hasegawa K, Saito Y, Robinson AC, Mann DMA, Yoshida M, Murayama S, Hasegawa M. Tarutani A, et al. Acta Neuropathol. 2022 Jun;143(6):613-640. doi: 10.1007/s00401-022-02426-3. Epub 2022 May 5. Acta Neuropathol. 2022. PMID: 35513543 Free PMC article. Review. - Cofactors are essential constituents of stable and seeding-active tau fibrils.
Fichou Y, Lin Y, Rauch JN, Vigers M, Zeng Z, Srivastava M, Keller TJ, Freed JH, Kosik KS, Han S. Fichou Y, et al. Proc Natl Acad Sci U S A. 2018 Dec 26;115(52):13234-13239. doi: 10.1073/pnas.1810058115. Epub 2018 Dec 11. Proc Natl Acad Sci U S A. 2018. PMID: 30538196 Free PMC article.
References
- Iqbal K, et al. Defective brain microtubule assembly in Alzheimer’s disease. Lancet. 1986;2(8504):421–426. - PubMed
- Brion J-P, Passareiro H, Nunez J, Flament-Durand J. Mise en évidence immunologique de la protéine tau au niveau des lésions de dégénérescence neurofibrillaire de la maladie d’Alzheimer. Arch Biol (Liege) 1985;95:229–235. French.
Publication types
MeSH terms
Substances
Grants and funding
- P50 AG023501/AG/NIA NIH HHS/United States
- P01 AG002132/AG/NIA NIH HHS/United States
- R37 AG031220/AG/NIA NIH HHS/United States
- P01 AG010770/AG/NIA NIH HHS/United States
- U01 NS086659/NS/NINDS NIH HHS/United States
- P30 AG013846/AG/NIA NIH HHS/United States
- P01 AG019724/AG/NIA NIH HHS/United States
LinkOut - more resources
Full Text Sources
Other Literature Sources
Medical
Miscellaneous


