The Hippo Pathway Kinases LATS1/2 Suppress Cancer Immunity - PubMed (original) (raw)
The Hippo Pathway Kinases LATS1/2 Suppress Cancer Immunity
Toshiro Moroishi et al. Cell. 2016.
Abstract
Poorly immunogenic tumor cells evade host immunity and grow even in the presence of an intact immune system, but the complex mechanisms regulating tumor immunogenicity have not been elucidated. Here, we discovered an unexpected role of the Hippo pathway in suppressing anti-tumor immunity. We demonstrate that, in three different murine syngeneic tumor models (B16, SCC7, and 4T1), loss of the Hippo pathway kinases LATS1/2 (large tumor suppressor 1 and 2) in tumor cells inhibits tumor growth. Tumor regression by LATS1/2 deletion requires adaptive immune responses, and LATS1/2 deficiency enhances tumor vaccine efficacy. Mechanistically, LATS1/2-null tumor cells secrete nucleic-acid-rich extracellular vesicles, which induce a type I interferon response via the Toll-like receptors-MYD88/TRIF pathway. LATS1/2 deletion in tumors thus improves tumor immunogenicity, leading to tumor destruction by enhancing anti-tumor immune responses. Our observations uncover a key role of the Hippo pathway in modulating tumor immunogenicity and demonstrate a proof of concept for targeting LATS1/2 in cancer immunotherapy.
Keywords: B16 melanoma; Hippo; LATS; TAZ; Toll-like receptor; YAP; cancer immunity; exosome; immunotherapy; interferon.
Copyright © 2016 Elsevier Inc. All rights reserved.
Figures
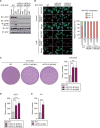
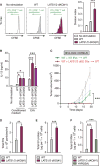
Figure 1. LATS1/2 Deletion Enhances Anchorage-Independent Tumor Cell Growth In Vitro
(A) Wild-type (WT) and two independent clones of LATS1/2 double knockout (dKO) B16-OVA melanoma cells were serum starved or treated with Latrunculin B (LatB) and then subjected to immunoblot (IB) analysis with antibodies to the indicated proteins. (B) LatB-treated or non-treated (control) B16-OVA cells were subjected to immunostaining analysis. YAP/TAZ subcellular localization was determined by immunofluorescence staining for endogenous YAP/TAZ (green) along with DAPI for DNA (blue). Representative images are presented in the left panel. (right panel) Cells in five randomly selected views (~100 cells) were selected for the quantification of YAP/TAZ localization. N, nuclear; C, cytoplasmic. (C) B16-OVA cells were subjected to soft-agar colony-formation assay, and the colonies were stained with crystal violet for quantification. (D) Soft-agar colony-formation assay of SCC7 squamous cell carcinoma cells. (E) Soft-agar colony-formation assay of 4T1 breast cancer cells. Data are presented as means ± SD from three independent experiments (C–E). The p values were determined using a one-way ANOVA test followed by Tukey’s multiple comparison test (C and D) or an unpaired t test (E). **p < 0.01; ***p < 0.001. See also Figure S1.
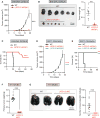
Figure 2. Loss of LATS1/2 in Tumors Inhibits Tumor Growth In Vivo
(A) Equal numbers of WT or LATS1/2 dKO B16-OVA cells were transplanted into C57BL/6 mice, and tumor growth was monitored after the indicated times. Data are presented as means ± SEM; n = 8 tumors for each group. ***p < 0.001, two-way ANOVA test. (B) C57BL/6 mice were injected with WT or LATS1/2 dKO B16-OVA melanoma, and tumor weight was determined 20 days after transplantation. Data are presented as means ± SEM; n = 6 tumors for WT, and n = 8 tumors for LATS1/2 dKO (note that two of the tumors were completely rejected). **p < 0.01, Mann-Whitney test. (C) Kaplan-Meier tumor-free survival curves for mice injected with WT or LATS1/2 dKO B16-OVA cells are shown (n = 14 mice for each group). ***p < 0.001, log-rank test. (D) WT or two independent clones of LATS1/2 dKO SCC7 cells were transplanted into C3H/HeOu mice, and tumor growth was monitored after the indicated times. Data are presented as means ± SEM; n = 8 tumors for each group. The p values were determined using a two-way ANOVA test, comparing each group to the WT group. ***p < 0.001. (E) Kaplan-Meier tumor-free survival curves for mice injected with WT or LATS1/2 dKO SCC7 cells are shown (n = 4 mice for each group). The p values were determined using a log-rank test, comparing each group to the WT group. **p < 0.01. (F and G) In (F), BALB/c mice were injected with WT or LATS1/2 dKO 4T1 cells, and primary tumor weight was determined 28 days after transplantation. (G) WT or LATS1/2 dKO 4T1 cells were transplanted into the mammary fat pad of BALB/c mice, and lung metastasis of the primary tumor was determined 28 days after transplantation. Normal lung tissue was stained with black India ink, whereas tumor nodules remained white. The gross appearance of the lungs (left panel) and the tumor nodules on the lungs (right panel) were examined. Data are presented as means ± SEM; n = 16 tumors in (F), and n = 8 mice in (G) for each group. ***p < 0.001, Mann-Whitney test. See also Figure S2.
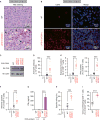
Figure 3. LATS1/2 Deficiency in Tumor Cells Induces Host Anti-tumor Immunity
(A) WT or LATS1/2 dKO B16-OVA melanoma cells were injected into C57BL/6 mice. Tumors were paraffin embedded and stained with H&E 12 days after transplantation. Arrowheads indicate infiltration of inflammatory cells. (B) Frozen sections from WT or LATS1/2 dKO B16-OVA melanomas were subjected to immunostaining analysis of CD45 (red) along with DAPI for DNA (blue). (C) WT and two independent clones of LATS1/2 dKO B16-OVA melanoma cells were subjected to immunoblot (IB) analysis with antibodies to the indicated proteins. (D–F) In (D), C57BL/6 mice were injected (or not injected) with WT or LATS1/2 dKO B16-OVA melanoma cells, and serum anti-OVA IgG concentrations were determined by ELISA 12 days after transplantation. (E) Splenocytes from C57BL/6 mice injected as in (D) were re-stimulated ex vivo with SIINFEKL peptide and then subjected to flow-cytometric analysis. SIINFEKL is an OVA-derived peptide being presented through the major histocompatibility complex class I (MHC class I) molecule H-2Kb. Frequency of CD8+ T cells expressing activation markers, Granzyme B or interferon γ (IFNγ), was determined. (F) Splenocytes from C57BL/6 mice injected as in (D) were subjected to flow-cytometric analysis. OVA-specific CD8+ T cells were quantified using Kb-SIINFEKL tetramers and plotted as a percentage of total CD8+ T cells. Data are presented as means ± SEM; n = 4 mice for the uninjected group, n = 10 mice for the WT-injected group, and n = 10 mice for the LATS1/2 dKO-injected group. ***p < 0.001, one-way ANOVA test followed by Tukey’s multiple comparison test. (G) C57BL/6 mice were injected as in (D), and the inguinal lymph nodes were cultured ex vivo with OVA protein. IFNγ levels in the culture supernatants were determined by ELISA. Data are presented as means ± SEM of triplicate cultures of pooled lymph node cells from 4 mice per group. ***p < 0.001, one-way ANOVA test followed by Tukey’s multiple comparison test. (H) C57BL/6 mice were injected as in (D) and CD8+ T cells were isolated from splenocytes. T cell cytotoxicity assay was performed with CFSE (carboxyfluorescein succinimidyl ester)-labeled EL4 cells ex vivo and the percentage of specific killing was plotted. Data are presented as means ± SEM of five independent experiments with pooled CD8+ T cells from 3–4 mice per group. ***p < 0.001, one-way ANOVA test followed by Tukey’s multiple comparison test. (I) WT or LATS1/2 dKO B16-OVA melanoma cells were injected into C57BL/6 mice, and tumors were subjected to flow-cytometric analysis 12 days after transplantation. Data are presented as means ± SEM of the percentage of CD8+ T cells infiltrating into tumors among total CD45+ cells; n = 4 tumors for each group. ***p < 0.001, unpaired t test. See also Figure S3.
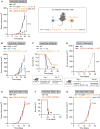
Figure 4. LATS1/2 Deletion in Tumors Stimulates Host Adaptive Immunity and Enhances Tumor Vaccine Efficacy
(A) WT or LATS1/2 dKO B16-OVA melanoma cells were injected into C57BL/6 mice, and tumor growth was monitored after the indicated times (left panel). For co-injection experiments, WT and LATS1/2 dKO cells were injected into opposite flanks in the same mouse (right panel). “WT [with LATS1/2 dKO(#1)]” (blue line) indicates WT tumor growth, and “LATS1/2 dKO(#1) [with WT]” (yellow line) indicates LATS1/2 dKO tumor growth, in the co-injected mice. Data are presented as means ± SEM; n = 8 tumors for WT or LATS1/2 dKO group, n = 6 tumors for each co-injected group. The p value was determined using two-way ANOVA test, comparing the “WT [with LATS1/2 dKO(#1)]” group to the WT group. ***p < 0.001. (B and C) In (B), C57BL/6 mice were immunized intradermally at the base of the tail with equal numbers of irradiated WT or LATS1/2 dKO B16-OVA cells (or PBS control). 12 days after immunization, mice were challenged with WT B16-OVA melanoma, and tumor growth was monitored after the indicated times. Data are presented as means ± SEM; n = 8 tumors for each group. (C) Kaplan-Meier tumor-free survival curves for mice immunized and challenged as in (B) are shown (n = 12 mice for each group). The survival curve of C57BL/6 mice challenged with WT B16-OVA melanoma without vaccination in Figure 2C is also shown in light gray for reference. A schematic representation of vaccination experiment with irradiated-tumor cells is shown in the lower panel. The p value was determined using a two-way ANOVA test (B) or a log-rank test (C), comparing the WT-immunized group [WT / WT] to the LATS1/2 dKO-immunized group [LATS1/2 dKO(#1) / WT]. ***p < 0.001. (D) C3H/HeOu mice were first injected with non-irradiated LATS1/2 dKO SCC7 cells. 60 days after the initial injection, mice designated tumor-free were re-challenged with WT SCC7 cells, and tumor growth was monitored [LATS1/2 dKO(#1) / WT]. The tumor growth curve of WT SCC7 injected into naive C3H/HeOu mice in Figure 2D is also shown in light gray for reference (WT). Data are presented as means ± SEM; n = 8 tumors for each group. ***p < 0.001, two-way ANOVA test. A schematic representation of the rechallenge experiment is shown in the lower panel. (E) WT or LATS1/2 dKO B16-OVA cells were transplanted into _Rag-1_ knockout (KO) mice that lack mature B and T lymphocytes. Tumor growth was monitored after the indicated times. Data are presented as means ± SEM; n = 8 tumors for each group. ns, not significant (p > 0.05, two-way ANOVA test). (F) Kaplan-Meier tumor-free survival curves for mice transplanted as in (E) are shown (n = 10 mice for each group). ns, not significant (p > 0.05, log-rank test). (G) WT and LATS1/2 dKO B16-OVA melanoma cells were injected into opposite flanks in the same Rag-1 KO mouse. Data are presented as means ± SEM; n = 6 tumors for each group. The tumor growth curves shown in (E) are shown in a lighter color for reference. The p value was determined using a two-way ANOVA test, comparing the “WT [with LATS1/2 dKO(#1)]” group to the WT group. ns, not significant (p > 0.05).
Figure 5. EVs Released from LATS1/2-Null Tumor Cells Stimulate Host Immune Responses
(A) Bone marrow-derived dendritic cells (BMDCs) were pretreated with conditioned medium from WT or LATS1/2 dKO B16-OVA melanoma cells (or control medium) and pulsed with OVA protein. BMDCs were then subjected to an in vitro cross-presentation assay using CFSE-labeled CD8+ T cells isolated from OVA-specific T-cell-receptor transgenic OT-I mice. OT-I CD8+ T cells proliferate when stimulated with OVA antigen via cross-presentation by BMDCs, resulting in dilution of CFSE content. Representative histograms of the gated CD8+ T cells are shown in the left panel. The division index was calculated, and data are presented as means ± SEM of three independent experiments in the right panel. ***p < 0.001, one-way ANOVA test followed by Tukey’s multiple comparison test. (B) BMDCs were stimulated with conditioned medium or EVs from WT or LATS1/2 dKO B16-OVA cell culture supernatants, and then IL-12 levels in the culture supernatants were determined by ELISA. Data are presented as means ± SEM; n = 3 independent experiments for conditioned medium stimulation, n = 4 independent experiments for EVs stimulation. *p < 0.05; ***p < 0.001, one-way ANOVA test followed by Tukey’s multiple comparison test. (C) C57BL/6 mice were inoculated with irradiated WT B16-OVA cells at the base of the tail, and EVs freshly isolated from culture supernatants of equal numbers of WT or LATS1/2 dKO B16-OVA cells were injected every 3 days (days 0, 3, 6, and 9). At day 12, mice were challenged with WT B16-OVA melanoma and tumor growth was monitored. Data are presented as means ± SEM; n = 8 tumors for each group. The tumor growth curves shown in Figure 4B are presented in a lighter color for reference. The p value was determined using a two-way ANOVA test, comparing WT EV-immunized group (WT + WT EVs / WT) to LATS1/2 dKO EV-immunized group (WT + LATS1/2 dKO EVs / WT). ***p < 0.001. (D) EVs isolated from culture supernatants of equal numbers of WT or LATS1/2 dKO B16-OVA cells were subjected to nanoparticle tracking analysis (NanoSight) to quantify the number and size distribution. The numbers of particles are presented as means ± SEM of three independent experiments. **p < 0.01, unpaired t test. (E) Protein concentrations of EVs isolated as in (D) were determined. Data are presented as means ± SEM of six independent experiments. ***p < 0.001, unpaired t test. (F) EVs were isolated from culture supernatants of equal numbers of WT, LATS1/2 dKO, or YAP(5SA)-overexpressing B16-OVA cells, and RNA concentrations were determined by Agilent TapeStation. Data are presented as means ± SEM of three independent experiments. ***p < 0.001, one-way ANOVA test followed by Tukey’s multiple comparison test. See also Figures S4, S5, and S6.
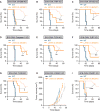
Figure 6. LATS1/2-Deleted Tumor EVs Stimulate Anti-tumor Immunity via the TLRs-Type I IFN Pathway
(A–G) WT or LATS1/2 dKO B16-OVA cells were transplanted into mice deficient in Myd88 (A; n = 12 mice for the WT group, and n = 13 mice for the LATS1/2 dKO group), Ticam1 (also known as TRIF) (B; n = 6 mice for each group), Tmem173 (also known as STING) (C; n = 4 mice for each group), Casp1 (also known as caspase-1) (D; n = 4 mice for the WT group, and n = 5 mice for the LATS1/2 dKO group), Tlr4 (E; n = 9 mice for each group), Tlr7 (F; n = 8 mice for each group), or Tlr9 (G; n = 7 mice for each group), and Kaplan-Meier tumor-free survival curves are shown. The survival curves of WT C57BL/6 mice injected with WT or LATS1/2 dKO B16-OVA in Figure 2C are shown in a lighter color for reference. The p value was determined using a log-rank test, comparing KO mice injected with LATS1/2 dKO B16-OVA cells (orange) to corresponding wild-type C57BL/6 mice injected with LATS1/2 dKO B16-OVA cells (light red). ns, not significant (p > 0.05); *p < 0.05; **p < 0.01; ***p < 0.001. (H) WT or LATS1/2 dKO B16-OVA cells were injected into Ifnar1 KO mice that lack functional type I IFN receptor, and tumor growth was monitored after the indicated times. The tumor growth curves of WT or LATS1/2 dKO B16-OVA cells injected into wild-type C57BL/6 mice in Figure 2A are shown in a lighter color for reference. Data are presented as means ± SEM; n = 8 tumors for each group. (I) Kaplan-Meier tumor-free survival curves for mice injected as in (H) are shown (n = 8 mice for each group). The survival curves of WT C57BL/6 mice injected with WT or LATS1/2 dKO B16-OVA in Figure 2C are shown in a lighter color for reference. The p value was determined using a log-rank test, comparing Ifnar1 KO mice injected with LATS1/2 dKO B16-OVA cells (orange) to corresponding WT C57BL/6 mice injected with LATS1/2 dKO B16-OVA cells (light red). ***p < 0.001. See also Figure S7.
Figure 7. Proposed Model for the Regulation of Anti-tumor Immunity by the Hippo Pathway in Tumors
Poorly immunogenic tumor cells evade host immune defenses, despite expressing antigenic neoepitopes. LATS1/2 deletion in tumor cells stimulates nucleic-acid-rich EV secretion, which induces a type I IFN response via the TLRs-MYD88/TRIF pathway. Type I IFN stimulates multiple components of host immune responses, including cross-presentation of tumor-derived antigens by antigen-presenting cells and T cell activation. Activated T cells, in turn, facilitate tumor-specific responses of cytotoxic T cells and antibody production by B cells, promoting tumor destruction. Thus, loss of LATS1/2 in tumors leads to the rejection of both LATS1/2-deficient and LATS1/2-adequate tumor cells by enhancing host anti-tumor immune responses.
Comment in
- Hippo Wades into Cancer Immunology.
Gebhardt T, Harvey KF. Gebhardt T, et al. Dev Cell. 2016 Dec 19;39(6):635-637. doi: 10.1016/j.devcel.2016.12.010. Dev Cell. 2016. PMID: 27997822 - The large tumor suppressor family: friend or foe?
Kang W, Zhou Y, To KF. Kang W, et al. J Thorac Dis. 2017 Jul;9(7):1748-1751. doi: 10.21037/jtd.2017.06.26. J Thorac Dis. 2017. PMID: 28839954 Free PMC article. No abstract available.
Similar articles
- SUMOylation of large tumor suppressor 1 at Lys751 attenuates its kinase activity and tumor-suppressor functions.
Mei L, Yuan L, Shi W, Fan S, Tang C, Fan X, Yang W, Qian Y, Hussain M, Wu X. Mei L, et al. Cancer Lett. 2017 Feb 1;386:1-11. doi: 10.1016/j.canlet.2016.11.009. Epub 2016 Nov 12. Cancer Lett. 2017. PMID: 27847303 - WWC proteins mediate LATS1/2 activation by Hippo kinases and imply a tumor suppression strategy.
Qi S, Zhu Y, Liu X, Li P, Wang Y, Zeng Y, Yu A, Wang Y, Sha Z, Zhong Z, Zhu R, Yuan H, Ye D, Huang S, Ling C, Xu Y, Zhou D, Zhang L, Yu FX. Qi S, et al. Mol Cell. 2022 May 19;82(10):1850-1864.e7. doi: 10.1016/j.molcel.2022.03.027. Epub 2022 Apr 15. Mol Cell. 2022. PMID: 35429439 - _Lats1/2_-Mediated Alteration of Hippo Signaling Pathway Regulates the Fate of Bone Marrow-Derived Mesenchymal Stem Cells.
Li L, Dong L, Wang Y, Zhang X, Yan J. Li L, et al. Biomed Res Int. 2018 Dec 24;2018:4387932. doi: 10.1155/2018/4387932. eCollection 2018. Biomed Res Int. 2018. PMID: 30671453 Free PMC article. - The LATS1 and LATS2 tumor suppressors: beyond the Hippo pathway.
Furth N, Aylon Y. Furth N, et al. Cell Death Differ. 2017 Sep;24(9):1488-1501. doi: 10.1038/cdd.2017.99. Epub 2017 Jun 23. Cell Death Differ. 2017. PMID: 28644436 Free PMC article. Review. - [Role of Hippo Signaling Pathway in Lung Cancer].
Liu Y, Xing Y, Cai L. Liu Y, et al. Zhongguo Fei Ai Za Zhi. 2017 Sep 20;20(9):629-634. doi: 10.3779/j.issn.1009-3419.2017.09.07. Zhongguo Fei Ai Za Zhi. 2017. PMID: 28935017 Free PMC article. Review. Chinese.
Cited by
- Advances in Understanding the LncRNA-Mediated Regulation of the Hippo Pathway in Cancer.
Wang M, Xu T, Feng W, Liu J, Wang Z. Wang M, et al. Onco Targets Ther. 2021 Apr 7;14:2397-2415. doi: 10.2147/OTT.S283157. eCollection 2021. Onco Targets Ther. 2021. PMID: 33854336 Free PMC article. Review. - Agrin expression is correlated with tumor development and poor prognosis in cholangiocarcinoma.
He M, Cheng C, Tu J, Ji SS, Lou D, Bai B. He M, et al. J Int Med Res. 2021 May;49(5):3000605211009722. doi: 10.1177/03000605211009722. J Int Med Res. 2021. PMID: 34018826 Free PMC article. - An enhanced genetic mutation-based model for predicting the efficacy of immune checkpoint inhibitors in patients with melanoma.
Pan C, Tang H, Wang W, Wu D, Luo H, Xu L, Lin XJ. Pan C, et al. Front Oncol. 2023 Jan 17;12:1077477. doi: 10.3389/fonc.2022.1077477. eCollection 2022. Front Oncol. 2023. PMID: 36733353 Free PMC article. - STRIPAK integrates upstream signals to initiate the Hippo kinase cascade.
Chen R, Xie R, Meng Z, Ma S, Guan KL. Chen R, et al. Nat Cell Biol. 2019 Dec;21(12):1565-1577. doi: 10.1038/s41556-019-0426-y. Epub 2019 Dec 2. Nat Cell Biol. 2019. PMID: 31792377 - Knockout of LATS1 induces neoplastic phenotype in hepatic oval cells.
Sun Q, Wu C, Fu C, Chen P, Chen C, Liu J, Li S, Zheng J. Sun Q, et al. Transl Cancer Res. 2020 May;9(5):3564-3572. doi: 10.21037/tcr-19-2847. Transl Cancer Res. 2020. PMID: 35117720 Free PMC article.
References
- Camargo FD, Gokhale S, Johnnidis JB, Fu D, Bell GW, Jaenisch R, Brummelkamp TR. YAP1 increases organ size and expands undifferentiated progenitor cells. Curr Biol. 2007;17:2054–2060. - PubMed
MeSH terms
Substances
Grants and funding
- HHSN272201400051C/AI/NIAID NIH HHS/United States
- R01 EY022611/EY/NEI NIH HHS/United States
- R01 GM051586/GM/NIGMS NIH HHS/United States
- R35 CA196878/CA/NCI NIH HHS/United States
LinkOut - more resources
Full Text Sources
Other Literature Sources
Molecular Biology Databases
Research Materials
Miscellaneous
