The world's road to water scarcity: shortage and stress in the 20th century and pathways towards sustainability - PubMed (original) (raw)
The world's road to water scarcity: shortage and stress in the 20th century and pathways towards sustainability
M Kummu et al. Sci Rep. 2016.
Abstract
Water scarcity is a rapidly growing concern around the globe, but little is known about how it has developed over time. This study provides a first assessment of continuous sub-national trajectories of blue water consumption, renewable freshwater availability, and water scarcity for the entire 20th century. Water scarcity is analysed using the fundamental concepts of shortage (impacts due to low availability per capita) and stress (impacts due to high consumption relative to availability) which indicate difficulties in satisfying the needs of a population and overuse of resources respectively. While water consumption increased fourfold within the study period, the population under water scarcity increased from 0.24 billion (14% of global population) in the 1900s to 3.8 billion (58%) in the 2000s. Nearly all sub-national trajectories show an increasing trend in water scarcity. The concept of scarcity trajectory archetypes and shapes is introduced to characterize the historical development of water scarcity and suggest measures for alleviating water scarcity and increasing sustainability. Linking the scarcity trajectories to other datasets may help further deepen understanding of how trajectories relate to historical and future drivers, and hence help tackle these evolving challenges.
Figures
Figure 1
Regional (A) and global (B) consumptive water use trends over the 20th century. The filled area represents per capita water consumption trends while the dashed line represents the total water consumption trends. The per capita consumption is divided into different water use sectors. The trend in per capita consumption at the FPU scale is shown as a background. [Adobe Illustrator CS5, ArcGIS 9.2 and Matlab 2015b softwares were used to create the figure;
http://www.adobe.com/products/illustrator.html
,
, and
].
Figure 2
Regional (A) and global (B) water scarcity trajectories. Filled graphs represent the absolute population under water scarcity (in billions) while dashed lines represent the population relative to total regional population. M WStr refers to moderate water stress, H WStr to high water stress, M WSh to moderate water shortage, and H WSh to high water shortage. See definitions of these different water scarcity dimensions, and their combinations, in Table 1 and Fig. 4A. [Adobe Illustrator CS5, ArcGIS 9.2 and Matlab 2015b softwares were used to create the figure;
http://www.adobe.com/products/illustrator.html
,
, and
].
Figure 3
Mapped water scarcity categories for years 1905 (A), 1935 (B), 1965 (C), 1985 (D), and 2005 (E). The definition for each scarcity category is given in Table 1 and Fig. 4A. [Adobe Illustrator CS5 and ArcGIS 9.2 softwares were used to create the figure;
http://www.adobe.com/products/illustrator.html
,
].
Figure 4. Water scarcity matrix (adapted from Falkenmark and Falkenmark et al.17).
(A) the water scarcity categories; and (B) Drivers and alleviation measures. The diagonal lines in tile B refer to per capita consumption isolines. [Adobe Illustrator CS5 –software was used to create the figure;
http://www.adobe.com/products/illustrator.html
].
Figure 5
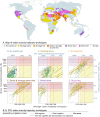
FPU water scarcity trajectories by scarcity archetypes in a map (A) and within the Falkenmark matrix (B–G). Archetypes categorise FPUs according to their water scarcity status (corresponding to position on the plot) and where both shortage and stress occur, according to which occurs first (which is related to the level of per capita consumption). The trajectories are grouped based on irrigation zone they are located in. See Table 2A for definitions and Supplementary Table 2 for percentage of population in each archetype – irrigation zone combination. Note: only FPUs with more than one million people are included. [Adobe Illustrator CS5 and R studio softwares were used to create the figure;
http://www.adobe.com/products/illustrator.html
,
].
Figure 6. FPU water scarcity trajectory shapes.
(A and B) FPU shapes shown as map, separated according to whether scarcity has been experienced (B) or not (A). (C) Examples of shapes of FPU water scarcity trajectories. The diagonal lines refer to per capita consumption isolines and numbers to FPUs (location indicated in tile B). See Table 2B for definition of each shape category and Supplementary Fig. 2 for each FPU trajectory categorised by their shape. [Adobe Illustrator CS5 and R studio softwares were used to create the figure;
http://www.adobe.com/products/illustrator.html
,
].
Figure 7
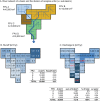
Water availability calculations in a large basin with several FPUs, i.e. each FPU is a sub-basin for the large basin. A: schematic illustration of a basin with four FPUs; B: Runoff of each grid cell in km3 yr−1; and C: discharge of each grid cell in km3 yr−1. The share of available water resources is calculated as the sum of discharges of each grid cell within an SBA divided by the sum of discharges of all grid cells within a basin. The available water resources are then calculated by multiplying that share with the total available runoff of the whole basin. [Adobe Illustrator CS5 –software was used to create the figure;
http://www.adobe.com/products/illustrator.html
]
Similar articles
- Water scarcity hotspots travel downstream due to human interventions in the 20th and 21st century.
Veldkamp TIE, Wada Y, Aerts JCJH, Döll P, Gosling SN, Liu J, Masaki Y, Oki T, Ostberg S, Pokhrel Y, Satoh Y, Kim H, Ward PJ. Veldkamp TIE, et al. Nat Commun. 2017 Jun 15;8:15697. doi: 10.1038/ncomms15697. Nat Commun. 2017. PMID: 28643784 Free PMC article. - Four billion people facing severe water scarcity.
Mekonnen MM, Hoekstra AY. Mekonnen MM, et al. Sci Adv. 2016 Feb 12;2(2):e1500323. doi: 10.1126/sciadv.1500323. eCollection 2016 Feb. Sci Adv. 2016. PMID: 26933676 Free PMC article. - The makings of a water crisis.
Darmon A. Darmon A. Unesco Sources. 1996 Nov;(84):12-3. Unesco Sources. 1996. PMID: 12295782 - Is Desalination a Solution to Freshwater Scarcity in Developing Countries?
Dhakal N, Salinas-Rodriguez SG, Hamdani J, Abushaban A, Sawalha H, Schippers JC, Kennedy MD. Dhakal N, et al. Membranes (Basel). 2022 Mar 31;12(4):381. doi: 10.3390/membranes12040381. Membranes (Basel). 2022. PMID: 35448351 Free PMC article. Review. - Workforce Innovations to Expand the Capacity for Surgical Services.
Bergström S, McPake B, Pereira C, Dovlo D. Bergström S, et al. In: Debas HT, Donkor P, Gawande A, Jamison DT, Kruk ME, Mock CN, editors. Essential Surgery: Disease Control Priorities, Third Edition (Volume 1). Washington (DC): The International Bank for Reconstruction and Development / The World Bank; 2015 Apr 2. Chapter 17. In: Debas HT, Donkor P, Gawande A, Jamison DT, Kruk ME, Mock CN, editors. Essential Surgery: Disease Control Priorities, Third Edition (Volume 1). Washington (DC): The International Bank for Reconstruction and Development / The World Bank; 2015 Apr 2. Chapter 17. PMID: 26741003 Free Books & Documents. Review.
Cited by
- Metal-Organic Frameworks and Their Composites for Environmental Applications.
Zhang Q, Yang H, Zhou T, Chen X, Li W, Pang H. Zhang Q, et al. Adv Sci (Weinh). 2022 Nov;9(32):e2204141. doi: 10.1002/advs.202204141. Epub 2022 Sep 14. Adv Sci (Weinh). 2022. PMID: 36106360 Free PMC article. Review. - Advances in light system engineering across the phototrophic spectrum.
Dennis G, Posewitz MC. Dennis G, et al. Front Plant Sci. 2024 Feb 12;15:1332456. doi: 10.3389/fpls.2024.1332456. eCollection 2024. Front Plant Sci. 2024. PMID: 38410727 Free PMC article. Review. - A Precipitation Recycling Network to Assess Freshwater Vulnerability: Challenging the Watershed Convention.
Keune J, Miralles DG. Keune J, et al. Water Resour Res. 2019 Nov;55(11):9947-9961. doi: 10.1029/2019WR025310. Epub 2019 Nov 28. Water Resour Res. 2019. PMID: 32025063 Free PMC article. - Constructing the Ecological Security Pattern of Nujiang Prefecture Based on the Framework of "Importance-Sensitivity-Connectivity".
Li Y, Zhao J, Yuan J, Ji P, Deng X, Yang Y. Li Y, et al. Int J Environ Res Public Health. 2022 Aug 31;19(17):10869. doi: 10.3390/ijerph191710869. Int J Environ Res Public Health. 2022. PMID: 36078587 Free PMC article. - The Planet's Stressed River Basins: Too Much Pressure or Too Little Adaptive Capacity?
Varis O, Taka M, Kummu M. Varis O, et al. Earths Future. 2019 Oct;7(10):1118-1135. doi: 10.1029/2019EF001239. Epub 2019 Oct 8. Earths Future. 2019. PMID: 31894201 Free PMC article.
References
- Falkenmark M. Growing water scarcity in agriculture: future challenge to global water security. Philosophical Transactions of the Royal Society A: Mathematical, Physical and Engineering Sciences 371 (2013). - PubMed
- Rockström J. et al.. A safe operating space for humanity. Nature 461, 472–475 (2009). - PubMed
- Dearing J. A. et al.. Safe and just operating spaces for regional social-ecological systems. Global Environmental Change 28, 227–238 (2014).
- Gerten D., Hoff H., Rockström J., Jägermeyr J., Kummu M. & Pastor A. V. Towards a revised planetary boundary for consumptive freshwater use: role of environmental flow requirements. Current Opinion in Environmental Sustainability 5, 551–558 (2013).
Publication types
LinkOut - more resources
Full Text Sources
Other Literature Sources


