Dynamic Changes in Chromatin Accessibility Occur in CD8+ T Cells Responding to Viral Infection - PubMed (original) (raw)
Dynamic Changes in Chromatin Accessibility Occur in CD8+ T Cells Responding to Viral Infection
James P Scott-Browne et al. Immunity. 2016.
Abstract
In response to acute infection, naive CD8+ T cells expand, differentiate into effector cells, and then contract to a long-lived pool of memory cells after pathogen clearance. During chronic infections or in tumors, CD8+ T cells acquire an "exhausted" phenotype. Here we present genome-wide comparisons of chromatin accessibility and gene expression from endogenous CD8+ T cells responding to acute and chronic viral infection using ATAC-seq and RNA-seq techniques. Acquisition of effector, memory, or exhausted phenotypes was associated with stable changes in chromatin accessibility away from the naive T cell state. Regions differentially accessible between functional subsets in vivo were enriched for binding sites of transcription factors known to regulate these subsets, including E2A, BATF, IRF4, T-bet, and TCF1. Exhaustion-specific accessible regions were enriched for consensus binding sites for NFAT and Nr4a family members, indicating that chronic stimulation confers a unique accessibility profile on exhausted cells.
Copyright © 2016 Elsevier Inc. All rights reserved.
Figures
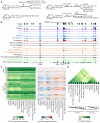
Figure 1. High ATAC-seq signal in CD8+ T cells at conserved regions in promoters and distal regulatory elements
A) CD8+ T cell populations collected for ATAC-seq comparison. B) Mean ATAC-seq coverage at the 70kb Ifng locus with a scale of 0-1200 for all tracks. C) k-means clustered heat map of mean normalized counts or log2 fold-change from global mean at all peaks. D) Pairwise euclidian distance comparison of asinh transformed ATAC-seq signal per peak for all populations using all peaks accessible in at least one cell type. Data in B,C,D are from mean of at least 2 independent samples, except for a single d35 KLRG1+ replicate. See also Figure S1.
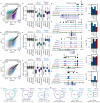
Figure 2. Dynamic changes in chromatin accessibility occur in antigen specific effector and memory CD8+ T cells responding to acute viral infection
A–C) Scatterplots of mean ATAC-seq counts per peak comparing the indicated samples. D–F) Boxplots of ATAC-seq counts per peak from the indicated samples (labeled at bottom) at common or differentially-accessible regions from the comparison labeled above. Box indicates interquartile range with whiskers +/−1.5 times this range and outlier points. G–K) Mean ATAC-seq coverage at Il7r (G), Ccr7 (H), Gzma (I), Gzmk (J), Dmrta1 (K) loci with a scale of 0-1200 (left) or RNA-seq gene expression for the indicated genes (right). L,M) Venn diagrams illustrating intersection of differentially-accessible regions from pairwise comparisons of naive, effector, and memory CD8+ T cells characterizing regions “specific” to a subset (L) or “not” in a subset (M) with p values and odds ratios from Fisher's test comparisons. ATAC-seq data in A–K are from at least 2 independent replicates. RNA-seq data in G–K are mean of two independent replicates for RNA-seq. See also Figure S2.
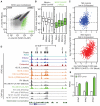
Figure 3. Memory precursor effector cells are similar to short lived effector cells with a slight bias towards memory
A) Scatterplot of mean ATAC-seq counts per peak comparing the SLEC and MPEC. B) Boxplot of ATAC-seq counts per peak from the indicated samples (labeled at bottom) at common or differentially-accessible regions from the comparison labeled above. Box indicates interquartile range with whiskers +/−1.5 times this range and outlier points. C) Histograms of the log2 fold-change between effector and memory cells at (top) or SLEC and MPEC (bottom) at regions differentially-accessible between effector and memory. D) Mean ATAC-seq coverage at Klrg1 and Aurkb loci with a scale of 0-1200_._ E) RNA-seq gene expression for Klrg1 and Aurkb. Data in A–D are from 3 independent replicates and E is mean of 2 independent replicates. See also Figure S3.
Figure 4. Chronic activation profile identified by comparison of viral antigen specific effector, memory, and exhausted CD8+ T cells
A,B) Scatterplots of mean ATAC-seq counts per peak comparing the indicated samples. C,D) Boxplots of ATAC-seq counts per peak from the indicated samples (labeled at bottom) at common or differentially-accessible regions from the comparison labeled above. Box indicates interquartile range with whiskers +/−1.5 times this range and outlier points. E–G) Mean ATAC-seq coverage at _Havcr2 (E), Tox2 (F), and Satb1 (_G) loci with a scale of 0-1200 (left) or RNA-seq gene expression for the indicated genes (right). H,I) Venn diagrams illustrating intersection of differentially-accessible regions from pairwise comparisons of effector, memory, and exhausted CD8+ T cells characterizing regions “specific” to a subset (H) or “not” in a subset (I) with p values and odds ratios from Fisher's test comparisons. ATAC-seq data in A–G are from at least 2 independent replicates. RNA-seq data in E–G are mean of two independent replicates. See also Figure S4.
Figure 5. Differentially-accessible regions in CD8+ T cells are associated with bhLH, bZIP, HMG, T-box, NR, and RHD family TFs
A) Two dimensional multidimensional scaling plot of ATAC-seq signal for all replicates of naive, effector, SLEC, MPEC, memory, and exhausted cells at 18,043 regions differentially-accessible regions identified from comparisons of naive, effector, memory, and exhausted cells. B) k-means clustered log2 fold-change from mean ATAC-seq signal for all differentially-accessible regions identified from comparisons between naive, effector, SLEC, MPEC, memory, and exhausted CD8+ T cells. C) Enrichment of all known motifs within each cluster of differentially-accessible regions compared to all accessible regions in naive, effector, memory, and exhausted CD8+ T cells. All motifs with an enrichment log p-value less than −15 and found in 10% or more regions in at least one cluster are shown. D) Percent of each cluster of ATAC-seq peaks that overlap ChIP-seq peaks or the percent of all differentially-accessible regions in each cluster. The total number of ChIP-seq peaks for each TF and the fraction of these that overlap any of these differentially-accessible regions are shown below the plot. E) log2 fold-change from mean RNA-seq counts per transcript are shown for all expressed TFs from families associated with each enriched motif. F) MeDIP-seq coverage compared to input for naive and effector CD8+ T cells 8 days after LCMV Arm5 infection. The top graph is for all accessible regions in CD8+ T cells, where each graph below is associated with the clusters indicated at left in panel B. ATAC-seq data in A and B are mean of at least 2 independent replicates and RNA-seq data in E are mean of 2 independent replicates. See also Figure S5.
Figure 6. Constitutively active NFAT partially recapitulates the chronic activation profile in vitro
A) Scatterplot of ATAC-seq counts per peak comparing in vitro cultured CD8+ T cells after transduction with retroviruses expressing the NFAT-CA-RIT mutant or left untransduced (Mock). B) Boxplots of ATAC-seq counts per peak in naive, effector, memory, and exhausted CD8+ T cells at common or differentially-accessible regions between Mock and NFAT-CA-RIT mutant expressing cells. Box indicates interquartile range with whiskers +/−1.5 times this range and outlier points. C) Scatter plot of NFAT-CA-RIT ChIP-seq coverage with log2 fold-change ATAC-seq signal between Mock and NFAT-CA-RIT mutant expressing cells at regions with lower (top) or higher (bottom) ATAC-seq signal in exhausted compared to effector and memory CD8+ T cells. D) Mean ATAC-seq and NFAT ChIP-seq coverage at the Pdcd1 locus with a scale of 0-1200 for ATAC-seq tracks. E) Nr4 family member gene expression in CD8+ T cells over-expressing the NFAT-CA-RIT mutant or left untransduced (Mock) showing mean plus range. ATAC-seq data in A–D are from at least 2 independent replicates. See also Figure S6.
Similar articles
- Cutting Edge: Chromatin Accessibility Programs CD8 T Cell Memory.
Scharer CD, Bally AP, Gandham B, Boss JM. Scharer CD, et al. J Immunol. 2017 Mar 15;198(6):2238-2243. doi: 10.4049/jimmunol.1602086. Epub 2017 Feb 8. J Immunol. 2017. PMID: 28179496 Free PMC article. - Transcription Factor IRF4 Promotes CD8+ T Cell Exhaustion and Limits the Development of Memory-like T Cells during Chronic Infection.
Man K, Gabriel SS, Liao Y, Gloury R, Preston S, Henstridge DC, Pellegrini M, Zehn D, Berberich-Siebelt F, Febbraio MA, Shi W, Kallies A. Man K, et al. Immunity. 2017 Dec 19;47(6):1129-1141.e5. doi: 10.1016/j.immuni.2017.11.021. Epub 2017 Dec 12. Immunity. 2017. PMID: 29246443 - Transient expression of ZBTB32 in anti-viral CD8+ T cells limits the magnitude of the effector response and the generation of memory.
Shin HM, Kapoor VN, Kim G, Li P, Kim HR, Suresh M, Kaech SM, Wherry EJ, Selin LK, Leonard WJ, Welsh RM, Berg LJ. Shin HM, et al. PLoS Pathog. 2017 Aug 21;13(8):e1006544. doi: 10.1371/journal.ppat.1006544. eCollection 2017 Aug. PLoS Pathog. 2017. PMID: 28827827 Free PMC article. - Transcription factor regulation of CD8+ T-cell memory and exhaustion.
Angelosanto JM, Wherry EJ. Angelosanto JM, et al. Immunol Rev. 2010 Jul;236:167-75. doi: 10.1111/j.1600-065X.2010.00927.x. Immunol Rev. 2010. PMID: 20636816 Review. - Stability and flexibility in chromatin structure and transcription underlies memory CD8 T-cell differentiation.
Diao H, Pipkin M. Diao H, et al. F1000Res. 2019 Jul 31;8:F1000 Faculty Rev-1278. doi: 10.12688/f1000research.18211.1. eCollection 2019. F1000Res. 2019. PMID: 31448086 Free PMC article. Review.
Cited by
- Systems immunology approaches to study T cells in health and disease.
Yang A, Poholek AC. Yang A, et al. NPJ Syst Biol Appl. 2024 Oct 9;10(1):117. doi: 10.1038/s41540-024-00446-1. NPJ Syst Biol Appl. 2024. PMID: 39384819 Free PMC article. Review. - DNA methylation profiling identifies TBKBP1 as potent amplifier of cytotoxic activity in CMV-specific human CD8+ T cells.
Yu Z, Sasidharan-Nair V, Buchta T, Bonifacius A, Khan F, Pietzsch B, Ahmadi H, Beckstette M, Niemz J, Hilgendorf P, Mausberg P, Keller A, Falk C, Busch DH, Schober K, Cicin-Sain L, Müller F, Brinkmann MM, Eiz-Vesper B, Floess S, Huehn J. Yu Z, et al. PLoS Pathog. 2024 Sep 26;20(9):e1012581. doi: 10.1371/journal.ppat.1012581. eCollection 2024 Sep. PLoS Pathog. 2024. PMID: 39325839 Free PMC article. - MOI is a comprehensive database collecting processed multi-omics data associated with viral infection.
Guo X, Zhao Y, You F. Guo X, et al. Sci Rep. 2024 Jun 26;14(1):14725. doi: 10.1038/s41598-024-65629-6. Sci Rep. 2024. PMID: 38926513 Free PMC article. - Principles and therapeutic applications of adaptive immunity.
Chi H, Pepper M, Thomas PG. Chi H, et al. Cell. 2024 Apr 25;187(9):2052-2078. doi: 10.1016/j.cell.2024.03.037. Cell. 2024. PMID: 38670065 Free PMC article. Review. - PU.1 and BCL11B sequentially cooperate with RUNX1 to anchor mSWI/SNF to poise the T cell effector landscape.
Gamble N, Bradu A, Caldwell JA, McKeever J, Bolonduro O, Ermis E, Kaiser C, Kim Y, Parks B, Klemm S, Greenleaf WJ, Crabtree GR, Koh AS. Gamble N, et al. Nat Immunol. 2024 May;25(5):860-872. doi: 10.1038/s41590-024-01807-y. Epub 2024 Apr 17. Nat Immunol. 2024. PMID: 38632339 Free PMC article.
References
- Barber DL, Wherry EJ, Masopust D, Zhu B, Allison JP, Sharpe AH, Freeman GJ, Ahmed R. Restoring function in exhausted CD8 T cells during chronic viral infection. Nature. 2006;439:682–687. - PubMed
Publication types
MeSH terms
Substances
LinkOut - more resources
Full Text Sources
Other Literature Sources
Molecular Biology Databases
Research Materials


