Blockade of Metallothioneins 1 and 2 Increases Skeletal Muscle Mass and Strength - PubMed (original) (raw)
. 2017 Feb 15;37(5):e00305-16.
doi: 10.1128/MCB.00305-16. Print 2017 Mar 1.
Anais Bouzan 1, Eliane Pierrel 1, Stefan Melly 1, Daniela Stauffer 1, Sabine Gutzwiller 1, Erin Nolin 2, Christina Dornelas 2, Christy Fryer 2, Juliet Leighton-Davies 1, David J Glass 3, Brigitte Fournier 4
Affiliations
- PMID: 27956698
- PMCID: PMC5311239
- DOI: 10.1128/MCB.00305-16
Blockade of Metallothioneins 1 and 2 Increases Skeletal Muscle Mass and Strength
Serge Summermatter et al. Mol Cell Biol. 2017.
Abstract
Metallothioneins are proteins that are involved in intracellular zinc storage and transport. Their expression levels have been reported to be elevated in several settings of skeletal muscle atrophy. We therefore investigated the effect of metallothionein blockade on skeletal muscle anabolism in vitro and in vivo We found that concomitant abrogation of metallothioneins 1 and 2 results in activation of the Akt pathway and increases in myotube size, in type IIb fiber hypertrophy, and ultimately in muscle strength. Importantly, the beneficial effects of metallothionein blockade on muscle mass and function was also observed in the setting of glucocorticoid addition, which is a strong atrophy-inducing stimulus. Given the blockade of atrophy and the preservation of strength in atrophy-inducing settings, these results suggest that blockade of metallothioneins 1 and 2 constitutes a promising approach for the treatment of conditions which result in muscle atrophy.
Keywords: muscle metabolism.
Copyright © 2017 American Society for Microbiology.
Figures
FIG 1
Metallothionein-1 and -2 expression and total zinc are increased in sarcopenic muscle. (A) Increase expression of MT-1 and -2 in sarcopenia. Relative mRNA levels of MT-1 and MT-2 in gastrocnemius of rats aged from 6 to 27 months were assessed by RT-PCR. Values are expressed as means ± SEMs for 8 to 10 mice. Statistical analysis was performed using ANOVA plus the Bonferroni test. *, P < 0.05; **, P < 0.01; ***, P < 0.001 versus 6 months for 24 months and 27 months. (B) Increase in total zinc level in gastrocnemius muscle of rats with sarcopenia. Total zinc was measured in gastrocnemius of rats aged 6 to 27 months as indicated in Materials and Methods. All values are expressed as means ± SEMs for 10 to 12 mice. Statistical analysis was performed by unpaired t test. ****, P < 0.0001. ns, not significant. (C) Zinc modulates MT-1 and -2 mRNA expression in human myotubes. Human myotubes were treated with increasing doses of zinc sulfate (ZnSO4), as indicated, for 24 h. MT-1 and MT-2 mRNA expression levels were monitored using real-time PCR as indicated in Materials and Methods. Data are expressed as relative mRNA expression (n = 2). Statistical analysis was performed using two-way ANOVA. ***, P < 0.001; ****, P < 0.0001.
FIG 2
MT-1 and MT-2 silencing increases the Akt pathway activity and myotube diameter in human skeletal muscle cells. (A) Zinc pyrithione triggers the Akt/TOR pathway in human skeletal myotubes. The kinetics of phosphorylation for Akt, GSK3β, and S6RP after treatment of myotubes with 0.5 μM zinc pyrithione was monitored using MSD technology as described in Materials and Methods. Values are expressed as means ± SEMs (n = 2) of the phosphorylation signal; statistical analysis was performed using one-way ANOVA. **, P < 0.01; ***, P < 0.001; ****, P < 0.0001. (B) Silencing of MT-1 and MT-2 in human skeletal muscle myotubes. Human skeletal cells were transfected with control siNT (nontarget), with siMT-1 or siMT-2 alone, or with both siMT-1 and MT-2 for 24 h. Values are expressed as relative mRNA expression. Relative levels were calculated by giving an arbitrary value of 100% to the nontarget control. (C) MT-1 and -2 silencing triggers the Akt/TOR pathway in human skeletal myotubes. Myotubes were subjected to a control siRNA or siRNA to MT-1 and MT-2 and treated with a vehicle or 10 μM dexamethasone for 24 h. Phosphorylation of Akt, GSK3β, and S6RP was monitored as indicated using MSD technology as described in Materials and Methods. Values are expressed as mean percentage of phosphorylation signal over expression of total Akt and GSK3β, except for S6RP values, expressed as means ± SEMs (n = 3) of the phosphorylation signal. Statistical analysis was performed using two-way ANOVA with post hoc Dunnett test. *, P < 0.05; **, P < 0.01. (D) In vitro MT-1 and MT-2 silencing increases the Akt pathway leading to increased myotube size. Myotubes were subjected to a control siRNA or siRNA to MT-1 and MT-2 and treated with a vehicle or 10 μM dexamethasone for 24 h. Values are expressed as means ± SEMs of thick-myotube percentage (n = 2). Statistical analysis was performed using two-way ANOVA with post hoc Dunnett test. *, P < 0.05; **, P < 0.01; ***, P < 0.001. (E) Increase in myotube size after MT-1 and MT-2 silencing is Akt dependent. Myotubes were transfected with a control siRNA (siRNA NT) or siRNA to MT-1 and MT-2 for 24 h and treated with a vehicle or 25 μM API-2 (Akt inhibitor) for another 24 h. Values are expressed as means ± SEMs of thick-myotube percentage (n = 2). Statistical analysis was performed using two-way ANOVA with post hoc Dunnett test. *, P < 0.05; **, P < 0.01.
FIG 3
Body weight (A), lean mass (B), and fat mass (C) in control and MT-null mice. All values are expressed as means ± SEs for 13 mice. Statistical analyses were performed by unpaired t test. ***, P < 0.001.
FIG 4
Blockade of MT-1 and -2 increases muscle mass and function. (A) Increased muscle weight in various muscles of MT-null mice. (B) Fiber size distribution showing hypertrophy of type IIb fibers in anterior tibialis. (C) Force-frequency relationship in control and MT-null mice upon evoked hind limb stimulation. All values are expressed as means ± SEs for 8 to 13 mice. Statistical analyses were performed by unpaired t test. *, P < 0.05; ***, P < 0.001.
FIG 5
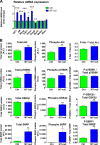
The Akt pathway is activated in skeletal muscle of MT-null mice. (A) Relative mRNA levels of genes regulated in MT-deficient mice as assessed by RT-PCR. (B) Total and phosphorylated protein expression as well as ratios of Akt, GSK3β, p70S6K, and S6RP in control and MT-null mice. All values are expressed as means ± SEs for 13 mice. Statistical analyses were performed by unpaired t test. *, P < 0.05; **, P < 0.01; ***, P < 0.001.
FIG 6
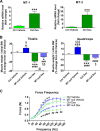
Metallothioneins blockade counters glucocorticoid-induced atrophy and loss of muscle strength. (A) Relative mRNA levels of metallothioneins 1 and 2 in skeletal muscle upon chronic dexamethasone (Dex) administration. (B) Spared muscle weight loss of tibialis and quadriceps in MT-null mice after 14 days of dexamethasone administration. (C) Force-frequency relationship in control and MT-null mice receiving a vehicle or dexamethasone in their drinking water. Values are expressed as means ± SEs for 9 mice. Statistical analyses were performed by ANOVA and Holm-Sidak's post hoc test. *, P < 0.05; **, P < 0.01; ***, P < 0.001; ****, P < 0.0001 (versus control [Ctrl] vehicle). #, P < 0.05; ##, P < 0.01; ###, P < 0.001; ####, P < 0.0001 (versus MT-null vehicle). @, P < 0.05 (MT-null Dex versus Ctrl Dex). §, P < 0.05; §§, P < 0.01 (by unpaired t test) (Ctrl versus DEX). For the force-frequency curves, only Ctrl versus KO mice were statistically analyzed by unpaired t test. *, P < 0.05 (Ctrl vehicle versus MT-null vehicle) #, P < 0.05; ##, P < 0.01 (Ctrl Dex versus MT-null Dex).
FIG 7
Total zinc levels in gastrocnemius from MT-null mice are unchanged. Total zinc was measured in gastrocnemius of control and MT-null mice as indicated in Materials and Methods. Data are expressed as milligrams of total zinc per kilogram of tissue for 13 mice. Statistical analysis was performed using unpaired t test. No difference was detected.
Similar articles
- Akt/mTOR pathway is a crucial regulator of skeletal muscle hypertrophy and can prevent muscle atrophy in vivo.
Bodine SC, Stitt TN, Gonzalez M, Kline WO, Stover GL, Bauerlein R, Zlotchenko E, Scrimgeour A, Lawrence JC, Glass DJ, Yancopoulos GD. Bodine SC, et al. Nat Cell Biol. 2001 Nov;3(11):1014-9. doi: 10.1038/ncb1101-1014. Nat Cell Biol. 2001. PMID: 11715023 - Coffee consumption promotes skeletal muscle hypertrophy and myoblast differentiation.
Jang YJ , Son HJ , Kim JS , Jung CH , Ahn J , Hur J , Ha TY . Jang YJ , et al. Food Funct. 2018 Feb 21;9(2):1102-1111. doi: 10.1039/c7fo01683b. Food Funct. 2018. PMID: 29359224 - Iron-induced skeletal muscle atrophy involves an Akt-forkhead box O3-E3 ubiquitin ligase-dependent pathway.
Ikeda Y, Imao M, Satoh A, Watanabe H, Hamano H, Horinouchi Y, Izawa-Ishizawa Y, Kihira Y, Miyamoto L, Ishizawa K, Tsuchiya K, Tamaki T. Ikeda Y, et al. J Trace Elem Med Biol. 2016 May;35:66-76. doi: 10.1016/j.jtemb.2016.01.011. Epub 2016 Jan 28. J Trace Elem Med Biol. 2016. PMID: 27049128 - PI3 kinase regulation of skeletal muscle hypertrophy and atrophy.
Glass DJ. Glass DJ. Curr Top Microbiol Immunol. 2010;346:267-78. doi: 10.1007/82_2010_78. Curr Top Microbiol Immunol. 2010. PMID: 20593312 Review. - The mechanistic and ergogenic effects of phosphatidic acid in skeletal muscle.
Shad BJ, Smeuninx B, Atherton PJ, Breen L. Shad BJ, et al. Appl Physiol Nutr Metab. 2015 Dec;40(12):1233-41. doi: 10.1139/apnm-2015-0350. Epub 2015 Sep 21. Appl Physiol Nutr Metab. 2015. PMID: 26566242 Review.
Cited by
- Profiling muscle transcriptome in mice exposed to microgravity using gene set enrichment analysis.
Oommen AM, Stafford P, Joshi L. Oommen AM, et al. NPJ Microgravity. 2024 Oct 4;10(1):94. doi: 10.1038/s41526-024-00434-z. NPJ Microgravity. 2024. PMID: 39367013 Free PMC article. - Signaling Pathways That Control Muscle Mass.
Vainshtein A, Sandri M. Vainshtein A, et al. Int J Mol Sci. 2020 Jul 4;21(13):4759. doi: 10.3390/ijms21134759. Int J Mol Sci. 2020. PMID: 32635462 Free PMC article. Review. - Skeletal muscle-specific overexpression of miR-486 limits mammary tumor-induced skeletal muscle functional limitations.
Wang R, Kumar B, Doud EH, Mosley AL, Alexander MS, Kunkel LM, Nakshatri H. Wang R, et al. Mol Ther Nucleic Acids. 2022 Mar 16;28:231-248. doi: 10.1016/j.omtn.2022.03.009. eCollection 2022 Jun 14. Mol Ther Nucleic Acids. 2022. PMID: 35402076 Free PMC article. - Oncostatin M signaling drives cancer-associated skeletal muscle wasting.
Domaniku-Waraich A, Agca S, Toledo B, Sucuoglu M, Özen SD, Bilgic SN, Arabaci DH, Kashgari AE, Kir S. Domaniku-Waraich A, et al. Cell Rep Med. 2024 Apr 16;5(4):101498. doi: 10.1016/j.xcrm.2024.101498. Epub 2024 Apr 4. Cell Rep Med. 2024. PMID: 38569555 Free PMC article. - Resistance exercise training in older men reduces ATF4-activated and senescence-associated mRNAs in skeletal muscle.
Von Ruff ZD, Miller MJ, Moro T, Reidy PT, Ebert SM, Volpi E, Adams CM, Rasmussen BB. Von Ruff ZD, et al. Geroscience. 2025 Jun;47(3):4601-4622. doi: 10.1007/s11357-025-01564-2. Epub 2025 Feb 27. Geroscience. 2025. PMID: 40011348 Free PMC article.
References
- Stitt TN, Drujan D, Clarke BA, Panaro F, Timofeyva Y, Kline WO, Gonzalez M, Yancopoulos GD, Glass DJ. 2004. The IGF-1/PI3K/Akt pathway prevents expression of muscle atrophy-induced ubiquitin ligases by inhibiting FOXO transcription factors. Mol Cell 14:395–403. doi:10.1016/S1097-2765(04)00211-4. - DOI - PubMed
MeSH terms
Substances
LinkOut - more resources
Full Text Sources
Other Literature Sources
Molecular Biology Databases


