CCL2/CCR2, but not CCL5/CCR5, mediates monocyte recruitment, inflammation and cartilage destruction in osteoarthritis - PubMed (original) (raw)
. 2017 May;76(5):914-922.
doi: 10.1136/annrheumdis-2016-210426. Epub 2016 Dec 13.
Christin M Lepus 1 2, Qian Wang 1 2, Heidi H Wong 1 2, Nithya Lingampalli 1 2, Francesca Oliviero 3, Leonardo Punzi 3, Nicholas J Giori 2 4, Stuart B Goodman 5, Constance R Chu 2 4, Jeremy B Sokolove 1 2, William H Robinson 1 2
Affiliations
- PMID: 27965260
- PMCID: PMC5834918
- DOI: 10.1136/annrheumdis-2016-210426
CCL2/CCR2, but not CCL5/CCR5, mediates monocyte recruitment, inflammation and cartilage destruction in osteoarthritis
Harini Raghu et al. Ann Rheum Dis. 2017 May.
Abstract
Objectives: While various monocyte chemokine systems are increased in expression in osteoarthritis (OA), the hierarchy of chemokines and chemokine receptors in mediating monocyte/macrophage recruitment to the OA joint remains poorly defined. Here, we investigated the relative contributions of the CCL2/CCR2 versus CCL5/CCR5 chemokine axes in OA pathogenesis.
Methods: _Ccl2_-, _Ccr2_-, _Ccl5_- and _Ccr5_-deficient and control mice were subjected to destabilisation of medial meniscus surgery to induce OA. The pharmacological utility of blocking CCL2/CCR2 signalling in mouse OA was investigated using bindarit, a CCL2 synthesis inhibitor, and RS-504393, a CCR2 antagonist. Levels of monocyte chemoattractants in synovial tissues and fluids from patients with joint injuries without OA and those with established OA were investigated using a combination of microarray analyses, multiplexed cytokine assays and immunostains.
Results: Mice lacking CCL2 or CCR2, but not CCL5 or CCR5, were protected against OA with a concomitant reduction in local monocyte/macrophage numbers in their joints. In synovial fluids from patients with OA, levels of CCR2 ligands (CCL2, CCL7 and CCL8) but not CCR5 ligands (CCL3, CCL4 and CCL5) were elevated. We found that CCR2+ cells are abundant in human OA synovium and that CCR2+ macrophages line, invade and are associated with the erosion of OA cartilage. Further, blockade of CCL2/CCR2 signalling markedly attenuated macrophage accumulation, synovitis and cartilage damage in mouse OA.
Conclusions: Our findings demonstrate that monocytes recruited via CCL2/CCR2, rather than by CCL5/CCR5, propagate inflammation and tissue damage in OA. Selective targeting of the CCL2/CCR2 system represents a promising therapeutic approach for OA.
Keywords: Chemokines; Cytokines; Inflammation; Osteoarthritis.
Published by the BMJ Publishing Group Limited. For permission to use (where not already granted under a licence) please go to http://www.bmj.com/company/products-services/rights-and-licensing/.
Conflict of interest statement
Competing interests None.
Figures
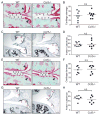
Figure 1
CCL2 deficiency protects against development of osteoarthritis in mice, and is associated with reduced synovial macrophages and inflammatory mediators. (A) Representative safranin-o stained knee joint sections showing extensive cartilage damage (open arrows) and osteophytes (filled arrows) and (B) quantification of cartilage damage in wild-type (WT, n=5) but not _Ccl2_−/− (n=7) mice 20 weeks after destabilisation of the medial meniscus (DMM) surgery by a blinded investigator. (C, D) Representative immunostains and quantification of F4/80+ (brown) macrophages in the synovium (red arrows) in WT and _Ccl2_−/− mice 16 weeks after DMM surgery. Symbols represent individual mice and bars denote the mean in (B) and (D). (E) Quantitative PCR (qPCR) analyses of proinflammatory gene expression in synovium of WT (n=3) and _Ccl2_−/− (n=3) mice 10 weeks after DMM surgery. qPCR data are mean±SEM. Scale bars 200 μm. *p<0.05, **p<0.01 by the Mann-Whitney U test for (B), (D) and by Student’s t-test for (E). The presented data are representative of two independent experiments with similar results.
Figure 2
CCR2 deficiency attenuates osteoarthritis in mice. (A) Representative safranin-o stained knee joint sections showing severe cartilage damage (open arrows) and osteophytes (filled arrows) and (B) quantification of cartilage damage in wild-type (WT, n=4) but not _Ccr2_−/− (n=5) mice 20 weeks after destabilisation of the medial meniscus surgery by a blinded investigator. (C) Representative immunohistochemistry and (D) quantification of F4/80+ (brown) macrophages lining the synovium (red arrows) in WT and _Ccr2_−/− mice. Symbols denote individual mice, and bars denote the mean of indicated groups in (B) and (D). Scale bars denote 200 μm. *p<0.05 by the Mann-Whitney U test for (B) and by Students t-test ‘ for (D). The presented data are representative of two independent experiments with similar results.
Figure 3
CCR5 or CCL5 deficiency does not modulate the severity of experimental osteoarthritis following destabilisation of the medial meniscus (DMM). (A) Representative safranin-o stained knee joint sections showing severe cartilage damage (open arrows) and osteophytes (filled arrows) in both wild-type (WT) and _Ccr5_−/− mice 20 weeks after DMM surgery. (B) Quantification of cartilage damage in WT (n=8) and _Ccr5_−/− (n=8) mice by a blinded investigator. (C) Representative immunohistochemistry showing F4/80+ (brown) macrophages lining the synovium (red arrows) in WT and _Ccr5_−/− mice. (D) Quantification of F4/80+ macrophages in WT and _Ccr5_−/− mice. (E) Representative safranin-o stained knee joint sections showing marked cartilage damage (open arrows) and osteophytes (filled arrows) in WT and _Ccl5_−/− mice 20 weeks after DMM surgery. (F) Quantification of cartilage damage in WT (n=7) and _Ccl5_−/− (n=8) mice by a blinded investigator. (G) Representative immunohistochemistry showing F4/80+ (brown) macrophages lining the synovium (red arrows) in WT and _Ccl5_−/− mice. (H) Quantification of F4/80+ macrophages in WT and _Ccl5_−/− mice. Symbols denote individual mice, and bars denote the mean. Scale bars denote 200 μm. *p<0.05 by the Mann-Whitney U test in (B) and (F) and Student’s t-test in (D) and (H).
Figure 4
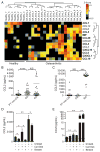
Enhanced monocyte chemoattractant mRNA expression in human osteoarthritis (OA) synovial tissue and increased CCL2, but not CCL5, levels in human OA synovial fluids and synovial fibroblasts. (A) Unsupervised cluster analyses of gene expression of various chemokines involved in monocyte chemoattraction in microarray datasets from synovial membranes of individuals with prior traumatic joint injury but no radiographic OA (healthy) and from individuals with early-stage or end-stage OA (downloaded from gene expression omnibus (GEO), accession code GSE32317). Scale represents Z scores. Bold font indicates significant difference between ‘healthy’ and ‘ osteoarthritis’ groups by significance analysis of microarrays (SAM) analyses with q-value (false discovery rate) cut-off set at 0.05. Quantification of (B) CCL2 and (C) CCL5 in synovial fluids of individuals with posttraumatic joint injuries (PT non-OA, n=37), OA (n=35) or rheumatoid arthritis (n=26). Analyses of (D) CCL2 and (E) CCL5 levels in supernatants of human OA-derived primary synovial fibroblasts stimulated with 20 mg/mL OA cartilage debris (Cart Deb), 1 μg/mL S100A8 (positive control) or media alone in the presence or absence of 300 μM bindarit for 24 hours. In vitro stimulation assays were performed in triplicate and are representative of data obtained from four independent synovial fibroblast cultures derived from four different individuals with OA undergoing total knee arthroplasty. *p<0.05, **p<0.01, ****p<0.0001 Student’s t-test, NS, not significant.
Figure 5
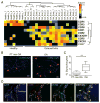
Increased mRNA expression of chemokine receptors and increased CCR2+ macrophages in synovium and cartilage tissues obtained from humans with osteoarthritis (OA). (A) Unsupervised cluster analyses of gene expression of various chemokine receptors involved in monocyte chemoattraction in microarray datasets from synovial membranes of individuals with prior traumatic joint injury but no radiographic OA (healthy) and from individuals with early-stage or end-stage OA (downloaded from GEO, accession code GSE32317). Scale represents Z scores. Bold font indicates significant difference between ‘healthy’ and ‘osteoarthritis’ groups by SAM analyses with q-value (false discovery rate) cut-off set at 0.05. (B) Representative immunofluorescent staining of CCR2 (red arrows) in sections of PT non-OA or OA synovial tissues. (C) Quantification of CCR2+ cells in synovial tissue as a percentage of total DAPI-stained synoviocytes per random low power field (LPF). Ten LPFs were quantitated per synovial tissue section (n=5 individual samples per group). Error bars indicate maximum and minimum values, and line denotes their mean. (D) Representative immunostaining of CD68 (red) and CCR2 (green) adjacent to the lesional articular cartilage samples from patients with OA (n=6) showing CD68+CCR2+ double-positive macrophages (yellow arrows) invading the cartilage tissue. Dotted white lines demarcate the cartilage tissue lined by invading macrophages. Scale bar denotes 200 μm. **p<0.01 Student’s t-test.
Figure 6
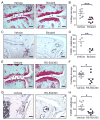
Pharmacological blockage of CCL2 synthesis or binding to CCR2 protects against osteoarthritis development in mice. (A) Representative safranin-o stained knee joint sections and (B) quantification of cartilage damage from mice receiving vehicle (n=10) or 50 mg/kg/day bindarit (n=8) by oral gavage for 12 weeks after destabilisation of the medial meniscus (DMM) surgery. Open and filled arrows indicate cartilage damage and osteophytes, respectively. (C) Representative immunostains and (D) quantification of F4/80+ (brown) macrophages in the synovium (red arrows) of vehicle-treated but not bindarit-treated mice. (E) Representative safranin-o stained knee joint sections and (F) quantification of cartilage damage from mice receiving vehicle (n=12) or 4 mg/kg/day RS-504393 (n=7) by oral gavage for 12 weeks after DMM surgery. Open and filled arrows indicate cartilage damage and osteophytes, respectively. (G) Representative immunostains and (H) quantification of F4/80+ (brown) macrophages in the synovium (red arrows) of vehicle-treated but not RS-504393-treated mice. Symbols denote individual mice and bars denote the mean of indicated groups in (B) and (F). Scale bars denote 200 μm. *p<0.05 by the Mann-Whitney U test for (B) and (F) and by Student’s t-test for (D) and (H).
Similar articles
- CCL3/CCR1 mediates CD14+CD16- circulating monocyte recruitment in knee osteoarthritis progression.
Zhao X, Gu M, Xu X, Wen X, Yang G, Li L, Sheng P, Meng F. Zhao X, et al. Osteoarthritis Cartilage. 2020 May;28(5):613-625. doi: 10.1016/j.joca.2020.01.009. Epub 2020 Jan 29. Osteoarthritis Cartilage. 2020. PMID: 32006659 - Adiponectin stimulates release of CCL2, -3, -4 and -5 while the surface abundance of CCR2 and -5 is simultaneously reduced in primary human monocytes.
Neumeier M, Bauer S, Brühl H, Eisinger K, Kopp A, Abke S, Walter R, Schäffler A, Buechler C. Neumeier M, et al. Cytokine. 2011 Dec;56(3):573-80. doi: 10.1016/j.cyto.2011.08.017. Epub 2011 Sep 3. Cytokine. 2011. PMID: 21890375 - Why CCR2 and CCR5 blockade failed and why CCR1 blockade might still be effective in the treatment of rheumatoid arthritis.
Lebre MC, Vergunst CE, Choi IY, Aarrass S, Oliveira AS, Wyant T, Horuk R, Reedquist KA, Tak PP. Lebre MC, et al. PLoS One. 2011;6(7):e21772. doi: 10.1371/journal.pone.0021772. Epub 2011 Jul 1. PLoS One. 2011. PMID: 21747955 Free PMC article. - The role of monocyte/macrophage chemokines in pathogenesis of osteoarthritis: A review.
Luo H, Li L, Han S, Liu T. Luo H, et al. Int J Immunogenet. 2024 Jun;51(3):130-142. doi: 10.1111/iji.12664. Epub 2024 Mar 10. Int J Immunogenet. 2024. PMID: 38462560 Review. - Dual CCR5/CCR2 targeting: opportunities for the cure of complex disorders.
Fantuzzi L, Tagliamonte M, Gauzzi MC, Lopalco L. Fantuzzi L, et al. Cell Mol Life Sci. 2019 Dec;76(24):4869-4886. doi: 10.1007/s00018-019-03255-6. Epub 2019 Aug 3. Cell Mol Life Sci. 2019. PMID: 31377844 Free PMC article. Review.
Cited by
- Role of the CCL2-CCR2 axis in cardiovascular disease: Pathogenesis and clinical implications.
Zhang H, Yang K, Chen F, Liu Q, Ni J, Cao W, Hua Y, He F, Liu Z, Li L, Fan G. Zhang H, et al. Front Immunol. 2022 Aug 30;13:975367. doi: 10.3389/fimmu.2022.975367. eCollection 2022. Front Immunol. 2022. PMID: 36110847 Free PMC article. Review. - Imaging Inflammation with Positron Emission Tomography.
Iking J, Staniszewska M, Kessler L, Klose JM, Lückerath K, Fendler WP, Herrmann K, Rischpler C. Iking J, et al. Biomedicines. 2021 Feb 19;9(2):212. doi: 10.3390/biomedicines9020212. Biomedicines. 2021. PMID: 33669804 Free PMC article. Review. - Identification of cellular heterogeneity and immunogenicity of chondrocytes via single-cell RNA sequencing technique in human osteoarthritis.
Hu X, Li Z, Ji M, Lin Y, Chen Y, Lu J. Hu X, et al. Front Pharmacol. 2022 Sep 29;13:1004766. doi: 10.3389/fphar.2022.1004766. eCollection 2022. Front Pharmacol. 2022. PMID: 36249797 Free PMC article. - Role of CCL2/CCR2 axis in the pathogenesis of COVID-19 and possible Treatments: All options on the Table.
Ranjbar M, Rahimi A, Baghernejadan Z, Ghorbani A, Khorramdelazad H. Ranjbar M, et al. Int Immunopharmacol. 2022 Dec;113(Pt A):109325. doi: 10.1016/j.intimp.2022.109325. Epub 2022 Oct 14. Int Immunopharmacol. 2022. PMID: 36252475 Free PMC article. Review. - Inhibition of CCL2 by bindarit alleviates diabetes-associated periodontitis by suppressing inflammatory monocyte infiltration and altering macrophage properties.
Shen Z, Kuang S, Zhang M, Huang X, Chen J, Guan M, Qin W, Xu HHK, Lin Z. Shen Z, et al. Cell Mol Immunol. 2021 Sep;18(9):2224-2235. doi: 10.1038/s41423-020-0500-1. Epub 2020 Jul 16. Cell Mol Immunol. 2021. PMID: 32678310 Free PMC article.
References
- Felson DT. Clinical practice. Osteoarthritis of the knee. N Engl J Med. 2006;354:841–8. - PubMed
- Klareskog L, Johnell O, Hulth A, et al. Reactivity of monoclonal anti-type II collagen antibodies with cartilage and synovial tissue in rheumatoid arthritis and osteoarthritis. Arthritis Rheum. 1986;29:730–8. - PubMed
- Kapoor M, Martel-Pelletier J, Lajeunesse D, et al. Role of proinflammatory cytokines in the pathophysiology of osteoarthritis. Nat Rev Rheumatol. 2011;7:33–42. - PubMed
MeSH terms
Substances
LinkOut - more resources
Full Text Sources
Other Literature Sources
Medical


