Cellular Senescence Promotes Adverse Effects of Chemotherapy and Cancer Relapse - PubMed (original) (raw)
doi: 10.1158/2159-8290.CD-16-0241. Epub 2016 Dec 15.
Monique N O'Leary 3, Jianhui Chang 4, Lijian Shao 4, Su Liu 3, Fatouma Alimirah 3, Kristin Koenig 3, Catherine Le 3, Natalia Mitin 5, Allison M Deal 6, Shani Alston 6, Emmeline C Academia 3, Sumner Kilmarx 3, Alexis Valdovinos 3, Boshi Wang 2, Alain de Bruin 7 8, Brian K Kennedy 3, Simon Melov 3, Daohong Zhou 4, Norman E Sharpless 6, Hyman Muss 6, Judith Campisi 1 9
Affiliations
- PMID: 27979832
- PMCID: PMC5296251
- DOI: 10.1158/2159-8290.CD-16-0241
Cellular Senescence Promotes Adverse Effects of Chemotherapy and Cancer Relapse
Marco Demaria et al. Cancer Discov. 2017 Feb.
Abstract
Cellular senescence suppresses cancer by irreversibly arresting cell proliferation. Senescent cells acquire a proinflammatory senescence-associated secretory phenotype. Many genotoxic chemotherapies target proliferating cells nonspecifically, often with adverse reactions. In accord with prior work, we show that several chemotherapeutic drugs induce senescence of primary murine and human cells. Using a transgenic mouse that permits tracking and eliminating senescent cells, we show that therapy-induced senescent (TIS) cells persist and contribute to local and systemic inflammation. Eliminating TIS cells reduced several short- and long-term effects of the drugs, including bone marrow suppression, cardiac dysfunction, cancer recurrence, and physical activity and strength. Consistent with our findings in mice, the risk of chemotherapy-induced fatigue was significantly greater in humans with increased expression of a senescence marker in T cells prior to chemotherapy. These findings suggest that senescent cells can cause certain chemotherapy side effects, providing a new target to reduce the toxicity of anticancer treatments.
Significance: Many genotoxic chemotherapies have debilitating side effects and also induce cellular senescence in normal tissues. The senescent cells remain chronically present where they can promote local and systemic inflammation that causes or exacerbates many side effects of the chemotherapy. Cancer Discov; 7(2); 165-76. ©2016 AACR.This article is highlighted in the In This Issue feature, p. 115.
©2016 American Association for Cancer Research.
Conflict of interest statement
All other authors declare no financial interests.
Figures
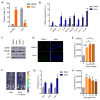
Figure 1. Therapy-induced senescence of primary cells
(A) Mouse dermal fibroblasts (MDFs) were treated with 250 nM doxorubicin (Doxo) for 24 hrs. 7 days later, cells were either fixed and stained for SA-β-gal or incubated for 24 hrs with EdU then fixed and stained. Shown is the percentage of positive cells (>100 cells scored). N=3 independent experiments. (B) Quantitative real-time PCR (qRT-PCR) analysis of RNA isolated from control- (DMSO) or Doxo- (250 nM) treated MDFs. RNA was analyzed for mRNAs encoding the indicated proteins relative to actin (to control for cDNA quantity). N=3 independent experiments. A.U.=arbitrary units. (C) Lamin B1 (LMNB1), HMGB1 and p21 protein levels were measured by immunoblotting using whole cell extracts from control- or Doxo-treated MDFs. Actin served as a loading control. (D) Immunofluorescence of control- or Doxo-treated cells. Blue, DAPI stained nuclei; green, 53BP1 immunostaining. (E) p16-3MR male mice, 10 d after treatment with the indicated concentrations of Doxo (0, 2, 10, 25 mg/kg), were injected with coelentarazine and luminescence was quantified using the Xenogen Imaging system. (F) Representative images from E. N=4. (G) RNA was extracted from the skin, lung and liver of control- or Doxo- (10 mg/kg) treated mice, and quantified by qRT-PCR for mRNA encoding p16INK4a. mRNA encoding tubulin was used as a control. N=5. (H) Control- or Doxo- (10 mg/kg) treated female mice were injected with coelentarazine, and luminescence quantified using the Xenogen Imaging system at the indicated times after Doxo treatment. N=4. Data are means ± SEMs. *p<0.05; **p<0.01; ***p<0.001.
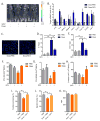
Figure 2. Senescence-associated inflammation, bone marrow suppression and cardiac dysfunction
Control- or Doxo- (10 mg/kg) treated p16-3MR male mice were given vehicle (PBS) or 25 mg/kg ganciclovir (GCV) for 5 days (daily i.p. injections). (A) Mice were injected with coelentarazine, and luminescence was monitored using the Xenogen Imaging system. (B) Quantitative real-time PCR (qRT-PCR) analysis of RNA isolated from lungs. mRNA levels encoding the indicated proteins were quantified relative to tubulin (control) mRNA. The dotted line indicates expression level in control mice, set at 1 for each protein. N=5. A.U.=arbitrary units. (C) Lungs were fixed in paraffin and stained for γH2AX. Blue, DAPI stained nuclei; green, γH2AX immunostaining. (D–E) IL-6 (D) and Cxcl-1 (E) levels in serum were quantified by ELISA. N=4. (F–H) Number of Colony Forming Unit-Granulocyte, Monocyte (F), Colony Forming unit-Granulocyte, Erythrocyte, Monocyte, Megakaryocyte (G) and 2-week Cobblestone Area Forming Cells (H) in bone marrow cells (BMCs) harvested from mice 3 days after the last PBS or GCV injection, determined by Colony Forming Cell and Cobblestone Area Forming Cell assays, respectively. N=3. (I–K) Two-dimensional transthoracic echocardiography was performed in mice 4 weeks after Doxo treatment. Graphs show fractional shortening (I), ejection fraction (J) and heart beat (K) measurements. N=10. bpm=beats per minute. Data are means ± SEMs. *p<0.05; **p<0.01; ***p<0.001.
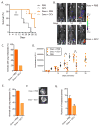
Figure 3. Senescence promotes tumor metastasis and relapse
(A–C) fLUC-MMTV-PyMT cells (105) were injected into the mammary fat pad of p16-3MR female mice and treated with PBS or Doxo (10 mg/kg). 7–10 days later, the animals were injected with PBS or 25 mg/kg GCV for 5 days (daily i.p. injections). (A) Mice were followed for survival. N=5. (B) 7, 14 and 21 days after cancer cell injections, Doxo-treated mice were given D-Luciferin and luminescence was measured using the Xenogen Imaging system. Luminescence identified fLUC-MMTV-PyMT cells. At 21 days, the number of mice with metastasis was evaluated based on luminescence of fLUC-MMTV-PyMT cells (C). (D–G) fLUC-MMTV-PyMT cells (105) were injected into the mammary fat pad of p16-3MR mice. 10 days later, primary tumors were surgically removed and mice were treated with Doxo (10 mg/kg), then, 3 days later, with PBS or 25 mg/kg GCV for 5 days (daily i.p. injections). (D) Mice were given D-Luciferin and luminescence of the primary tumors was measured and quantified at the indicated time points using the Xenogen Imaging system. Luminescence identified fLUC-MMTV-PyMT cells. N=8. (E) 4 weeks after Doxo treatment, metastasis was evaluated based on luminescence signals from lungs, as described in D. N=8. (F–G) Lungs were excised and luminescence was measured to quantify the number of metastasis using the Xenogen Imaging system. N=6 for Doxo + PBS, N=3 for Doxo + GCV. Data are means ± SEMs. *p<0.05; **p<0.01; ***p<0.001.
Figure 4. Effects of senescent cells on activity
Control- or Doxo- (10 mg/kg) treated p16-3MR female mice were treated with vehicle (PBS) or 25 mg/kg of ganciclovir (GCV) for 5 days (daily i.p. injections). (A) Mice were single-housed in metabolic cages and monitored for 4 consecutive days. Data are the average of 4 day and night cycles and show the percentage of time spent on the running wheel. N=8. (B) Running distance in meters, calculated from the number of revolutions of the running wheel, during the nocturnal cycles (average of 4). N=8. (C) Mice were single-housed in standard cages equipped with running wheels. The number of revolutions was determined before Doxo treatment and 12 days after Doxo treatment. For each mouse, values are from an average of 3 consecutive nights. The graph shows the ratio between the post- and pre-treatment running distance, expressed as a percentage. N=10. (D) Mice described in C were monitored for how long they were capable of grasping a reversed cage grid. For each mouse, values are an average of 5 trials. The graph shows the ratio between the post- and pre-treatment grasping time, expressed as a percentage. N=10. (E) Food intake of the mice described in A was measured during the night cycles. Data are means ± SEMs. *p<0.05; **p<0.01; ***p<0.001.
Similar articles
- Targetable mechanisms driving immunoevasion of persistent senescent cells link chemotherapy-resistant cancer to aging.
Muñoz DP, Yannone SM, Daemen A, Sun Y, Vakar-Lopez F, Kawahara M, Freund AM, Rodier F, Wu JD, Desprez PY, Raulet DH, Nelson PS, van 't Veer LJ, Campisi J, Coppé JP. Muñoz DP, et al. JCI Insight. 2019 Jun 11;5(14):e124716. doi: 10.1172/jci.insight.124716. JCI Insight. 2019. PMID: 31184599 Free PMC article. - Different sensitivities of senescent breast cancer cells to immune cell-mediated cytotoxicity.
Inao T, Kotani H, Iida Y, Kartika ID, Okimoto T, Tanino R, Shiba E, Harada M. Inao T, et al. Cancer Sci. 2019 Sep;110(9):2690-2699. doi: 10.1111/cas.14116. Epub 2019 Jul 23. Cancer Sci. 2019. PMID: 31250942 Free PMC article. - Senescent cells: New target for an old treatment?
Demaria M. Demaria M. Mol Cell Oncol. 2017 Apr 3;4(3):e1299666. doi: 10.1080/23723556.2017.1299666. eCollection 2017. Mol Cell Oncol. 2017. PMID: 28616578 Free PMC article. - Cellular senescence: from anti-cancer weapon to anti-aging target.
Yuan L, Alexander PB, Wang XF. Yuan L, et al. Sci China Life Sci. 2020 Mar;63(3):332-342. doi: 10.1007/s11427-019-1629-6. Epub 2020 Feb 13. Sci China Life Sci. 2020. PMID: 32060861 Review. - Chemotherapy-induced senescence, an adaptive mechanism driving resistance and tumor heterogeneity.
Guillon J, Petit C, Toutain B, Guette C, Lelièvre E, Coqueret O. Guillon J, et al. Cell Cycle. 2019 Oct;18(19):2385-2397. doi: 10.1080/15384101.2019.1652047. Epub 2019 Aug 9. Cell Cycle. 2019. PMID: 31397193 Free PMC article. Review.
Cited by
- Senescence as a therapeutic target in cancer and age-related diseases.
McHugh D, Durán I, Gil J. McHugh D, et al. Nat Rev Drug Discov. 2024 Nov 15. doi: 10.1038/s41573-024-01074-4. Online ahead of print. Nat Rev Drug Discov. 2024. PMID: 39548312 Review. - Antineoplastic therapy affects the in vitro phenotype and functionality of healthy human bone marrow-derived mesenchymal stromal cells.
Scherer B, Bogun L, Koch A, Jäger P, Maus U, Schmitt L, Krings KS, Wesselborg S, Haas R, Schroeder T, Geyh S. Scherer B, et al. Arch Toxicol. 2024 Nov 12. doi: 10.1007/s00204-024-03898-w. Online ahead of print. Arch Toxicol. 2024. PMID: 39531065 - Identification of Cellular Senescence-Related Critical Genes and Molecular Classification and Revealing the Drug-Resistant Therapeutic Effect of IGFBP2 in Chronic Myeloid Leukemia.
Xu Y, Yang W, Yao F, Wang Z, Liu J, Huang B, Li X, Zhong F, Wang X. Xu Y, et al. J Inflamm Res. 2024 Nov 6;17:8313-8324. doi: 10.2147/JIR.S483705. eCollection 2024. J Inflamm Res. 2024. PMID: 39525306 Free PMC article. - Vagus nerve stimulation: Novel concept for the treatment of glioblastoma and solid cancers by cytokine (interleukin-6) reduction, attenuating the SASP, enhancing tumor immunity.
Brem S. Brem S. Brain Behav Immun Health. 2024 Sep 17;42:100859. doi: 10.1016/j.bbih.2024.100859. eCollection 2024 Dec. Brain Behav Immun Health. 2024. PMID: 39512605 Free PMC article. Review. - Integration of single-cell and spatial transcriptome sequencing identifies CDKN2A as a senescent biomarker in endothelial cells implicating hepatocellular carcinoma malignancy.
Ma Y, Yi C, Cai N, Chen J. Ma Y, et al. J Cancer Res Clin Oncol. 2024 Nov 6;150(11):487. doi: 10.1007/s00432-024-06017-5. J Cancer Res Clin Oncol. 2024. PMID: 39503880 Free PMC article.
References
Publication types
MeSH terms
Substances
Grants and funding
- R01 CA203023/CA/NCI NIH HHS/United States
- P30 CA016086/CA/NCI NIH HHS/United States
- R01 CA166347/CA/NCI NIH HHS/United States
- R37 AG009909/AG/NIA NIH HHS/United States
- R01 CA163896/CA/NCI NIH HHS/United States
- R01 CA122023/CA/NCI NIH HHS/United States
- R56 AG009909/AG/NIA NIH HHS/United States
- R01 AG024379/AG/NIA NIH HHS/United States
- P01 AG017242/AG/NIA NIH HHS/United States
- P01 AG041122/AG/NIA NIH HHS/United States
LinkOut - more resources
Full Text Sources
Other Literature Sources
Medical
Molecular Biology Databases


