Substrate Stress-Relaxation Regulates Scaffold Remodeling and Bone Formation In Vivo - PubMed (original) (raw)
. 2017 Jan;6(1):10.1002/adhm.201601185.
doi: 10.1002/adhm.201601185. Epub 2016 Dec 20.
Affiliations
- PMID: 27995768
- PMCID: PMC5440842
- DOI: 10.1002/adhm.201601185
Substrate Stress-Relaxation Regulates Scaffold Remodeling and Bone Formation In Vivo
Max Darnell et al. Adv Healthc Mater. 2017 Jan.
Abstract
The rate of stress relaxation of adhesion substrates potently regulates cell fate and function in vitro, and in this study the authors test whether it can regulate bone formation in vivo by implanting alginate gels with differing rates of stress-relaxation carrying human mesenchymal stem cells into rat calvarial defects. After three months, the rats that received fast-relaxing hydrogels (t1/2 ≈ 50 s) show significantly more new bone growth than those that received slow-relaxing, stiffness-matched hydrogels. Strikingly, substantial bone regeneration results from rapidly relaxing hydrogels even in the absence of transplanted cells. Histological analysis reveals that the new bone formed with rapidly relaxing hydrogels is mature and accompanied by extensive matrix remodeling and hydrogel disappearance. This tissue invasion is found to be prominent after just two weeks and the ability of stress relaxation to modulate cell invasion is confirmed with in vitro analysis. These results suggest that substrate stress relaxation can mediate scaffold remodeling and thus tissue formation, giving tissue engineers a new parameter for optimizing bone regeneration.
Keywords: biomaterials; bone regeneration; mechanotransduction; stress relaxation; tissue engineering.
© 2016 WILEY-VCH Verlag GmbH & Co. KGaA, Weinheim.
Figures
Figure 1
In vitro characterization of alginate hydrogels, and their effects on hMSC osteogenic differentiation. (A) Stress-time curves of human hematomas subjected to compression testing. Curves depict stress relaxation of hematomas held at 15% strain. Inset shows time to 50% of the initial stress in these curves. (B) Young’s modulus as determined by compression testing of slow and fast-relaxing alginate hydrogels. (Student’s t-test, n=4) (C) Time to 50% stress relaxation at 15% initial strain for slow and fast-relaxing alginate hydrogels. (Student’s t-test, n=4) (D) Extent of gel contraction after culture with encapsulated hMSCs for two weeks. (Student’s t-test, n=4) (E) Representative von Kossa staining for matrix mineralization between slow and fast-relaxing gels with encapsulated hMSCs in osteo-inductive medium after two weeks. Scale bar represents 300 μm. (F) Representative pseudo-colored EDS elemental maps for slow and fast-relaxing gels with encapsulated hMSCs in osteo-inductive medium after two weeks. Orange depicts phosphorous and marks phosphate deposition, while green depicts carbon.
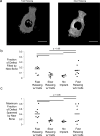
Figure 2
Micro-computed tomography analysis of new bone formation after implantation of hydrogels in rat calvarial defect model. (A) Representative uCT renderings of rat calvaria three months post-injury. Scale bar – 1cm. (B) Maximum fraction of wound spanned after three months calculated by taking the maximum fraction of bone occupying any line drawn through the center of the defect. (One-way ANOVA, Tukey’s post-hoc test, n=3–4) (C) Fraction of the original wound area inhabited by new bone after three months. (One-way ANOVA, Tukey’s post-hoc test, n=5–8).
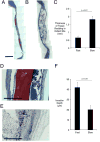
Figure 3
Histological staining and quantification of calvarial wound site remodeling three months post-injury. (A) Masson’s Trichrome staining of defect site in fast-relaxing (A) and slow-relaxing (B) gel conditions. Scale bar – 2mm in A and B. (C) Quantification of thickness of tissue residing in defect site, as determined by measuring tissue sections stained with Masson’s Trichrome at various points along the membrane that were incident with the implant (Student’s t-test, n=8–10). Error bars represent S.D. (D) Safranin O stain of defect site in slow-relaxing (D) and fast-relaxing (E) cases carrying cells after two weeks of implantation. Scale bars – 1mm. Residual alginate stains red and is marked “a.” (F) Quantification of fibroblast infiltration into hydrogels at one week in vitro after seeding on surface of gel (Student’s t-test, n=15 measurement sites). Error bars represent S.D.
Figure 4
Histological staining of calvarial wound sites three months post-injury. (A) Representative high and low magnification images of Hematoxylin and Eosin stained sections demonstrating new bone in the fast-relaxing case and a disorganized tissue in the slow-relaxing case. ‘os’ labels the osteoid region, ‘oc’ labels osteocytes, and ‘ob’ labels elongated, activated osteoblasts on the new bone growth front. Low-mag scale bar represents 360 μm and high-mag scale bar represents 180 μm. (B) Representative Masson’s trichrome staining demonstrates mature bone (‘m’) in the fast-relaxing case and disorganized collagen in the slow-relaxing case. Scale bar represents 360 μm. Note the discrepancy in scale due to remodeling effects noted in Figure 3. (C) Representative Van Gieson staining indicates mature bone (‘m’) in the fast-relaxing case and disorganized collagen in the slow-relaxing case. (D) Representative alcian blue staining to identify residual alginate hydrogel (‘g’) reveals small remnants in the fast-relaxing case and large remnants in the slow-relaxing case. Scale bar represents 360 μm in the fast-relaxing case and 720 μm in the slow-relaxing case.
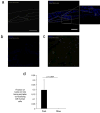
Figure 5
Localization of progeny of transplanted cells in calvarial defect site three months post-injury. (A) Human mitochondrial staining in defects treated with fast-relaxing gels reveals human cells on the new bone periphery. The left panel depicts imaging of the stain used for human mitochondria, while the right depicts the mitochondria overlaid with nuclei stain. The inset shows a higher magnification version of the new bone interface. Scale bar represents 225 μm (B) Human mitochondrial staining in tissues treated with slow-relaxing gel depicting an absence of human cells. (C) Positive control for human mitochondrial staining in human bone section. (D) Fraction of total cellular nuclei on the new bone perimeter co-localizing with human cells (Student’s t-test, n=4). No human cells were detected in the slow-relaxing case. Error bars represent S.D.
Similar articles
- Biohybrid cardiac ECM-based hydrogels improve long term cardiac function post myocardial infarction.
Efraim Y, Sarig H, Cohen Anavy N, Sarig U, de Berardinis E, Chaw SY, Krishnamoorthi M, Kalifa J, Bogireddi H, Duc TV, Kofidis T, Baruch L, Boey FYC, Venkatraman SS, Machluf M. Efraim Y, et al. Acta Biomater. 2017 Mar 1;50:220-233. doi: 10.1016/j.actbio.2016.12.015. Epub 2016 Dec 9. Acta Biomater. 2017. PMID: 27956366 - Elastin-like protein hydrogels with controllable stress relaxation rate and stiffness modulate endothelial cell function.
Shayan M, Huang MS, Navarro R, Chiang G, Hu C, Oropeza BP, Johansson PK, Suhar RA, Foster AA, LeSavage BL, Zamani M, Enejder A, Roth JG, Heilshorn SC, Huang NF. Shayan M, et al. J Biomed Mater Res A. 2023 Jul;111(7):896-909. doi: 10.1002/jbm.a.37520. Epub 2023 Mar 2. J Biomed Mater Res A. 2023. PMID: 36861665 Free PMC article. - Bone regeneration in critical-size calvarial defects using human dental pulp cells in an extracellular matrix-based scaffold.
Petridis X, Diamanti E, Trigas GCh, Kalyvas D, Kitraki E. Petridis X, et al. J Craniomaxillofac Surg. 2015 May;43(4):483-90. doi: 10.1016/j.jcms.2015.02.003. Epub 2015 Feb 11. J Craniomaxillofac Surg. 2015. PMID: 25753474 - Engineering biomimetic periosteum with β-TCP scaffolds to promote bone formation in calvarial defects of rats.
Zhang D, Gao P, Li Q, Li J, Li X, Liu X, Kang Y, Ren L. Zhang D, et al. Stem Cell Res Ther. 2017 Jun 5;8(1):134. doi: 10.1186/s13287-017-0592-4. Stem Cell Res Ther. 2017. PMID: 28583167 Free PMC article. - Dynamic freedom: substrate stress relaxation stimulates cell responses.
Dey K , Agnelli S , Sartore L . Dey K , et al. Biomater Sci. 2019 Feb 26;7(3):836-842. doi: 10.1039/c8bm01305e. Biomater Sci. 2019. PMID: 30574966 Review.
Cited by
- Degradability tunes ECM stress relaxation and cellular mechanics.
Narasimhan BN, Fraley SI. Narasimhan BN, et al. bioRxiv [Preprint]. 2024 Jul 29:2024.07.28.605514. doi: 10.1101/2024.07.28.605514. bioRxiv. 2024. PMID: 39131364 Free PMC article. Preprint. - Biomimetic cell-adhesive ligand-functionalized peptide composite hydrogels maintain stemness of human amniotic mesenchymal stem cells.
Zhang L, Xiong N, Liu Y, Gan L. Zhang L, et al. Regen Biomater. 2021 Mar 12;8(2):rbaa057. doi: 10.1093/rb/rbaa057. eCollection 2021 Mar. Regen Biomater. 2021. PMID: 33738111 Free PMC article. - Induced Osteogenesis in Plants Decellularized Scaffolds.
Lee J, Jung H, Park N, Park SH, Ju JH. Lee J, et al. Sci Rep. 2019 Dec 27;9(1):20194. doi: 10.1038/s41598-019-56651-0. Sci Rep. 2019. PMID: 31882858 Free PMC article. - Can't handle the stress? Mechanobiology and disease.
Zuela-Sopilniak N, Lammerding J. Zuela-Sopilniak N, et al. Trends Mol Med. 2022 Sep;28(9):710-725. doi: 10.1016/j.molmed.2022.05.010. Epub 2022 Jun 15. Trends Mol Med. 2022. PMID: 35717527 Free PMC article. Review. - A simple management of massive bone defect after en-bloc resection of osteofibrous dysplasia of tibial shaft: A case report.
Kamal AF, Ramang DS. Kamal AF, et al. Int J Surg Case Rep. 2021 Aug;85:106213. doi: 10.1016/j.ijscr.2021.106213. Epub 2021 Jul 20. Int J Surg Case Rep. 2021. PMID: 34352623 Free PMC article.
References
- Mooney DJ, Vandenburgh H. Cell Delivery Mechanisms for Tissue Repair. Cell Stem Cell. 2008;2(3):205–213. - PubMed
- Szpalski C, Wetterau M, Barr J, Warren SM. Bone Tissue Engineering: Current Strategies and Techniques—Part I: Scaffolds. Tissue Engineering Part B: Reviews. 2011;18(4):246–257. - PubMed
MeSH terms
Substances
LinkOut - more resources
Full Text Sources
Other Literature Sources


