US Spending on Personal Health Care and Public Health, 1996-2013 - PubMed (original) (raw)
. 2016 Dec 27;316(24):2627-2646.
doi: 10.1001/jama.2016.16885.
Ranju Baral 2, Maxwell Birger 1, Anthony L Bui 3, Anne Bulchis 2, Abigail Chapin 1, Hannah Hamavid 1, Cody Horst 1, Elizabeth K Johnson 1, Jonathan Joseph 1, Rouselle Lavado 4, Liya Lomsadze 5, Alex Reynolds 1, Ellen Squires 1, Madeline Campbell 1, Brendan DeCenso 6, Daniel Dicker 1, Abraham D Flaxman 1, Rose Gabert 1, Tina Highfill 7, Mohsen Naghavi 1, Noelle Nightingale 1, Tara Templin 8, Martin I Tobias 9, Theo Vos 1, Christopher J L Murray 1
Affiliations
- PMID: 28027366
- PMCID: PMC5551483
- DOI: 10.1001/jama.2016.16885
US Spending on Personal Health Care and Public Health, 1996-2013
Joseph L Dieleman et al. JAMA. 2016.
Abstract
Importance: US health care spending has continued to increase, and now accounts for more than 17% of the US economy. Despite the size and growth of this spending, little is known about how spending on each condition varies by age and across time.
Objective: To systematically and comprehensively estimate US spending on personal health care and public health, according to condition, age and sex group, and type of care.
Design and setting: Government budgets, insurance claims, facility surveys, household surveys, and official US records from 1996 through 2013 were collected and combined. In total, 183 sources of data were used to estimate spending for 155 conditions (including cancer, which was disaggregated into 29 conditions). For each record, spending was extracted, along with the age and sex of the patient, and the type of care. Spending was adjusted to reflect the health condition treated, rather than the primary diagnosis.
Exposures: Encounter with US health care system.
Main outcomes and measures: National spending estimates stratified by condition, age and sex group, and type of care.
Results: From 1996 through 2013, 30.1trillionofpersonalhealthcarespendingwasdisaggregatedby155conditions,ageandsexgroup,andtypeofcare.Amongthese155conditions,diabeteshadthehighesthealthcarespendingin2013,withanestimated30.1 trillion of personal health care spending was disaggregated by 155 conditions, age and sex group, and type of care. Among these 155 conditions, diabetes had the highest health care spending in 2013, with an estimated 30.1trillionofpersonalhealthcarespendingwasdisaggregatedby155conditions,ageandsexgroup,andtypeofcare.Amongthese155conditions,diabeteshadthehighesthealthcarespendingin2013,withanestimated101.4 billion (uncertainty interval [UI], 96.7billion−96.7 billion-96.7billion−106.5 billion) in spending, including 57.6% (UI, 53.8%-62.1%) spent on pharmaceuticals and 23.5% (UI, 21.7%-25.7%) spent on ambulatory care. Ischemic heart disease accounted for the second-highest amount of health care spending in 2013, with estimated spending of 88.1billion(UI,88.1 billion (UI, 88.1billion(UI,82.7 billion-$92.9 billion), and low back and neck pain accounted for the third-highest amount, with estimated health care spending of 87.6billion(UI,87.6 billion (UI, 87.6billion(UI,67.5 billion-$94.1 billion). The conditions with the highest spending levels varied by age, sex, type of care, and year. Personal health care spending increased for 143 of the 155 conditions from 1996 through 2013. Spending on low back and neck pain and on diabetes increased the most over the 18 years, by an estimated 57.2billion(UI,57.2 billion (UI, 57.2billion(UI,47.4 billion-$64.4 billion) and 64.4billion(UI,64.4 billion (UI, 64.4billion(UI,57.8 billion-$70.7 billion), respectively. From 1996 through 2013, spending on emergency care and retail pharmaceuticals increased at the fastest rates (6.4% [UI, 6.4%-6.4%] and 5.6% [UI, 5.6%-5.6%] annual growth rate, respectively), which were higher than annual rates for spending on inpatient care (2.8% [UI, 2.8%-2.8%] and nursing facility care (2.5% [UI, 2.5%-2.5%]).
Conclusions and relevance: Modeled estimates of US spending on personal health care and public health showed substantial increases from 1996 through 2013; with spending on diabetes, ischemic heart disease, and low back and neck pain accounting for the highest amounts of spending by disease category. The rate of change in annual spending varied considerably among different conditions and types of care. This information may have implications for efforts to control US health care spending.
Conflict of interest statement
Conflict of Interest Disclosures: All authors have completed and submitted the ICMJE Form for Disclosure of Potential Conflicts of Interest and none were reported.
Figures
Figure 1. Personal Health Care Spending in the United States by Age Group, Aggregated Condition Category, and Type of Health Care, 2013
DUBE indicates diabetes, urogenital, blood, and endocrine diseases. Reported in 2015 US dollars. Each of the 3 columns sums to the 2.1trillionof2013spendingdisaggregatedinthisstudy.Thelengthofeachbarreflectstherelativeshareofthe2.1 trillion of 2013 spending disaggregated in this study. The length of each bar reflects the relative share of the 2.1trillionof2013spendingdisaggregatedinthisstudy.Thelengthofeachbarreflectstherelativeshareofthe2.1 trillion attributed to that age group, condition category, or type of care. Communicable diseases included nutrition and maternal disorders. Table 3 lists the aggregated condition category in which each condition was classified.
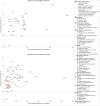
Figure 2. Personal Health Care Spending in the United States by Age, Sex, and Aggregated Condition Category, 2013
DUBE indicates diabetes, urogenital, blood, and endocrine diseases. Reported in 2015 US dollars. Panel A, illustrates health care spending by age, sex, and aggregated condition category. Panel B, illustrates health care spending per capita. Increases in spending along the x-axis show more spending. Communicable diseases included nutrition and maternal disorders. Table 3 lists the aggregated condition category in which each condition was classified.
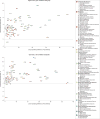
Figure 3. 2013 Personal Health Care Spending in the United States and Annualized Growth Rates by Age Groups 0 to 19 Years and 20 to 44 Years, 1996–2013
Each panel illustrates 2013 health care spending (reported in 2015 US dollars) and the annualized rate of change for each condition with at least $1 billion of health care spending, for each age group in 1996.
Figure 4. 2013 Personal Health Care Spending in the United States and Annualized Growth Rates by Age Groups 45 to 64 Years and 65 Years and Older, 1996–2013
Each panel illustrates 2013 health care spending (reported in 2015 US dollars) and the annualized rate of change for each condition with at least $1 billion of health care spending, for each age group in 1996.
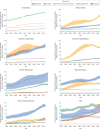
Figure 5. Personal Health Care Spending in the United States Across Time for All Conditions and the 7 Conditions With the Greatest Absolute Increases in Annual Spending From 1996–2013
Reported in 2015 US dollars. Y-axis segments shown in blue indicate range from y = 0billiontoy=0 billion to y = 0billiontoy=30 billion. Shaded areas indicate uncertainty intervals.
Comment in
- How Can the United States Spend Its Health Care Dollars Better?
Emanuel EJ. Emanuel EJ. JAMA. 2016 Dec 27;316(24):2604-2606. doi: 10.1001/jama.2016.16739. JAMA. 2016. PMID: 28027348 No abstract available.
Similar articles
- US Health Care Spending by Payer and Health Condition, 1996-2016.
Dieleman JL, Cao J, Chapin A, Chen C, Li Z, Liu A, Horst C, Kaldjian A, Matyasz T, Scott KW, Bui AL, Campbell M, Duber HC, Dunn AC, Flaxman AD, Fitzmaurice C, Naghavi M, Sadat N, Shieh P, Squires E, Yeung K, Murray CJL. Dieleman JL, et al. JAMA. 2020 Mar 3;323(9):863-884. doi: 10.1001/jama.2020.0734. JAMA. 2020. PMID: 32125402 Free PMC article. - Factors Associated With Increases in US Health Care Spending, 1996-2013.
Dieleman JL, Squires E, Bui AL, Campbell M, Chapin A, Hamavid H, Horst C, Li Z, Matyasz T, Reynolds A, Sadat N, Schneider MT, Murray CJL. Dieleman JL, et al. JAMA. 2017 Nov 7;318(17):1668-1678. doi: 10.1001/jama.2017.15927. JAMA. 2017. PMID: 29114831 Free PMC article. - Spending on Children's Personal Health Care in the United States, 1996-2013.
Bui AL, Dieleman JL, Hamavid H, Birger M, Chapin A, Duber HC, Horst C, Reynolds A, Squires E, Chung PJ, Murray CJ. Bui AL, et al. JAMA Pediatr. 2017 Feb 1;171(2):181-189. doi: 10.1001/jamapediatrics.2016.4086. JAMA Pediatr. 2017. PMID: 28027344 Free PMC article. - Tracking development assistance for health and for COVID-19: a review of development assistance, government, out-of-pocket, and other private spending on health for 204 countries and territories, 1990-2050.
Global Burden of Disease 2020 Health Financing Collaborator Network. Global Burden of Disease 2020 Health Financing Collaborator Network. Lancet. 2021 Oct 9;398(10308):1317-1343. doi: 10.1016/S0140-6736(21)01258-7. Epub 2021 Sep 22. Lancet. 2021. PMID: 34562388 Free PMC article. Review. - Issues in health care: interventional pain management at the crossroads.
Manchikanti L, Hirsch JA. Manchikanti L, et al. Pain Physician. 2007 Mar;10(2):261-84. Pain Physician. 2007. PMID: 17387349 Review.
Cited by
- A Local Heating Profile to Manage Lower Back Pain in an Automotive Seat: A Pilot Study.
Mallette MM, Gur-Arie N, Gerrett N. Mallette MM, et al. Bioengineering (Basel). 2024 Oct 18;11(10):1040. doi: 10.3390/bioengineering11101040. Bioengineering (Basel). 2024. PMID: 39451416 Free PMC article. - Comparing the effects of two different strains of mycobacteria, Mycobacterium vaccae NCTC 11659 and M. vaccae ATCC 15483, on stress-resilient behaviors and lipid-immune signaling in rats.
Loupy KM, Cler KE, Marquart BM, Yifru TW, D'Angelo HM, Arnold MR, Elsayed AI, Gebert MJ, Fierer N, Fonken LK, Frank MG, Zambrano CA, Maier SF, Lowry CA. Loupy KM, et al. Brain Behav Immun. 2021 Jan;91:212-229. doi: 10.1016/j.bbi.2020.09.030. Epub 2020 Oct 1. Brain Behav Immun. 2021. PMID: 33011306 Free PMC article. - Unmet needs as indicator of improving chronic care delivery system in China.
Ke XT, Wang CL, Salmon JW, Tang WX. Ke XT, et al. Chronic Dis Transl Med. 2020 Sep 4;7(1):1-13. doi: 10.1016/j.cdtm.2020.08.001. eCollection 2021 Mar. Chronic Dis Transl Med. 2020. PMID: 34013176 Free PMC article. Review. - Evidence-Based Medicine, Media, and Manipulation.
Chapman JR, Wiechert K, Wang JC. Chapman JR, et al. Global Spine J. 2018 Aug;8(5):437-439. doi: 10.1177/2192568218782480. Epub 2018 Jul 24. Global Spine J. 2018. PMID: 30258747 Free PMC article. No abstract available. - Diagnosis and Care of Chronic Health Conditions Among Medicaid Expansion Enrollees: a Mixed-Methods Observational Study.
Rosland AM, Kieffer EC, Tipirneni R, Kullgren JT, Kirch M, Arntson EK, Clark SJ, Lee S, Solway E, Beathard E, Ayanian JZ, Goold SD. Rosland AM, et al. J Gen Intern Med. 2019 Nov;34(11):2549-2558. doi: 10.1007/s11606-019-05323-w. Epub 2019 Sep 11. J Gen Intern Med. 2019. PMID: 31512184 Free PMC article.
References
- World Health Organization. The data repository. http://www.who.int/gho/database/en/. Accessed December 16, 2015.
- Centers for Medicare & Medicaid Services. National health expenditure data: historical. https://www.cms.gov/research-statistics-data-and-systems/statistics-tren.... Accessed December 16, 2015.
- National Health Expenditure Accounts. National Health Expenditure Accounts: methodology paper, 2014: definitions, sources, and methods. https://www.cms.gov/Research-Statistics-Data-and-Systems/Statistics-Tren.... Accessed November 15, 2015.
- Agency for Healthcare Research Quality. United States Medical Expenditure Panel Survey 1996–2013. https://meps.ahrq.gov/mepsweb/. Accessed November 15, 2016. - PubMed
- Roehrig C. Mental disorders top the list of the most costly conditions in the united states: $201 billion. Health Aff (Millwood) 2016;35(6):1130–1135. - PubMed
Publication types
MeSH terms
LinkOut - more resources
Full Text Sources
Other Literature Sources


