Cell cycle progression dictates the requirement for BCL2 in natural killer cell survival - PubMed (original) (raw)
. 2017 Feb;214(2):491-510.
doi: 10.1084/jem.20160869. Epub 2017 Jan 5.
Sophie Guia 1, Robert J Hennessy 2 3, Jai Rautela 2 3, Kim Pham 2 3, Claire Bernat 1, Wilford Goh 2 3, Yuhao Jiao 2 3 4, Rebecca Delconte 2 3, Michael Roger 1, Vanina Simon 1, Fernando Souza-Fonseca-Guimaraes 2 3, Stephanie Grabow 2 3, Gabrielle T Belz 2 3, Benjamin T Kile 2 3, Andreas Strasser 2 3, Daniel Gray 2 3, Phillip D Hodgkin 2 3, Bruce Beutler 5, Eric Vivier 1 6, Sophie Ugolini 7, Nicholas D Huntington 8 3
Affiliations
- PMID: 28057804
- PMCID: PMC5294858
- DOI: 10.1084/jem.20160869
Free PMC article
Cell cycle progression dictates the requirement for BCL2 in natural killer cell survival
Charlotte Viant et al. J Exp Med. 2017 Feb.
Free PMC article
Abstract
Natural killer (NK) cells are innate lymphoid cells with antitumor functions. Using an N-ethyl-N-nitrosourea (ENU)-induced mutagenesis screen in mice, we identified a strain with an NK cell deficiency caused by a hypomorphic mutation in the Bcl2 (B cell lymphoma 2) gene. Analysis of these mice and the conditional deletion of Bcl2 in NK cells revealed a nonredundant intrinsic requirement for BCL2 in NK cell survival. In these mice, NK cells in cycle were protected against apoptosis, and NK cell counts were restored in inflammatory conditions, suggesting a redundant role for BCL2 in proliferating NK cells. Consistent with this, cycling NK cells expressed higher MCL1 (myeloid cell leukemia 1) levels in both control and BCL2-null mice. Finally, we showed that deletion of BIM restored survival in BCL2-deficient but not MCL1-deficient NK cells. Overall, these data demonstrate an essential role for the binding of BCL2 to BIM in the survival of noncycling NK cells. They also favor a model in which MCL1 is the dominant survival protein in proliferating NK cells.
© 2017 Viant et al.
Figures
Figure 1.
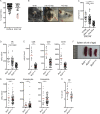
Analysis of the WE mutant mouse phenotype and identification of the causative mutation. (A) Selection of the ENU-148 pedigree using a functional screen based on an in vivo NK cell–killing assay. Splenocytes from WT and _b2m_-deficient (b2m−/−) mice were isolated, stained with two different concentrations of the fluorescent dye CFSE, and injected i.v. into the indicated recipient mice (C57BL/6 control mice or G3 animals from pedigree ENU-148). 2 d after transfer, the relative frequency of the CFSEhigh and CFSElow populations present in the blood of recipient mice was assessed by flow cytometry, and the percentages of b2m−/− cell killing were calculated. Three G3 mice with a defect in NK cell–mediated target cell killing were selected (red circle) and crossed to WT animals to generate a colony of mutant mice. An autosomal-recessive transmission of the mutation was observed, and the phenotype of affected animals was called WE. (B) In the ENU-148 colony, some mice showed progressive hair hypopigmentation. The pictures show a typical example of this phenotype for mice aged between 6 wk and >10 mo, as indicated. (C) NK cell counts in the blood of control (C57BL/6J) mice and mice from the pedigree ENU-148 presenting or not with hair hypopigmentation (gray and black, respectively). Each dot represents the results obtained for one mouse (n = 31–82, Kruskal–Wallis statistical test). (D) ENU-148 mice were segregated depending on their Bcl2 genotype, and the NK cell counts in peripheral blood were measured. Each dot represents the results obtained from an individual mouse (n = 18–79, Kruskal–Wallis statistical test). (E) Enumeration of CD4+, CD8+ T cells and B cells in the blood of Bcl2+/+ and Bcl2WE/WE mice (n = 18–67, Mann–Whitney statistical test). (F) Comparison of the size of the spleens from 9-wk-old Bcl2+/+, Bcl2WE/+, and Bcl2WE/WE mice. (G) Enumeration of monocytes, granulocytes, and eosinophils in the blood of Bcl2+/+ and Bcl2WE/WE mice (n = 18–67, Mann–Whitney statistical test). (H) Percentage of NK cells in the spleens of Bcl2+/+ and Bcl2WE/WE mice (n = 28, Mann–Whitney statistical test). Each dot corresponds to the data obtained from an individual mouse. Horizontal lines indicate the mean. *, P < 0.05; **, P < 0.01; and ****, P < 0.0001.
Figure 2.
_Bcl2_expression in WE splenocytes. (A) Schematic representation of the BCL2 protein. The point mutation responsible for the WE phenotype induces a change of tyrosine to cysteine at amino acid position 18 in the BH4 domain of the BCL2 protein. (B) Bcl2 mRNA expression was assessed by quantitative RT-PCR. The fold change in the expression of Bcl2 transcripts in Bcl2WE/WE versus Bcl2+/+ splenocytes is shown (n = 5). Each dot on the figure corresponds to the data obtained for a single experiment. (C) Analysis of BCL2 protein expression by immunoblotting in splenocytes from Bcl2WE/WE, Bcl2WE/+, and Bcl2+/+ mice (representative of three independent experiments). Probing for β-ACTIN was used as a loading control. (D) BCL2 expression was analyzed by flow cytometry. Representative intracellular staining of BCL2 in splenic NK cells from Bcl2WE/WE and Bcl2+/+ mice are shown (data shown are representative of three independent experiments).
Figure 3.
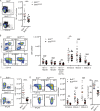
NK cells in the BM and the spleen of WE mice display an immature phenotype. (A, left) Representative flow cytometric profiles of BM-derived NK cells (CD122+ CD3−) from Bcl2+/+ and Bcl2WE/WE mice. (right) NK cell counts in the BM of Bcl2+/+ and Bcl2WE/WE mice (n = 23, Mann–Whitney statistical test). (B, left) Representative flow cytometric profiles of BM NK cell maturation states from Bcl2+/+ and Bcl2WE/WE mice: NK1.1− NKp46−, NK1.1+ NKp46−, NK1.1+ NKp46+ CD27− CD11b−, NK1.1+ NKp46+ CD27+ CD11b− (immature), NK1.1+ NKp46+ CD27+ CD11b+ (mature 1), and NK1.1+ NKp46+ CD27− CD11b+ (mature 2). (right) The relative cell counts of subsets of CD122+ CD3− BM NK cells is shown based on their maturation states (n = 23, paired Student’s t test). (C, left) Representative flow cytometric profiles of splenic NK cells (CD3− NKp46+) from Bcl2+/+ and Bcl2WE/WE mice. (right) NK cell counts in spleens from Bcl2+/+ and Bcl2WE/WE mice (n = 25, Mann–Whitney statistical test). (D) Representative flow cytometric profiles (left) and relative frequency of NK cell subsets (right) of splenic NK cells from Bcl2+/+ and Bcl2WE/WE mice: NK1.1+ NKp46+ CD27+ CD11b− (immature), NK1.1+ NKp46+ CD27+ CD11b+ (mature 1), NK1.1+ NKp46+ CD27− CD11b+ (mature 2; n = 20, two-way ANOVA with Bonferroni correction statistical test), and CD43+ expression (n = 20, Mann–Whitney statistical test). Each dot represents the data obtained from an individual mouse. Horizontal lines indicate the mean. *, P < 0.05; **, P < 0.01; ***, P < 0.001; and ****, P < 0.0001.
Figure 4.
A cell-intrinsic role of BCL2 in NK cell homeostasis. (A) Mixed BM chimera experiments were performed. WT CD45.1+ BM cells were mixed at a 1:1 ratio with either CD45.2+ Bcl2WE/WE or CD45.2+ Bcl2+/+ BM cells and transferred into lethally irradiated WT CD45.1 recipient. Chimeric mice were analyzed 12 wk later. (left) Representative flow cytometric profiles of NK cell reconstitution in the spleens of chimeric WT/Bcl2+/+ (top) and WT/Bcl2WE/WE (bottom) mice stained with anti-CD45.1 and anti-CD45.2 mAbs. (right) The percentages of CD45.1+ and CD45.2+ NK cells in the two groups of chimeras are shown. (B, left) Representative flow cytometric profiles of spleen NK cells (TCRβ− NKp46+) from Ncr1iCre/+Bcl2+/+ and Ncr1iCre/+Bcl2fl/fl mice. (right) NK cell counts in the spleens of Ncr1iCre/+Bcl2+/+ and Ncr1iCre/+Bcl2fl/fl mice (n = 10, Mann–Whitney statistical test). (C) Representative flow cytometric analysis (left) and relative counts of NK cell subsets in the spleens of Ncr1iCre/+Bcl2+/+ and Ncr1iCre/+Bcl2fl/fl mice were analyzed (middle): NK1.1+ NKp46+ CD27+ CD11b− (immature), NK1.1+ NKp46+ CD27+ CD11b+ (mature 1), NK1.1+ NKp46+ CD27− CD11b+ (mature 2; n = 4, two-way ANOVA with Bonferroni correction statistical test). CD43 expression on NK cells is also shown (right; n = 6, Mann-Whitney statistical test) of Ncr1iCre/+Bcl2+/+ and Ncr1iCre/+Bcl2fl/fl mice. (D) T and B cell counts in the spleens of Ncr1iCre/+Bcl2+/+ and Ncr1iCre/+Bcl2fl/fl mice (n = 6, two-way ANOVA with Bonferroni correction statistical test). Each dot corresponds to the data obtained from an individual mouse. Horizontal lines indicate the mean. **, P < 0.01; and ****, P < 0.0001.
Figure 5.
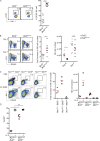
NK cell responsiveness in Bcl2WE/WE mutant mice. (A, left) Representative flow cytometric profiles of IFN-γ and CD107 expression in Bcl2+/+ or Bcl2WE/WE NK cells after 4 h of NK1.1 stimulation. (middle and right) Percentage of IFN-γ+ or CD107+ NK cells after 4 h of activation with an Ig isotype-matched control mAb (IC), anti-NK1.1 mAb, IL-12, and IL-18 or PMA plus ionomycin (PMA-iono; n = 8–11, two-way ANOVA with Bonferroni correction statistical test). Each dot corresponds to the data obtained from a single mouse. (B) Representative flow cytometric profiles of IFN-γ and CD107 expression in Bcl2+/+ or Bcl2WE/WE LAK cells, after 4 h of incubation with YAC-1 cells. Representative of four mice in two experiments. (C) Ncr1iCre/+Bcl2+/+ and Ncr1iCre/+Bcl2fl/fl mice were injected i.v. with E0771-LMB mCherry+ breast cancer cells. Lung metastases were measured 14 d later by IVIS Spectrum in vivo imaging system (PerkinElmer) for mCherry fluorescence (vertical axis: total radiant efficiency [(p/s)/ÌW/cm2] × 1e6). P = 0.008, n = 5, Mann–Whitney statistical test. Horizontal lines indicate the mean. *, P < 0.05.
Figure 6.
Impaired NK cell survival in _BCL2_-deficient mice is restored in inflammatory conditions. (A, left) Representative flow cytometric profiles of Bcl2+/+ and Bcl2WE/WE splenic NK cells, stained with dead cell marker (DCM) after 4 h of in vitro culture in complete medium. (right) Percentages of DCM+ NK cells (n = 21, Mann–Whitney statistical test). (B, left) Representative flow cytometric profiles of spleen NK cells (CD3− NKp46+) from Bcl2+/+ and Bcl2WE/WE mice 0 or 7 d after MCMV infection. (middle) Increase in NK cell number in the spleen 7 d after MCMV infection (n = 8, Mann–Whitney statistical test). (right) Spleen NK cell counts 0 or 7 d after MCMV infection in Bcl2+/+ and Bcl2WE/WE mice (n = 8, two-way ANOVA with Bonferroni correction statistical test). (C, left) Representative flow cytometric profiles of spleen NK cells (TCRβ− NKp46+) from Ncr1iCre/+Bcl2+/+, Ncr1iCre/+Bcl2fl/fl, and Ncr1iCre/+Mcl1fl/fl mice injected with PBS or IL-2/S4B6. (right) Spleen NK cell fold increase and counts after PBS or IL-2/S4B6 injection. (D) Percentages of Ki67+ NK cells in Ncr1iCre/+Bcl2+/+ and Ncr1iCre/+Bcl2fl/fl mice after PBS or IL-2/S4B6 injection. Each dot corresponds to the data obtained for an individual mouse. Horizontal lines indicate the mean. *, P < 0.05; **, P < 0.01; and ****, P < 0.0001.
Figure 7.
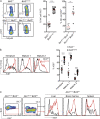
BCL2 loss is intrinsically linked to an increase of proliferating NK cells. (A, left) Representative flow cytometric profiles of Bcl2+/+ and Bcl2WE/WE or Ncr1iCre/+Bcl2+/+ and Ncr1iCre/+Bcl2fl/fl splenic NK cells, stained with anti-Ki67 mAb. (right) Percentages of Ki67+ NK cells (Bcl2+/+/Bcl2WE/WE n = 21, Ncr1iCre/+Bcl2+/+/Ncr1iCre/+Bcl2fl/fl n = 7, Mann–Whitney statistical test). Each dot represents the data obtained for a single mouse. (B, left) Representative flow cytometric profiles of Ki67 staining in the indicated NK cell subsets: NK1.1+ NKp46+ CD27+ CD11b− (immature), NK1.1+ NKp46+ CD27+ CD11b+ (mature 1), and NK1.1+ NKp46+ CD27− CD11b+ (mature 2). (right) The percentages of Ki67+ cells in the indicated NK cell subsets from Bcl2+/+ and Bcl2WE/WE mice (n = 21, two-way ANOVA with Bonferroni correction statistical test). Each dot represents the data obtained for a single mouse. (C) Representative flow cytometric profiles of the liver, BM, and spleen NK cells from Ncr1iCre/+Bcl2+/+ and Ncr1iCre/+Bcl2fl/fl mice stained with anti-BCL2 and anti-Ki67 mAbs. Data are representative of three independent experiments. Horizontal lines indicate the mean. **, P < 0.01; and ****, P < 0.0001.
Figure 8.
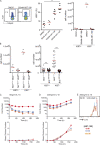
NK cells in cell cycle are less dependent on BCL2 for their survival. (A) NK cells from C57BL/6 mice were cultured for 20 h in DMSO or 30 nM, 100 nM, or 300 nM of the BCL2 inhibitor ABT-199. Representative flow cytometric profiles of Ki67 staining on NK cells (left) and percentages of Ki67+ NK cells (middle) are shown (n = 3–6 Kruskal–Wallis statistical test). Ki67+ and Ki67− NK cell counts are shown for DMSO or 300 nM ABT-199 culture (right). (B) Ki67+ and Ki67− NK cell counts are shown for Ncr1iCre/+Bcl2+/+ and Ncr1iCre/+Bcl2fl/fl mice (left, n = 4) and for Bcl2+/+ and Bcl2WE/WE mice (right, n = 19 Kruskal–Wallis statistical test). Horizontal lines indicate the mean. ***, P < 0.001; and ****, P < 0.0001. (C and D) Cell numbers and mean division number versus time graphs of C57BL/6 NK cells cultured in the presence of 10 ng/ml IL-15 (C) or 200 ng/ml IL-15 (D) and 0 nM, 30 nM, or 100 nM of the BCL2 inhibitor ABT-199. Error bars indicate SEM. (E) CTV profiles at 69.5 h, with the undivided peak depicted (n = 1, in triplicate, from pooled spleens of 12 mice).
Figure 9.
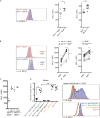
MCL1 expression is increased in _BCL2_-deficient NK cells. (A, left) Representative flow cytometric profiles of MCL1 expression in NK cells from Ncr1iCre/+Bcl2+/+ and Ncr1iCre/+Bcl2fl/fl are shown. (right) Expression levels of MCL1 (mean fluorescence intensity [MFI]) in NK cells from Ncr1iCre/+Bcl2+/+ and Ncr1iCre/+Bcl2fl/fl (n = 6), Bcl2+/+, and Bcl2WE/WE mice (n = 9, Mann–Whitney statistical test). (B, left) Representative flow cytometric analysis of MCL1 expression in Ki67− and Ki67+ NK cells from Ncr1iCre/+Bcl2+/+ and Ncr1iCre/+Bcl2fl/fl mice. (right) MCL1 expression (MFI) in cycling (Ki67+) or quiescent (Ki67−) NK cell subsets from Ncr1iCre/+Bcl2+/+ and Ncr1iCre/+Bcl2fl/fl (n = 4) as well as Bcl2+/+ and Bcl2WE/WE mice (n = 8, two-way ANOVA with Bonferroni correction statistical test). (C) MFI of MCL1 expression in NK cells from Ncr1iCre/+Bcl2+/+ and Ncr1iCre/+Bcl2fl/fl mice after PBS or IL-2/S4B6 injection. Each dot corresponds to the data obtained for an individual mouse. (D) Enumeration of NK cells from the spleens of Ncr1iCre/+Bcl2+/+, Ncr1iCre/+Bcl2fl/fl, Ncr1iCre/+Bcl2l11fl/fl, Ncr1iCre/+Mcl1fl/fl, Ncr1iCre/+Bcl2fl/flBcl2l11fl/fl, and Ncr1iCre/+Mcl1fl/flBcl2l11fl/fl mice. Each dot corresponds to the data obtained for an individual mouse. **, P = 0.008; n = 5 (Mann–Whitney statistical test). (E) Ki67 and MCL1 expression in splenic NK cells from the indicated mice. Histograms are representative of five mice per genotype. Horizontal lines indicate the mean. *, P < 0.05; **, P < 0.01; ***, P < 0.001; and ****, P < 0.0001.
Similar articles
- Recipient BCL2 inhibition and NK cell ablation form part of a reduced intensity conditioning regime that improves allo-bone marrow transplantation outcomes.
Jiao Y, Davis JE, Rautela J, Carrington EM, Ludford-Menting MJ, Goh W, Delconte RB, Souza-Fonseca-Guimaraes F, Koldej R, Gray D, Huang D, Kile BT, Lew AM, Ritchie DS, Huntington ND. Jiao Y, et al. Cell Death Differ. 2019 Aug;26(8):1516-1530. doi: 10.1038/s41418-018-0228-y. Epub 2018 Nov 12. Cell Death Differ. 2019. PMID: 30420758 Free PMC article. - Targeting of BCL2 Family Proteins with ABT-199 and Homoharringtonine Reveals BCL2- and MCL1-Dependent Subgroups of Diffuse Large B-Cell Lymphoma.
Klanova M, Andera L, Brazina J, Svadlenka J, Benesova S, Soukup J, Prukova D, Vejmelkova D, Jaksa R, Helman K, Vockova P, Lateckova L, Molinsky J, Maswabi BC, Alam M, Kodet R, Pytlik R, Trneny M, Klener P. Klanova M, et al. Clin Cancer Res. 2016 Mar 1;22(5):1138-49. doi: 10.1158/1078-0432.CCR-15-1191. Epub 2015 Oct 14. Clin Cancer Res. 2016. PMID: 26467384 - Tuning of natural killer cell reactivity by NKp46 and Helios calibrates T cell responses.
Narni-Mancinelli E, Jaeger BN, Bernat C, Fenis A, Kung S, De Gassart A, Mahmood S, Gut M, Heath SC, Estellé J, Bertosio E, Vely F, Gastinel LN, Beutler B, Malissen B, Malissen M, Gut IG, Vivier E, Ugolini S. Narni-Mancinelli E, et al. Science. 2012 Jan 20;335(6066):344-8. doi: 10.1126/science.1215621. Science. 2012. PMID: 22267813 - A novel Ncr1-Cre mouse reveals the essential role of STAT5 for NK-cell survival and development.
Eckelhart E, Warsch W, Zebedin E, Simma O, Stoiber D, Kolbe T, Rülicke T, Mueller M, Casanova E, Sexl V. Eckelhart E, et al. Blood. 2011 Feb 3;117(5):1565-73. doi: 10.1182/blood-2010-06-291633. Epub 2010 Dec 2. Blood. 2011. PMID: 21127177 - Role of the antiapoptotic proteins BCL2 and MCL1 in the neonatal mouse ovary.
Jones RL, Pepling ME. Jones RL, et al. Biol Reprod. 2013 Feb 21;88(2):46. doi: 10.1095/biolreprod.112.103028. Print 2013 Feb. Biol Reprod. 2013. PMID: 23269665
Cited by
- Crosstalk between gut microbiota and host immune system and its response to traumatic injury.
Ullah H, Arbab S, Tian Y, Chen Y, Liu CQ, Li Q, Li K. Ullah H, et al. Front Immunol. 2024 Jul 31;15:1413485. doi: 10.3389/fimmu.2024.1413485. eCollection 2024. Front Immunol. 2024. PMID: 39144142 Free PMC article. Review. - Evaluation of allogeneic and autologous membrane-bound IL-21-expanded NK cells for chronic lymphocytic leukemia therapy.
Yano M, Sharpe C, Lance JR, Ravikrishnan J, Zapolnik K, Mo X, Woyach JA, Sampath D, Kittai AS, Vasu S, Bhat S, Rogers KA, Lee DA, Muthusamy N, Byrd JC. Yano M, et al. Blood Adv. 2022 Oct 25;6(20):5641-5654. doi: 10.1182/bloodadvances.2021005883. Blood Adv. 2022. PMID: 35486482 Free PMC article. - Differential IL-12 signaling induces human natural killer cell activating receptor-mediated ligand-specific expansion.
Shemesh A, Pickering H, Roybal KT, Lanier LL. Shemesh A, et al. J Exp Med. 2022 Aug 1;219(8):e20212434. doi: 10.1084/jem.20212434. Epub 2022 Jun 27. J Exp Med. 2022. PMID: 35758909 Free PMC article. - The cancer-natural killer cell immunity cycle.
Huntington ND, Cursons J, Rautela J. Huntington ND, et al. Nat Rev Cancer. 2020 Aug;20(8):437-454. doi: 10.1038/s41568-020-0272-z. Epub 2020 Jun 24. Nat Rev Cancer. 2020. PMID: 32581320 Review. - Loss-of-Function in SMAD4 Might Not Be Critical for Human Natural Killer Cell Responsiveness to TGF-β.
Healy LP, Rossi GR, Rautela J, Slade CA, Huntington ND, Winship IM, Souza-Fonseca-Guimaraes F. Healy LP, et al. Front Immunol. 2019 May 1;10:904. doi: 10.3389/fimmu.2019.00904. eCollection 2019. Front Immunol. 2019. PMID: 31118932 Free PMC article.
References
- Bergamaschi, C., Bear J., Rosati M., Beach R.K., Alicea C., Sowder R., Chertova E., Rosenberg S.A., Felber B.K., and Pavlakis G.N.. 2012. Circulating IL-15 exists as heterodimeric complex with soluble IL-15Rα in human and mouse serum. Blood. 120:e1–e8. 10.1182/blood-2011-10-384362 - DOI - PMC - PubMed
Publication types
MeSH terms
Substances
LinkOut - more resources
Full Text Sources
Other Literature Sources
Molecular Biology Databases
Research Materials
