Stromal Cell Subsets Directing Neonatal Spleen Regeneration - PubMed (original) (raw)
Stromal Cell Subsets Directing Neonatal Spleen Regeneration
Jonathan K H Tan et al. Sci Rep. 2017.
Abstract
Development of lymphoid tissue is determined by interactions between stromal lymphoid tissue organiser (LTo) and hematopoietic lymphoid tissue inducer (LTi) cells. A failure for LTo to receive appropriate activating signals during embryogenesis through lymphotoxin engagement leads to a complete cessation of lymph node (LN) and Peyer's patch development, identifying LTo as a key stromal population for lymphoid tissue organogenesis. However, little is known about the equivalent stromal cells that induce spleen development. Here, by dissociating neonatal murine spleen stromal tissue for re-aggregation and transplant into adult mouse recipients, we have identified a MAdCAM-1+CD31+CD201+ spleen stromal organizer cell-type critical for new tissue formation. This finding provides an insight into the regulation of post-natal spleen tissue organogenesis, and could be exploited in the development of spleen regenerative therapies.
Figures
Figure 1. Development of spleen tissue from 3 day-old spleen stromal cell aggregates.
(A) Schematic diagram of aggregate transplantation. Spleen stromal tissues from day 3 (D3) postnatal mice were isolated and enzymatically digested into a single-cell suspension. Cells were then aggregated and aliquoted on top of a collagen sheet resting over an isopore membrane/collagen sponge complex immersed in cell culture medium. Following overnight incubation, cell aggregate/collagen sheet constructs were transplanted under the kidney capsule of adult splenectomised recipient mice. (B) Macroscopic appearance of regenerated spleen tissue 4 weeks post-transplantation. Scale bar, 5 mm. (C) To optimize graft construction, cells derived from D3 spleen stromal tissue were aggregated and transplanted alone or above collagen sheets, or collagen sponges were loaded with equivalent cell numbers but omitting cell aggregation. Transplantation of all graft constructs were performed independently a minimum of 2 times, with 2–8 grafts/experiment. (D) Percent T and B cells in each construct 4 weeks post-transplantation was assessed by flow cytometry. Age-matched non-surgery mouse spleen was used as a control. (E) Spleen structure of 4 week grafts or control spleen visualized by immunofluorescence microscopy (RP, red pulp; MZ, marginal zone. Arrows indicate central arterioles). Original magnification 100×. Scale bar, 200 μm.
Figure 2. Stromal and lymphoid composition of early neonatal spleen.
3-day old spleen was cryosectioned and stained with indicated markers before immunofluorescence analysis to differentiate tissue micro-architecture (RP, red pulp; MZ, marginal zone; FRC, fibroblastic reticular cells. Arrows indicate central arterioles). Original magnification 100×. Scale bar, 200 μm.
Figure 3. Spleen tissue regeneration from neonatal spleen stromal cell aggregates occurs independently of donor-derived hematopoietic cells.
(A) D3 spleen stromal tissue was digested into a single-cell suspension and magnetically separated using biotin-conjugated anti-CD45 antibodies and anti-biotin microbeads into marker positive and negative fractions. (B) Separation purity was assessed by a flow cytometer using APC-eFluor780-conjugated anti-CD45 antibody and streptavidin-PE secondary reagent. Numbers in quadrants indicate percent cells. (C) CD45+ and CD45− cell fractions were aggregated and placed over collagen sheets before transplantation and 4 week analysis by immunofluorescence microscopy using indicated markers (original magnification 100×, Scale bar, 200 μm). RP, red pulp; MZ, marginal zone; CA, central arterioles. Data are representative of two independent experiments.
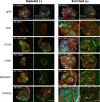
Figure 4. Spleen tissue regeneration of aggregate grafts prepared by magnetic depletion or enrichment of stromal cell subsets.
Aggregates were depleted (−) or enriched (+) of cells based on single markers before transplantation and assessment of tissue regeneration after 4 weeks by immunofluorescence microscopy. Representative images of graft development from cell marker depleted or enriched aggregates showing comparative efficiencies in formation of full spleen tissue architecture. Top left inserts show enumeration of total grafts recovered. Asterisks indicate organized T/B cell white pulp follicles; MZ, marginal zone. Original magnification 40×. Scale bar, 500 μm.
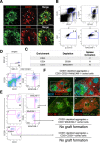
Figure 5. Neonatal CD45−CD31+CD105+CD201+MAdCAM-1+ cells represent spleen organizers.
Cell markers shown to enrich for spleen forming activity (Table 1) were used to (A) assess D3 neonatal spleen sections for stromal cells co-expressing MAdCAM-1 and CD201 or CD31 (arrowheads; scale bar, 50 μm), and (B) identify a single CD45−CD31+CD105+CD201+MAdCAM-1+ stromal population by flow cytometry. (C) CD31+ aggregates from D3 spleen capable of tissue regeneration were depleted of CD201 or MAdCAM-1 expressing cells before aggregation and transplantation to confirm whether spleen forming activity segregated with CD31+CD201+ and CD31+MAdCAM-1+ populations. Formation of spleen tissue was assessed 4 weeks post-transplant. Each separation and transplantation was performed twice (2–3 grafts/experiment). (D) To ascertain bona fide spleen organizers, CD45−CD31+CD201+MAdCAM-1+ cells gated to exclude doublets were sorted by FACS and the purity verified (E). CD45−CD31+CD201+MAdCAM-1− and CD45−CD31−CD201hi cells were sorted in parallel as negative controls. (F) Sorted populations were re-added to aggregates depleted of CD201+ spleen-forming cells before transplantation. Tissues collected after 4 weeks were analyzed by immunofluorescence staining with indicated markers (ii, iii and iv, 100×). Scale bar, 200 μm. Enlargement of (i) (40×) is shown in (ii). RP, red pulp; MZ, marginal zone; FDC, follicular dendritic cells. No graft formation indicates the absence of trace spleen tissue. Data are representative of two independent experiments.
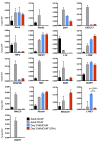
Figure 6. Relative abundance of mRNA transcripts in spleen organizer (SPo) cells.
To determine gene expression between CD45−CD31+CD201+MAdCAM-1+ (MAdCAM-1+) SPo and CD45−CD31+CD201+MAdCAM-1− (MAdCAM-1−) cells that do not induce spleen organogenesis, each population was sorted to purity from D3 spleen and assessed for the expression of mRNA by real-time quantitative PCR. CD45+ hematopoietic or CD45− stromal cells enriched from adult spleen were used as controls. Gene expression was normalized to β-actin. n = 3, error bars indicate SEM. ***P<0.001; unpaired two-tailed t test.
Similar articles
- Murine spleen tissue regeneration from neonatal spleen capsule requires lymphotoxin priming of stromal cells.
Tan JK, Watanabe T. Tan JK, et al. J Immunol. 2014 Aug 1;193(3):1194-203. doi: 10.4049/jimmunol.1302115. Epub 2014 Jun 20. J Immunol. 2014. PMID: 24951816 Free PMC article. - Organizer-like reticular stromal cell layer common to adult secondary lymphoid organs.
Katakai T, Suto H, Sugai M, Gonda H, Togawa A, Suematsu S, Ebisuno Y, Katagiri K, Kinashi T, Shimizu A. Katakai T, et al. J Immunol. 2008 Nov 1;181(9):6189-200. doi: 10.4049/jimmunol.181.9.6189. J Immunol. 2008. PMID: 18941209 - Separation of splenic red and white pulp occurs before birth in a LTalphabeta-independent manner.
Vondenhoff MF, Desanti GE, Cupedo T, Bertrand JY, Cumano A, Kraal G, Mebius RE, Golub R. Vondenhoff MF, et al. J Leukoc Biol. 2008 Jul;84(1):152-61. doi: 10.1189/jlb.0907659. Epub 2008 Apr 10. J Leukoc Biol. 2008. PMID: 18403646 - Cellular and molecular requirements in lymph node and Peyer's patch development.
Coles M, Kioussis D, Veiga-Fernandes H. Coles M, et al. Prog Mol Biol Transl Sci. 2010;92:177-205. doi: 10.1016/S1877-1173(10)92008-5. Prog Mol Biol Transl Sci. 2010. PMID: 20800822 Review. - Stromal cell regulation of homeostatic and inflammatory lymphoid organogenesis.
Kain MJ, Owens BM. Kain MJ, et al. Immunology. 2013 Sep;140(1):12-21. doi: 10.1111/imm.12119. Immunology. 2013. PMID: 23621403 Free PMC article. Review.
Cited by
- CD201+ fascia progenitors choreograph injury repair.
Correa-Gallegos D, Ye H, Dasgupta B, Sardogan A, Kadri S, Kandi R, Dai R, Lin Y, Kopplin R, Shenai DS, Wannemacher J, Ichijo R, Jiang D, Strunz M, Ansari M, Angelidis I, Schiller HB, Volz T, Machens HG, Rinkevich Y. Correa-Gallegos D, et al. Nature. 2023 Nov;623(7988):792-802. doi: 10.1038/s41586-023-06725-x. Epub 2023 Nov 15. Nature. 2023. PMID: 37968392 Free PMC article. - Skeletal stem/progenitor cells provide the niche for extramedullary hematopoiesis in spleen.
O'Neill HC, Lim HK. O'Neill HC, et al. Front Physiol. 2023 Mar 17;14:1148414. doi: 10.3389/fphys.2023.1148414. eCollection 2023. Front Physiol. 2023. PMID: 37007998 Free PMC article. - Spleen regeneration after subcutaneous heterotopic autotransplantation in a mouse model.
Elchaninov A, Vishnyakova P, Lokhonina A, Kiseleva V, Menyailo E, Antonova M, Mamedov A, Arutyunyan I, Bolshakova G, Goldshtein D, Bao X, Fatkhudinov T, Sukhikh G. Elchaninov A, et al. Biol Res. 2023 Mar 29;56(1):15. doi: 10.1186/s40659-023-00427-4. Biol Res. 2023. PMID: 36991509 Free PMC article. - Spleen: Reparative Regeneration and Influence on Liver.
Elchaninov A, Vishnyakova P, Sukhikh G, Fatkhudinov T. Elchaninov A, et al. Life (Basel). 2022 Apr 22;12(5):626. doi: 10.3390/life12050626. Life (Basel). 2022. PMID: 35629294 Free PMC article. Review. - Decellularized Splenic Matrix as a Scaffold for Spleen Bioengineering.
Zanardo TÉC, Amorim FG, Taufner GH, Pereira RHA, Baiense IM, Destefani AC, Iwai LK, Maranhão RC, Nogueira BV. Zanardo TÉC, et al. Front Bioeng Biotechnol. 2020 Oct 2;8:573461. doi: 10.3389/fbioe.2020.573461. eCollection 2020. Front Bioeng Biotechnol. 2020. PMID: 33123515 Free PMC article.
References
Publication types
MeSH terms
Substances
LinkOut - more resources
Full Text Sources
Other Literature Sources


