Starved epithelial cells uptake extracellular matrix for survival - PubMed (original) (raw)
Starved epithelial cells uptake extracellular matrix for survival
Taru Muranen et al. Nat Commun. 2017.
Abstract
Extracellular matrix adhesion is required for normal epithelial cell survival, nutrient uptake and metabolism. This requirement can be overcome by oncogene activation. Interestingly, inhibition of PI3K/mTOR leads to apoptosis of matrix-detached, but not matrix-attached cancer cells, suggesting that matrix-attached cells use alternate mechanisms to maintain nutrient supplies. Here we demonstrate that under conditions of dietary restriction or growth factor starvation, where PI3K/mTOR signalling is decreased, matrix-attached human mammary epithelial cells upregulate and internalize β4-integrin along with its matrix substrate, laminin. Endocytosed laminin localizes to lysosomes, results in increased intracellular levels of essential amino acids and enhanced mTORC1 signalling, preventing cell death. Moreover, we show that starved human fibroblasts secrete matrix proteins that maintain the growth of starved mammary epithelial cells contingent upon epithelial cell β4-integrin expression. Our study identifies a crosstalk between stromal fibroblasts and epithelial cells under starvation that could be exploited therapeutically to target tumours resistant to PI3K/mTOR inhibition.
Figures
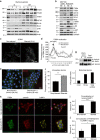
Figure 1. Starved mammary epithelial cells induce β4-integrin expression and internalize laminin.
(a) Levels of total proteins and S6 phosphorylation (S235/236) in lysates from mouse mammary glands of AL and DR mice (_n_=4). (b) Levels of total proteins, phosphorylated S6K1 (T389), S6 (S235/236) and AKT (S473) in lysates from non-starved (NS), 24-h starved (S), confluent (confl.) or subconfluent (sub-confl.) MCF10A cells; GAPDH, glyceraldehyde 3-phosphate dehydrogenase. (c,d) Confocal images of immunofluorescently stained ITGB4 in non-starved or starved MCF10A cells (c), with line scan quantification (d) of integrin localization from cell edge towards cell interior, representing the fluorescence intensity average (38 cells per condition); P values were measured by Student's _t_-test along the length of the line scan (0.017), or at the cell edge, indicated by the arrow (0.023); scale bar, 30 μm. (e,f) Confocal images (e) and quantification of fluorescence intensity (f) of laminin-Alexa-647 (red) added (2.5 μg ml−1, 30 min) to non-starved or starved MCF10A cells. The cells were immunostained for ITGB4 (green), and the nuclei counterstained with DAPI (blue); intracellular laminin fluorescence intensity was measured in 28 cells per condition using the confocal mid-sections by ImageJ; Student's _t_-test, **P<0.01; scale bar, 30 μm. (g) Top, laminin internalization (intern.) assay in starved MCF10A cells demonstrating increased uptake of biotinylated laminin at the 15 min (compared with 0 min) time point. Total surface bitotinylation is shown as positive control. The cells were lysed and probed for biotin by western blot (wb) after laminin immunoprecipitation (ip). The blot was then stripped and re-probed for total laminin as a loading control; bottom, quantification of biotinylated laminin normalized to total immunoprecipitated laminin. (h) Confocal images of non-starved or 24-h starved MCF10A cells that were fed laminin (2.5 μg ml−1, 1 h). The cells were stained for ITGB4 (green), laminin (red) or LAMP1 (yellow). z, x and y planes are shown from images reconstructed from serial sections obtained throughout whole cells and demonstrate intracellular staining; scale bar, 20 μm. (i,j) Co-localization of laminin and LAMP1 (i) or ITGB4 and laminin in LAMP1-positive regions (j) as analysed in 150 cells per condition, using ImageJ; Student's _t_-test, *P<0.05 and ***P<0.001. Data in (d,f,i,j) represent the mean±s.e.m.
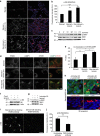
Figure 2. Treatment of starved mammary epithelial cells with laminin results in mTORC1 activation.
(a,b) Confocal images (a) and quantification of immunofluorescence (b) of p-S6 (S240/244, red) in 24-h starved MCF10A cells, or starved/non-starved MCF10A cells treated with laminin (2.5 μg ml−1, 1 h); nuclei were counterstained with DAPI (blue); scale bar, 50 μm. Fluorescence intensity in ∼300 cells per condition was quantified by ImageJ; one-way analysis of variance (ANOVA), Tukey test, ***P<0.001. (c) Levels of total proteins and S6K1 phosphorylation (T389) in lysates of 24-h starved MCF10A cells treated with laminin (2.5 μg ml−1) for the indicated times. (d,e) Confocal images (d) of MCF10A cells treated as in a, showing localization by immunofluorescent staining, of ITGB4, LAMP1 (green), mTOR (red) and overlay of LAMP1 and mTOR; scale bar, 5 μm; co-localization (e) was analysed and quantified from confocal sections in ∼50 cells per condition using ImageJ; one-way ANOVA, Tukey test, *_P_=0.05; **P<0.01. (f) Levels of total proteins and phosphorylated S6 (S240/244) in lysates of MCF10A cells treated as in a. Where indicated, the cells were first incubated for 10 min with concanamycin A (8 μM), followed by laminin/concanamycin A co-incubation for 1 h and then lysed. DMSO was used as a vehicle control. (g) Levels of total proteins and phosphorylated S6K1 (T389) in lysates of MCF10A cells treated as in a. Where indicated, the cells were treated for 30 min with the dynamin inhibitor Iminodyn-22 (2 μM), followed by laminin/Iminodyn-22 co-incubation for 1 h. (h) Top, confocal images of 24-h-starved MCF10A cells treated with iminodyn-22 for 30 min, before addition of Alexa-647-laminin (red, 2.5 μg ml−1, 1 h). The cells were fixed and immunostained for ITGB4 (green) and nuclei counterstained with DAPI (blue). Bottom, three-dimensional projection of cells in the top panel imaged with confocal sectioning, that shows accumulation of extracellular laminin post-iminodyn treatment; scale bar, 10 μm. (i,j) Confocal images of 24-h starved MCF10A cells incubated with ITGB4-blocking antibody for 3 h, before laminin addition (2.5 μg ml−1, 1 h). The cells were immunostained for phosphorylated S6 (S240/244; i) and fluorescence intensity-quantified (j) as described in b; scale bar, 100 μm; Student's _t_-test, ***P<0.001. In b,e,j, data represent the mean±s.e.m.
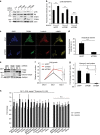
Figure 3. β4-integrin is required for laminin uptake and survival of starved epithelial cells.
(a) Levels of total proteins and phosphorylated S6 (S235/236) in lysates of MCF10A cells treated with siRNAs for Luciferase (Luc), ITGB1 or ITGB4, and then starved for 24 h and either fed vehicle (PBS) or laminin (2.5 μg ml−1) for 1 h. (b) MCF10A cells treated as in a were immunostained for phosphorylated S6 (S240/244), imaged and fluorescence intensity-quantified using ImageJ (∼400 cells per condition); Student's _t_-test, **P<0.01; n.s., nonsignificant. (c,d) Confocal images (c) of MCF10A cells treated as in b, but immunostained for ITGB4 (green), laminin (red) or LAMP1 (yellow); nuclei were counterstained with DAPI (blue); scale bar, 20 μm. Intracellular laminin fluorescence intensity (d) was quantified by ImageJ as in b, ∼50 cells per condition; Student's _t_-test, ***P<0.001. (e) Levels of total proteins in lysates from MCF10A cells treated with siRNAs for GFP, ITGB1 or ITGB4 and then either non-starved (NS) or starved (S) for 48 h. (f,g) Relative number of MCF10A cells treated with siRNAs as in e, and then starved for 48 h, and counted on days 0, 1 and 2 of starvation (f); cell numbers were normalized to day 0 (g); _n_=3; one-way ANOVA, Tukey test, *P<0.05; **P<0.01; n.s., nonsignificant. (h) Fold changes of amino acid levels in MCF10A cells starved for 24 h and then treated for 1 h with laminin compared with vehicle control. Each value represents the average of four replicates per condition, normalized to the median for each metabolite, with error bars representing s.d.; P values were measured by Student's _t_-test. In b,d,g, data represent the mean±s.e.m.
Figure 4. Mammary glands display increased intracellular laminin upon dietary restriction.
(a) Confocal images of mouse mammary glands isolated from AL or DR mice and immunostained for laminin; arrowheads depict adipocytes and arrows point to mammary glands; scale bars, 10 μm. (b) Laminin fluorescence intensity over the axis of whole cells from basal edge to lumen was measured in linescans in Fiji (∼250 cells in ≥10 mammary glands, five mice per group) as marked in yellow (top). The graph (bottom) shows more diffuse laminin staining in the DR conditions with a less well-defined basal edge; Student's _t_-test, ***P<0.001; scale bar, 20 μm. (c) Laminin fluorescence intensity was analysed by ImageJ from intracellular regions in ∼120–200 cells from 15 mammary glands, four mice per condition; each value represents the mean±s.e.m.; Student's _t_-test, ***P<0.001.
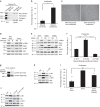
Figure 5. Fibroblasts secrete matrix proteins that enhance epithelial cell survival under starvation.
(a) Levels of matrix proteins in total cell lysates and TCA-precipitated secreted proteins in the media of primary human fibroblasts or MCF10A cells starved for 7 days. Loading was normalized to cell number. (b) Fold proliferation of MCF10A cells that were first starved for 24 h and then treated daily with non-conditioned, or conditioned medium from starved primary human fibroblasts for 12 days; _n_=3; Student's _t_-test, *P<0.05. (c) Phase contrast image of MCF10A cells treated as in b for 48 h; scale bar, 100 μm. (d) Levels of total proteins, phosphorylated S6K1 (T389) and AKT (S473) in lysates from 24-h starved MCF10A cells treated for 1 h with conditioned or non-conditioned media of starved (S) or non-starved (NS) fibroblasts. (e) Levels of proteins as in d and phosphorylated S6 (S235/236) from MCF10A cells treated with siRNAs for GFP, ITGB1 or ITGB4, starved for 24 h, and then incubated with conditioned (C) or non-conditioned (NC) starved fibroblast media. (f) Fold proliferation of MCF10A cells with stable knockdown of GFP, ITGB1 or ITGB4. The cells were starved for 24 h, and then fed conditioned starved fibroblast medium every 24 h for 8 days; _n_=3; one-way ANOVA, Tukey test, *P<0.05; **_P_=0.01; ***P<0.001. (g) Total laminin levels in TCA-precipitated proteins in the media of 24-h starved primary human fibroblasts, before or following laminin depletion using a laminin antibody affinity column. Loading was normalized to cell number. (h) Levels of proteins as in e in lysates from 24-h starved MCF10A cells treated for 1 h with NC, C or conditioned laminin-depleted (C-Lam)-starved fibroblast media. (i) Fold change in cell number of 24-h starved MCF10A cells fed daily with fibroblast media as in h for 10 days; _n_=3; one-way ANOVA, Tukey test, **P<0.01. (j) Levels of proteins in MCF10A cells treated as in h, or treated with laminin-5 (2.5 μg, C-lam+lam) for 1 h after culture for 24 h in laminin-depleted conditioned medium. In b,f,i, each value represents the mean±s.e.m.
Similar articles
- Loss of beta4 integrin subunit reduces the tumorigenicity of MCF7 mammary cells and causes apoptosis upon hormone deprivation.
Bon G, Folgiero V, Bossi G, Felicioni L, Marchetti A, Sacchi A, Falcioni R. Bon G, et al. Clin Cancer Res. 2006 Jun 1;12(11 Pt 1):3280-7. doi: 10.1158/1078-0432.CCR-05-2223. Clin Cancer Res. 2006. PMID: 16740748 - Keratinocyte growth factor (KGF) induces podosome formation via integrin-Erk1/2 signaling in human immortalized oral epithelial cells.
Sa G, Liu Z, Ren J, Wan Q, Xiong X, Yu Z, Chen H, Zhao Y, He S. Sa G, et al. Cell Signal. 2019 Sep;61:39-47. doi: 10.1016/j.cellsig.2019.05.007. Epub 2019 May 10. Cell Signal. 2019. PMID: 31082464 French. - RES-529: a PI3K/AKT/mTOR pathway inhibitor that dissociates the mTORC1 and mTORC2 complexes.
Weinberg MA. Weinberg MA. Anticancer Drugs. 2016 Jul;27(6):475-87. doi: 10.1097/CAD.0000000000000354. Anticancer Drugs. 2016. PMID: 26918392 Free PMC article. Review. - Extracellular matrix regulation of metabolism and implications for tumorigenesis.
Grassian AR, Coloff JL, Brugge JS. Grassian AR, et al. Cold Spring Harb Symp Quant Biol. 2011;76:313-24. doi: 10.1101/sqb.2011.76.010967. Epub 2011 Nov 21. Cold Spring Harb Symp Quant Biol. 2011. PMID: 22105806 Review.
Cited by
- Metabolic reservoir cycles in cancer.
Zhang C, Quinones A, Le A. Zhang C, et al. Semin Cancer Biol. 2022 Nov;86(Pt 3):180-188. doi: 10.1016/j.semcancer.2022.03.023. Epub 2022 Apr 4. Semin Cancer Biol. 2022. PMID: 35390455 Free PMC article. Review. - Radiation-induced rescue effect.
Yu KN. Yu KN. J Radiat Res. 2019 Mar 1;60(2):163-170. doi: 10.1093/jrr/rry109. J Radiat Res. 2019. PMID: 30624744 Free PMC article. Review. - KRAS Addiction Promotes Cancer Cell Adaptation in Harsh Microenvironment Through Macropinocytosis.
Seguin L. Seguin L. Subcell Biochem. 2022;98:189-204. doi: 10.1007/978-3-030-94004-1_10. Subcell Biochem. 2022. PMID: 35378709 - Pathophysiological Integration of Metabolic Reprogramming in Breast Cancer.
Corchado-Cobos R, García-Sancha N, Mendiburu-Eliçabe M, Gómez-Vecino A, Jiménez-Navas A, Pérez-Baena MJ, Holgado-Madruga M, Mao JH, Cañueto J, Castillo-Lluva S, Pérez-Losada J. Corchado-Cobos R, et al. Cancers (Basel). 2022 Jan 10;14(2):322. doi: 10.3390/cancers14020322. Cancers (Basel). 2022. PMID: 35053485 Free PMC article. Review. - Engineering metabolism to modulate immunity.
Kapnick SM, Martin CA, Jewell CM. Kapnick SM, et al. Adv Drug Deliv Rev. 2024 Jan;204:115122. doi: 10.1016/j.addr.2023.115122. Epub 2023 Nov 5. Adv Drug Deliv Rev. 2024. PMID: 37935318 Free PMC article. Review.
References
- Engelman J. A., Luo J. & Cantley L. C. The evolution of phosphatidylinositol 3-kinases as regulators of growth and metabolism. Nat. Rev. Genet. 7, 606–619 (2006). - PubMed
- Chiarugi P. & Giannoni E. Anoikis: a necessary death program for anchorage-dependent cells. Biochem. Pharmacol. 76, 1352–1364 (2008). - PubMed
- Debnath J. & Brugge J. S. Modelling glandular epithelial cancers in three-dimensional cultures. Nat. Rev. Cancer 5, 675–688 (2005). - PubMed
Publication types
MeSH terms
Substances
LinkOut - more resources
Full Text Sources
Other Literature Sources
Miscellaneous


