Structural basis for nutrient acquisition by dominant members of the human gut microbiota - PubMed (original) (raw)
. 2017 Jan 19;541(7637):407-411.
doi: 10.1038/nature20828. Epub 2017 Jan 11.
Karunakar R Pothula # 2, Satya P Bhamidimarri 3, Dror S Chorev 4, Arnaud Baslé 1, Susan J Firbank 1, Hongjun Zheng 1, Carol V Robinson 4, Mathias Winterhalter 3, Ulrich Kleinekathöfer 2, David N Bolam 1, Bert van den Berg 1
Affiliations
- PMID: 28077872
- PMCID: PMC5497811
- DOI: 10.1038/nature20828
Structural basis for nutrient acquisition by dominant members of the human gut microbiota
Amy J Glenwright et al. Nature. 2017.
Abstract
The human large intestine is populated by a high density of microorganisms, collectively termed the colonic microbiota, which has an important role in human health and nutrition. The survival of microbiota members from the dominant Gram-negative phylum Bacteroidetes depends on their ability to degrade dietary glycans that cannot be metabolized by the host. The genes encoding proteins involved in the degradation of specific glycans are organized into co-regulated polysaccharide utilization loci, with the archetypal locus sus (for starch utilisation system) encoding seven proteins, SusA-SusG. Glycan degradation mainly occurs intracellularly and depends on the import of oligosaccharides by an outer membrane protein complex composed of an extracellular SusD-like lipoprotein and an integral membrane SusC-like TonB-dependent transporter. The presence of the partner SusD-like lipoprotein is the major feature that distinguishes SusC-like proteins from previously characterized TonB-dependent transporters. Many sequenced gut Bacteroides spp. encode over 100 SusCD pairs, of which the majority have unknown functions and substrate specificities. The mechanism by which extracellular substrate binding by SusD proteins is coupled to outer membrane passage through their cognate SusC transporter is unknown. Here we present X-ray crystal structures of two functionally distinct SusCD complexes purified from Bacteroides thetaiotaomicron and derive a general model for substrate translocation. The SusC transporters form homodimers, with each β-barrel protomer tightly capped by SusD. Ligands are bound at the SusC-SusD interface in a large solvent-excluded cavity. Molecular dynamics simulations and single-channel electrophysiology reveal a 'pedal bin' mechanism, in which SusD moves away from SusC in a hinge-like fashion in the absence of ligand to expose the substrate-binding site to the extracellular milieu. These data provide mechanistic insights into outer membrane nutrient import by members of the microbiota, an area of major importance for understanding human-microbiota symbiosis.
Conflict of interest statement
Author information The authors declare no financial interests.
Figures
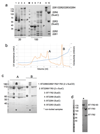
Extended Data Fig. 1. High abundance of SusCD complexes in B. theta OM.
a, SDS-PAGE gel of total outer membranes from E. coli (lanes 1,2,5,6) and B. theta (lanes 3,4,7,8). Each lane contains ~10 μg protein. Samples 5-8 were boiled (100). "P" denotes E. coli trimeric porins OmpF/C, which migrate at their monomeric molecular weights (~35 kDa) only after boiling. Note the relative lack of small-molecule OM diffusion channels (~30-50 kDa) in B. theta (lanes 7,8) and the low levels of large OM proteins including TBDTs (70-120 kDa) in E. coli (lanes 5,6). Purified BT2261-2264 complex is shown in lanes 9 (non-boiled) and 10 (boiled). b, Representative ion-exchange chromatogram from three separate experiments of B. theta total OM proteins separated on Resource-Q (6 ml, pH 7.5) after extraction in LDAO (Methods). Peaks A and B were further purified by gel filtration. c, SDS-PAGE gel of purified SusCD complexes from peaks A and B. Numbered gel bands were excised and subjected to identification by mass spectrometry. d, SDS-PAGE gel of purified BT1762-63 complex before (*) and after boiling. The SusCD complexes are highly stable and remain intact in 2% SDS.
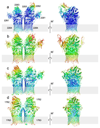
Extended Data Fig. 2. The oligomeric nature of SusCD complexes is not a consequence of crystal packing.
Cartoon side views of BT2261-2264 complexes rotated by 90° for space groups P1 (a), P212121 (b) and SeMet P21 (c). d, Cartoon side view of BT1762-1763 (P212121). The protein backbones are coloured on the same scale by their B-factors (blue; 20 Å2, red; 130 Å2). The grey bars indicate the hydrophobic phase of the OM. Structures were determined using data obtained from a single crystal in each case.
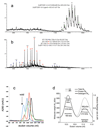
Extended Data Fig. 3. BT2261-2264 and BT1762-1763 form oligomeric complexes.
a, Mass spectrum of BT2261-2264 shows two prominent masses corresponding to an octamer and a ligand bound octamer in m/Z=12000-15000. b, Mass spectrum of BT1762-1763 indicates that these two proteins form dimers and tetramers. The numbers in parentheses on the right are the theoretical masses. c, Analytical gel filtration chromatography of BT2261-64 (blue) and BT1762-63 (green). For comparison, samples were run for soluble horse spleen ferritin (440 kDa; red) and for the membrane protein ammonium transporter Mep2 from Candida albicans (160 kDa; black). Buffer: 10 mM Hepes/100mM NaCl/0.12% DM pH 7.5. Column: Superdex-200 Increase 10/300 GL. d, Size-exclusion chromatography multi-angle light scattering (SEC-MALS) analysis of BT1762-63. Light scattering (LS) and differential refractive index (dRI) are plotted alongside the fitted total protein-detergent complex molecular weight (diamonds), and constituent protein (pluses) and detergent (crosses) molecular weights, across each peak. BT1762-63 eluted as two species of 499 kDa (protein component 319 kDa, corresponding to a SusCD dimer) and 269 kDa (protein component 214 kDa). Chromatograms shown are from single experiments.
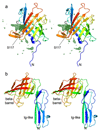
Extended Data Fig. 4. X-ray crystal structures of the small lipoproteins BT2261 and BT2262.
a, Stereo cartoon of BT2261 within the BT2261-2264 complex with rainbow colouring (blue; N-terminus). BT2261 is O-glycosylated on Ser117, consistent with the presence of the Bacteroidetes glycosylation motif D-S/T-A/L/V/I/M/T . Ser117 is shown as a stick model. Fo-Fc density within 20 Å of Ser117 is shown as a green mesh contoured at 3.0 σ. Three to four sugar moieties can be observed bound to Ser117. b, Stereo cartoon of soluble BT2262 with rainbow colouring. The protein consists of an N-terminal Ig-like domain and a C-terminal 8-stranded β-barrel. The functions of BT2261 and BT2262 are not clear, but both contain a small C-terminal 8-stranded β-barrel that displays structural similarity to lipid binding domains as judged by DALI . For BT2262, only one copy with a poorly ordered C-terminal domain is visible in the triclinic structure. Analogous to BT2263, the N-terminal segments of BT2261/62 that lead to the lipid anchors on the N-terminal cysteine residues are visible in the electron density; they are closely associated with SusC and do not appear to be flexible. Structures were determined using data obtained from a single crystal in each case.
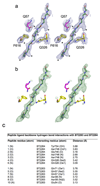
Extended Data Fig. 5. Unbiased electron density for the bound ligand in BT2261-64.
Stereo views of simulated annealing omit maps using a starting temperature of 1000 K. a, 2Fo-Fc maps contoured at 1.5 σ, carve=2. b, Fo-Fc map contoured at 3.0 σ, carve=2. Selected residues contacting ligand are shown (yellow; BT2264/SusC, magenta, BT2263/SusD). Density for at least six amino acid side chains is present (denoted with * in the 2Fo-Fc map). c, Interaction Table showing hydrogen bond distances between the putative peptide ligand backbone and residues in BT2263 and BT2264.
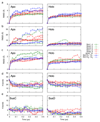
Extended Data Fig. 6. MD simulations for BT2261-64.
a, Plots of BT2264 (SusC) Cα RMSD vs. simulation time for holo and apo complexes. b and c, Plots of BT2263 (SusD) Cα RMSD vs. simulation time for holo and apo simulations, relative to the starting conformation (b) and after SusD superposition (c). d,e Plots showing the number of hydrogen bonds between SusC and SusD vs. simulation time (d) and between holo SusCD and the modeled peptide (e). Simulations are numbered as follows: sim1-3, apo BT2263-64 (dimer); sim7-9, apo BT2261-64 (tetramer); sim13, apo (BT2261-64)x2 (octamer); sim4-6, holo BT2263-64; sim10-12, holo BT2261-64; sim14, holo (BT2261-64)x2. With the exception of those of the octamer owing to its very large size, the simulations were repeated three times with different initial atomic velocities to allow sampling in order to obtain a measure of the possible spread in results.
Extended Data Fig. 7. Dynamics of the bound peptide during MD simulations.
Side views (left panels) and top views showing the bound peptide in the BT2263-64 dimers (a), BT2261-64 tetramers (b) and the (BT2261-64)x2 octamer. For clarity, only one final conformation for BT2264 (SusC) is shown together with the starting conformation of the peptide (green) and the final peptide conformations after 500 ns of simulation (red). For orientation purposes the assigned N-termini of the peptides are coloured blue.
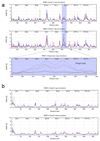
Extended Data Fig. 8. MD simulation root-mean-square-fluctuation (RMSF) analyses.
(a) Cα RMSF values for SusC in holo and apo complexes with the conformational fluctuations of the hinge loop L7 highlighted separately. (b) Cα RMSF values for SusD in apo and holo simulations. Simulations are numbered as in Extended Data Fig. 6: sim1-3, apo BT2263-64 (dimer); sim7-9, apo BT2261-64 (tetramer); sim13, apo (BT2261-64)x2 (octamer); sim4-6, holo BT2263-64; sim10-12, holo BT2261-64; sim14, holo (BT2261-64)x2.
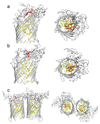
Extended Data Fig. 9. Structure of the BT2261-64 apo-octamer after 500 ns of MD simulation (sim13), demonstrating the independent bin opening of the two SusCD hubs.
a, Views from the plane of the membrane rotated by 90º. b, View from the extracellular side. For clarity, the SusC and SusD subunits are shown in different colours (yellow and orange for SusC/BT2264, magenta and red for SusD/BT2263). BT2261 and BT2262 are shown in green and blue, respectively. c, Side view of the opened SusCD monomer highlighting the remaining interactions between SusC (yellow) and SusD (magenta) mediated by the hinge loop L7 and loop L8.
Extended Data Fig. 10. ITC analysis of levan binding for recombinant BT1762 SusD-like wild-type and mutants.
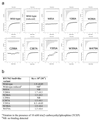
a, Titration curves from single experiments. Upper panels show raw injection heats of ligand (levan) into protein, lower panels show the integrated binding heats fit to a single set of sites binding model to determine Ka for all proteins except reduced wild-type (10 mM TCEP), W85A and C298A mutants that display no binding. Levan stock solution was between 0.5-2% (w/v) and protein ranged from 50-60 μM. b, Levan affinity of recombinant BT1762 SusD-like wild type and mutant proteins determined by ITC. Ka values shown are averages and standard deviations from at least two independent titrations. Residue numbering is that of the mature protein (first residue Cys1).
Figure 1. Overall architecture of SusCD complexes.
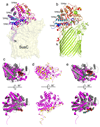
a, b, Cartoon views from the side for BT2261-64 (a) and BT1762-63 (b) rotated by 90º, with individual subunits labelled. OM, outer membrane. c, Surface representation of BT2261-64 from the outside of the cell. d, e, Architecture of BT2264 (SusC-like) viewed from the extracellular side (d) and from the plane of the membrane (e) with several extracellular loops indicated (L). The plug domain in the 22-stranded β-barrel is dark blue, and the N-terminal ten residues of BT2263 (SusD-like) including the lipid anchor are shown as stick models in magenta. Loop L7 is shown in orange. f, View of the BT1762-63 dimer from the periplasmic side. The L7 loops (orange) of BT1763 (SusC-like) and the functionally important residue Trp85 in BT1762 (SusD-like) are shown as space-filling models.
Figure 2. The SusCD interaction involves the ligand binding face of SusD.
a Cartoon overlay of BT2263 SusD in isolation (rainbow colouring; N-terminus blue) and within the BT2261-2264 complex (magenta). The four TPR domains are labelled and BT2264 SusC is shown as a transparent surface. b, Cartoon overlay for BT1762 in isolation (rainbow colouring) and within BT1762-1763 (red). BT1763 SusC is shown in green. c, Superposition of BT2263 with the archetypal SusD BT3701 in grey (PDB ID: 3CKB), viewed from the bottom (top panel) and from the side as in a. Bound maltotriose in BT3701 is shown as a space-filling model (carbons, black; oxygens, red). d, BT2263 with residues forming hydrogen bonds and salt bridges with BT2264 coloured yellow. e, Superposition as in c, with the putative peptide ligand of BT2261-2264 included to show binding site overlap.
Figure 3. The SusCD ligand binding site is conserved.
a, Side views of BT2261-64 showing the putative peptide ligand in green. b, Close-up of the binding site, showing SusC (yellow) and SusD (magenta) residues forming hydrogen bonds with the peptide backbone. Loop L7 is orange and the plug loop dark blue. 2Fo-Fc density for deca-glycine is shown as a blue mesh at 1.5σ. c, Western blot analysis of BT2261-64 expression via FLAG-tagged BT2263 in rich medium (TYG) and fructose minimal medium (MM-Frc) (representative of three experiments). Bottom panel shows corresponding cfu values. d, Mutational analysis of levan binding by BT1762 (red). Views are from the periplasmic side (left panel) and from the front. Residues that abolish levan binding are shown in yellow with those that do not affect levan binding in cyan. BT2263 (magenta) with bound deca-glycine (green) is superposed to show the conservation of the binding sites.
Figure 4. SusCD complexes transport their substrates via a pedal bin mechanism.
a and b, MD simulation snapshots of holo (a) and apo (b) BT2263-64 after 0 ns and 500 ns. SusC is coloured yellow with the plug domain in dark blue; SusD is shown in magenta. Cα atoms of Asn203 in SusC and Thr296 in SusD are shown as black spheres. c, Average distances vs. simulation time between SusC-Asn203 and SusD-Thr296 for SusCD dimers (green), BT2261-64 tetramers (red), and the (BT2261-64)x2 octamer (blue). d, Single channel electrophysiology traces and corresponding all-point histograms for BT1762-63 complexes (SusCD +/- plug) and for BT1763 (SusC +/- plug). Traces and histograms are representatives of 10 experiments. e, SDS-PAGE of BT1762-63 before (lane 1) and after (lane 2) incubation for 2 weeks at room temperature, and from crystal drops (lane 3). f, General mechanism for nutrient uptake via SusCD transport complexes, colour-coded as in panels a and b. Ligand is shown as a green wavy line and the C-terminal domain of TonB that interacts with the SusC plug is cyan.
Similar articles
- Structural and Biochemical Characterization of a Nonbinding SusD-Like Protein Involved in Xylooligosaccharide Utilization by an Uncultured Human Gut Bacteroides Strain.
Tauzin AS, Wang Z, Cioci G, Li X, Labourel A, Machado B, Lippens G, Potocki-Veronese G. Tauzin AS, et al. mSphere. 2022 Oct 26;7(5):e0024422. doi: 10.1128/msphere.00244-22. Epub 2022 Aug 31. mSphere. 2022. PMID: 36043703 Free PMC article. - TonB-dependent transport by the gut microbiota: novel aspects of an old problem.
Bolam DN, van den Berg B. Bolam DN, et al. Curr Opin Struct Biol. 2018 Aug;51:35-43. doi: 10.1016/j.sbi.2018.03.001. Epub 2018 Mar 15. Curr Opin Struct Biol. 2018. PMID: 29550504 Review. - Genetic Variation of the SusC/SusD Homologs from a Polysaccharide Utilization Locus Underlies Divergent Fructan Specificities and Functional Adaptation in Bacteroides thetaiotaomicron Strains.
Joglekar P, Sonnenburg ED, Higginbottom SK, Earle KA, Morland C, Shapiro-Ward S, Bolam DN, Sonnenburg JL. Joglekar P, et al. mSphere. 2018 May 23;3(3):e00185-18. doi: 10.1128/mSphereDirect.00185-18. eCollection 2018 May-Jun. mSphere. 2018. PMID: 29794055 Free PMC article. - Insights into SusCD-mediated glycan import by a prominent gut symbiont.
Gray DA, White JBR, Oluwole AO, Rath P, Glenwright AJ, Mazur A, Zahn M, Baslé A, Morland C, Evans SL, Cartmell A, Robinson CV, Hiller S, Ranson NA, Bolam DN, van den Berg B. Gray DA, et al. Nat Commun. 2021 Jan 4;12(1):44. doi: 10.1038/s41467-020-20285-y. Nat Commun. 2021. PMID: 33398001 Free PMC article. - TonB-dependent transporters in the Bacteroidetes: Unique domain structures and potential functions.
Pollet RM, Martin LM, Koropatkin NM. Pollet RM, et al. Mol Microbiol. 2021 Mar;115(3):490-501. doi: 10.1111/mmi.14683. Epub 2021 Feb 3. Mol Microbiol. 2021. PMID: 33448497 Review.
Cited by
- Structural and Biochemical Characterization of a Nonbinding SusD-Like Protein Involved in Xylooligosaccharide Utilization by an Uncultured Human Gut Bacteroides Strain.
Tauzin AS, Wang Z, Cioci G, Li X, Labourel A, Machado B, Lippens G, Potocki-Veronese G. Tauzin AS, et al. mSphere. 2022 Oct 26;7(5):e0024422. doi: 10.1128/msphere.00244-22. Epub 2022 Aug 31. mSphere. 2022. PMID: 36043703 Free PMC article. - Structure and evolution of the bifidobacterial carbohydrate metabolism proteins and enzymes.
Fushinobu S, Abou Hachem M. Fushinobu S, et al. Biochem Soc Trans. 2021 Apr 30;49(2):563-578. doi: 10.1042/BST20200163. Biochem Soc Trans. 2021. PMID: 33666221 Free PMC article. Review. - Effect of caffeic acid grafted chitosan loaded quercetin lyophilized powder formulation on avian colibacillosis and tissue distribution.
Ren X, Yuan S, Ren J, Ma L, Liu J, Wang G. Ren X, et al. Front Vet Sci. 2024 Oct 24;11:1470781. doi: 10.3389/fvets.2024.1470781. eCollection 2024. Front Vet Sci. 2024. PMID: 39512917 Free PMC article. - Biochemical characterization of a SusD-like protein involved in β-1,3-glucan utilization by an uncultured cow rumen Bacteroides.
Li X, Lippens G, Parrou J-L, Cioci G, Esque J, Wang Z, Laville E, Potocki-Veronese G, Labourel A. Li X, et al. mSphere. 2024 Aug 28;9(8):e0027824. doi: 10.1128/msphere.00278-24. Epub 2024 Jul 16. mSphere. 2024. PMID: 39012103 Free PMC article. - Lactobacillus johnsonii 6084 alleviated sepsis-induced organ injury by modulating gut microbiota.
Han S, Zheng H, Han F, Zhang X, Zhang G, Ma S, Liu K, Qin W, Wu G. Han S, et al. Food Sci Nutr. 2022 Jul 22;10(11):3931-3941. doi: 10.1002/fsn3.2989. eCollection 2022 Nov. Food Sci Nutr. 2022. PMID: 36348793 Free PMC article.
References
- Backhed F, Ley RE, Sonnenburg JL, Peterson DA, Gordon JI. Host-bacterial mutualism in the human intestine. Science. 2005;307:1915–1920. - PubMed
Publication types
MeSH terms
Substances
LinkOut - more resources
Full Text Sources
Other Literature Sources
Miscellaneous
