Translation from unconventional 5' start sites drives tumour initiation - PubMed (original) (raw)
. 2017 Jan 26;541(7638):494-499.
doi: 10.1038/nature21036. Epub 2017 Jan 11.
Joshua G Dunn 2, Edwin H Rodriguez 2, Shruti Naik 1, Nicholas C Gomez 1, Brian Hurwitz 1, John Levorse 1, Brian D Dill 3, Daniel Schramek 1, Henrik Molina 3, Jonathan S Weissman 2, Elaine Fuchs 1
Affiliations
- PMID: 28077873
- PMCID: PMC5287289
- DOI: 10.1038/nature21036
Translation from unconventional 5' start sites drives tumour initiation
Ataman Sendoel et al. Nature. 2017.
Abstract
We are just beginning to understand how translational control affects tumour initiation and malignancy. Here we use an epidermis-specific, in vivo ribosome profiling strategy to investigate the translational landscape during the transition from normal homeostasis to malignancy. Using a mouse model of inducible SOX2, which is broadly expressed in oncogenic RAS-associated cancers, we show that despite widespread reductions in translation and protein synthesis, certain oncogenic mRNAs are spared. During tumour initiation, the translational apparatus is redirected towards unconventional upstream initiation sites, enhancing the translational efficiency of oncogenic mRNAs. An in vivo RNA interference screen of translational regulators revealed that depletion of conventional eIF2 complexes has adverse effects on normal but not oncogenic growth. Conversely, the alternative initiation factor eIF2A is essential for cancer progression, during which it mediates initiation at these upstream sites, differentially skewing translation and protein expression. Our findings unveil a role for the translation of 5' untranslated regions in cancer, and expose new targets for therapeutic intervention.
Conflict of interest statement
The authors declare no competing financial interests. Readers are welcome to comment on the online version of the paper.
Figures
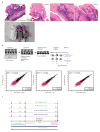
Extended Data Figure 1. Consequence of SOX2 expression in the epidermis and correlation between in vivo ribosome profiling experiments
a, Papilloma formation induced by SOX2 overexpression in the skin. SOX2 expression in tamoxifen-inducible K14-creER; R26-Sox2-IRES-eGFPfl/fl mice results in hyperplasia and papilloma formation. Representative H&E sections are shown. Animals develop severe skin lesions in the ventral epidermis 6–8 weeks after tamoxifen injection and require euthanasia. b, Experimental strategy to perform in vivo epidermis-specific ribosome profiling. In vivo epidermis-specific ribosome profiling strategy results in highly reproducible quantifications. Plots show RPKM correlations between the 3 independent replicate experiments in wild-type P4 epidermis. Quantified in this study were mRNAs with >128 reads. c, N-terminal extension of the translated Swi5 mRNA in wild-type and SOX2 P4 epidermis in vivo. Tracks show ribosome profiling reads along the Swi5 mRNA for replicate samples of each genotype. The final track shows harringtonine-treated ribosome profiling reads of wild-type keratinocytes in vitro. Harringtonine blocks ribosomes at the translational start site and allows translation start site mapping. Red arrow indicates direction of translation. Green bar marks the annotated CDS. Blue bar denotes the actual translated coding sequence based upon ribosomal profiling.
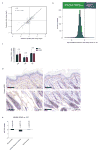
Extended Data Figure 2. Global translational efficiency is decreased upon SOX2 expression in keratinocytes in vitro
a, Ribosome profiling data correlates with proteomics data. At a stage when proliferation and morphology were similar, freshly isolated, basally enriched keratinocytes from wild-type and SOX2-expressing P4 skins were subjected to in vivo ribosome profiling and to a label-free proteomics strategy. Plotted are proteomics fold changes compared to ribosome profiling fold changes. Comparisons are made in SOX2 versus wild-type samples for significantly changed proteins (false discovery rate (FDR) <0.05). b, Translational efficiency is markedly reduced in SOX2-expressing premalignant keratinocytes in vitro. Keratinocytes were isolated from R26-Sox2-IRES-eGFPfl/+ (WT) or K14-cre; R26-Sox2-IRES-eGFPfl/+ (SOX2+) P0 animals and cultured in vitro. Quantified were genes with more than 256 reads in RNA-seq data. Histogram shows distribution of differential translational efficiency (TE =RPKMribosome profiling/RPKMRNA-seq). Data are shown from 4 independent ribosome profiling experiments and 2 independent RNA-seq experiments. c, Wild-type and SOX2 keratinocytes have similar proliferation rates in vivo. Basal epidermal EdU incorporation in P0, P2 and P4 mice (n = 442/496, 385/449 and 903/841 cells from duplicate wild-type/SOX2 animals) 1 h after injection. Data are mean ±s.d. d, Phospho-4E-BP1 immunohistochemistry in the epidermis shows no difference in levels upon SOX2 induction. e, NSUN2 transcript, translation, and protein levels in SOX2 versus WT P4 epidermis.
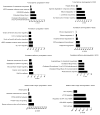
Extended Data Figure 3. Translationally controlled genes show a shift towards cancer-related pathways
Pathway analyses reveal a shift towards cancer-related pathways in mRNAs resistant to the SOX2-mediated global decrease in translational efficiency and in mRNAs with preferential uORF translation in premalignant SOX2+ P4 epidermis. Ingenuity pathway analysis (IPA) was used to analyse genes differentially regulated at four levels of control: transcriptional, translational, translational efficiency, and uORF/ORF ratio level. Included were the top 10% most upregulated and top 10% most downregulated genes at the levels of the transcriptome, translatome, and uORF usage. The translational efficiency list was restricted to the top and bottom-most 500 genes, corresponding to 6.6% of all genes. Total number of genes quantified: 4,725 transcriptome, 4,725 translatome, 7,605 translational efficiency, 1,830 uORFs.
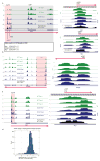
Extended Data Figure 4. Translation from 5′ UTRs
a, 5′ UTR translation of Myc in the P4 epidermis in vivo. As described previously, Myc mRNA contains several translated uORFs. Right panels show higher magnification of the uORF start codons. b, 5′ UTR translation of Eif4g2 (encoding eIF4γ2) in the P4 epidermis in vivo. Harringtonine track shows main translation initiation site in the 5′ UTR. Right panels show higher magnification of the uORF start codons. c, 5′ UTR translation of Btg1 in the P4 epidermis in vivo. Harringtonine track shows main translation initiation site in the 5′ UTR. Right panels show higher magnification of the uORF start codons. d, Relative uORF translation in SOX2 versus wild-type keratinocytes using Harringtonine-treated samples. For each gene, the ratio of ribosome footprints in 5′ UTR of Harringtonine samples versus CHX-treated ORFs (for normalization) was calculated. Histogram shows distribution of log2 fold changes in relative 5′ UTR translation.
Extended Data Figure 5. Proteomic detection of 13 peptides produced from 5′ UTRs
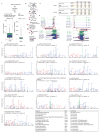
a, The RiboTaper analysis pipeline was used to annotate upstream ORFs computationally in an in vitro SOX2 keratinocyte sample. RiboTaper exploits the triplet periodicity of ribosomal footprints to predict bona fide translated regions. Boxplot shows the distribution of length of 215 uORFs which start with an AUG codon with a median length of 54 nucleotides. As a comparison, the right panel shows boxplot with the distribution of length of main ORFs predicted by RiboTaper. b, Schematic overview of the terminal amine isotopic labelling of substrates (TAILS) strategy to specifically enrich for N-terminal fragments. c, Overview of the pre- and post-TAILS peptide counts and peptide-spectrum matches. d, MS/MS spectra for identified uORF peptides. Representative MS/MS spectra for identified uORF peptides with monoisotopic (m/z), parent mass error (parts per million), charge state, and Mascot ion score. Matched _y_-ion fragments are shown in blue, _b_-ions in red, and unfragmented parents in green. Peptide N termini were identified as naturally N-terminally acetylated or unmodified. Owing to the protein-level primary amine blocking step in the TAILS workflow, naturally unmodified N termini and all lysines carry a dimethyl chemical modification. e, Ribosome profiling tracks showing translated uORF in P4 epidermis of the hepatoma-derived growth factor Hdgf and of the glycolipid transfer Gltp gene. Encoded peptides identified by high-resolution/high-mass-accuracy mass spectrometry using proteomics and peptidomics are shown. Red amino acids correspond to the identified peptides, yellow nucleotides mark potential initiation sites.
Extended Data Figure 6. SOX2-targeted 5′ UTRs are highly structured
a, Genes with increased SOX2-regulated 5′ UTR translation also have longer 5′ UTRs and are more structured. The 10% of genes with the most increased 5′ UTR translation in SOX2 cells were evaluated relative to the 10% of genes with the largest decrease in 5′ UTR translation (error bars indicate range, n = 183 each, two-sided Wilcoxon test). b, Cumulative distribution plot showing length to structure comparison, an assessment for each gene’s 5′ UTR structure relative to its length. Analysis showing that SOX2-upregulated 5′ UTRs tend to have more favourable free energy at each length, suggesting that SOX2-regulated 5′ UTR secondary structures are more stable even when normalized for length (error bars indicate range, n = 183 each, two-sided Wilcoxon test). c, mRNAs showing preferential uORF translation in premalignant SOX2-expressing epidermis significantly overlap with mRNAs that are most resistant to the reduction in translational efficiency in premalignant SOX2 versus wild-type epidermis (hypergeometric test, P < 0.001). All mRNAs with a relative increase in the uORF/ORF ratio in SOX2 versus wild type were compared to the top 10% of mRNAs most resistant to reduction in translational efficiency in P4 SOX2 versus wild-type epidermis. Pathway analysis for the overlapping 122 genes (ingenuity pathway analysis) revealed epithelial–mesenchymal transition (EMT), stem-cell pluripotency, and axonal guidance as the top most enriched pathways. d, HrasG12V; Tgfbr2 knockout SCC tumour growth is dependent on SOX2 signalling. As shown in Fig. 4h, the HrasG12V; Tgfbr2 knockout is sufficient to upregulate SOX2 levels. Graph showing SCC tumour growth post-injection of 105 cells. Data are mean ±s.e.m. (n = 8 for each genotype). e, Overlap between uORF translation that occurs preferentially in premalignant SOX2-expressing P4 epidermis in vivo and uORF translation of malignant SOX2-expressing, HRAS-regulated SCC in vitro. Included were all mRNAs with twofold difference SOX2 versus wild-type P4 epidermis in vivo and twofold difference HrasG12V; Tgfbr2 knockout SCC versus wild-type keratinocytes in vitro. Hypergeometric test, P <0.001.
Extended Data Figure 7. An shRNA screen reveals regulatory nodes in premalignancy
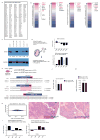
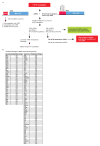
a, The 138 ribosomal genes and initiation factors targeted in our shRNA screen. b, Overview of the shRNA screen in wild-type versus premalignant SOX2-expressing epidermis from P0 mice. The RIGER algorithm was used with the following methods and metrics to convert hairpins to genes and to rank top hits. From left to the right: weighted sum, signal to noise (median); second best rank, signal to noise (median); weighted sum, signal to noise; weighted sum, fold change. c, Western blot shows knockdown efficiency of shRNAs targeting the top hit in our screen, Eif2s1. Note that the knockdown efficiency correlates well with the degree of shRNA depletion in the screen. d, Intra-amniotic injection of lentivirus library of Eif2a and 35 control shRNAs. This sub-library was injected into E9.5 embryos and representation of shRNAs was quantified in wild-type and SOX2 P0 skin. Top, knockdown efficiency; bottom, relative representation of Eif2a shRNAs (normalized against the control shRNA library) in wild-type versus SOX2 epidermis. e, DNA sequence of Eif2a knockout clonal cell lines used in our study. PAM region is highlighted in red, CRISPR target region in blue. f, g, Proliferation rates and overall protein synthesis rates are unchanged in Eif2a knockout cells under serum-rich conditions in vitro. SCC control and Eif2a knockout cells were quantified for EdU and OPP incorporation 1 h after administration. Data are mean ± s.d. of 4 independent experiments. h, The translational landscape is unchanged in Eif2a knockout cells under serum-rich conditions in vitro. SCC control and Eif2a knockout cells subjected to ribosome profiling and reads within the main ORFs were quantified and tested for differential expression using DESeq2. As opposed to 5′ UTR translation, no significant differences (adjusted P < 0.1 DESeq2) in ORF translation were found between SCC control and SCC Eif2a knockout cells (n = 2 SCC control, n =2 SCC Eif2a knockout). Right panels show two representative H&E sections of squamous cell carcinomas formed 25 days after subcutaneous injection of SCC cells. i, eIF2A-dependent changes of heavy-labelled peptides of CTNNB1 and CD44 under stress in pulsed SILAC. SCC control and SCC Eif2a knockout cells were grown in light-labelled medium and switched to heavy-labelled medium supplemented with 5 μM arsenite. Graphs show the relative difference between SCC control and SCC Eif2a knockout cells during the pulsed SILAC time course.
Extended Data Figure 8. mRNAs containing eIF2A-targeted uORFs are preferentially translated during tumorigenesis
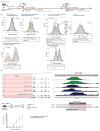
a–c, Genes that contain eIF2A-targeted uORFs maintain increased translation and translational efficiency of their downstream ORFs during early stages of tumorigenesis. HrasG12V; Tgfbr2 knockout SCCs were subcutaneously injected into nude mice. Day 5 or day 10 tumours were analysed by ribosome profiling and RNA-seq. Changes in transcription, translation and translational efficiency were assessed comparing in vivo against SCC in vitro data and represented as fold changes in Kernel density plots. Either only the significantly changed genes (DESeq2) or all genes were assessed. eIF2A-targeted versus non-eIF2A-targeted uORF genes refer to changes in uORF usage in SCC control versus SCC Eif2a knockout in Fig. 6a (n =2 SCC in vitro, n =2 SCC day 5, n = 2 SCC day 10, two-sample Kolmogorov–Smirnov test). d, Mutations in the eIF2A-regulated uORF of Ctnnb1, a key oncogene for SCC progression, diminishes its tumorigenic potential. Tracks show ribosome profiling reads in the 5′ UTR of Ctnnb1 and in the uORF GUG start codon. HrasG12V; Tgfbr2 knockout SCC keratinocytes were infected with either non-targeting control sgRNA or Ctnnb1 uORF sgRNAs. Clonal lines were sequenced and an uORF mutant clonal line was established. Data are mean ± s.e.m. following subcutaneous injection of 105 cells (n =8 control, n = 14 clone 2B).
Extended Data Figure 9. Human EIF2A is frequently amplified in human cancer
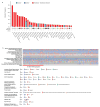
a, Summary of cross-cancer alterations for EIF2A in human cancers. 29% of patients with lung carcinoma and 15% of patients with head and neck SCCs show an amplification of the EIF2A locus. b, Summary of the clinical information accompanying TCGA patients with head and neck SCC.
Extended Data Figure 10. Overview of 5′ UTR translation and proteomics analyses
a, Summary of different analyses of 5′ UTR translation in this study. b, Significantly changed proteins in SOX2 versus wild-type P4 epidermis in vivo (FDR <0.05).
Figure 1. The translational landscape of the epidermis during premalignant transformation
a, Transgene and mating used to induce Sox2 in E15.5 embryonic skin epidermis. b, Representative P4 skin sections of littermates. Scale bars, 30 μm and 60 μm (haematoxylin and eosin (H&E) images). ITGB4 denotes epithelial marker β4-integrin. WT, wild type. c, Ribosome-protected fragment length (in nucleotides) in P4 epidermal samples from randomly selected 105 reads (n =3 per genotype). d, Transcriptional and translational changes comparing SOX2 with wild-type P4 epidermis. Colour-coded are genes with the adjusted P value < 0.05 (DESeq2; ref. ; n = 3 per group for ribosome profiling; n =2 for RNA-seq). e, Venn diagram depicts total number of SOX2-dependent transcriptional and translational changes. f, Ribosome density profile on Krt14 and Krt6a transcripts in the epidermis (n = 3 per genotype).
Figure 2. Overall protein synthesis and translational efficiency are decreased in premalignant and SCC states
a, b, _O_-propargyl-puromycin (OPP) incorporation was assessed 1 h after administration in vitro. Representative histograms are shown for unstained, cycloheximide/OPP-treated (CHX) or OPP-treated keratinocytes. Data are mean ±s.d. (WT n =11, SOX2 n =7, SCC n = 7 independent experiments). **P <0.01, ***P < 0.001, two-tailed Student’s _t_-test. MFI, mean fluorescence intensity. c, Differential translational efficiency (TE =RPKMribosome profiling/RPKMRNA-seq) SOX2 versus wild type. d, Pathway analysis of genes transcribed differentially or translated efficiently in SOX2 versus wild type.
Figure 3. Translation is shifted towards upstream open reading frames in premalignant and SCC states
a, Relative uORF translation in P4 epidermis. Histogram shows distribution of log2 fold changes in relative 5′ UTR translation (n = 3 per genotype). Red line, median. b, Metagene analysis of ribosome density for the 1,830 5′ UTRs quantified in a. Normalized ribosome densities denotes the ratio of ribosome profiling reads. c, Minimum free energy for the top 10% of wild-type and SOX2-regulated 5′UTRs (n = 183 per group, from 3 independent experiments, two-sided Wilcoxon test). d, Start codon usage of uORFs preferentially translated in SOX2+ epidermis. e, Pathway analysis for the top and bottom 10% of genes with differential uORF usage in SOX2+ versus wild type (n = 183 per group). ES cell, embryonic stem cell. f, Normalized ribosome densities in 5′ UTR and ORF of Npm1 in P4 epidermis (average of n =3 per genotype). g, Relative uORF translation in _HrasG12V; Tgfbr2-_null versus control keratinocytes in vitro. Red line, median.
Figure 4. An epidermal-specific in vivo RNAi screen identifies the eIF2 ternary complex as a regulatory node in premalignancy
a, Schematic of the screening strategy, in which the lentivirus library was injected into the amniotic sacs of E9.5 wild-type and SOX2+ embryos. The library consisted of 715 shRNAs targeting 138 eukaryotic initiation factors and ribosomal proteins and, 35 non-targeting control shRNAs. 49 wild-type and 27 SOX2+ embryos were transduced. Total coverage: wild type, 782×; SOX2+, 432×. b–d, shRNA abundance ratios were calculated as the number of reads at P0 divided by the number of reads in the initial library (mean of n = 3, 601 shRNAs quantified above threshold). Numbers in parentheses denote the shRNA ID targeting a particular gene. e, Analysis of relative shRNA representation reveals Eif2s1, Eif2s2 and Eif5 shRNAs among the top hits with higher representation in SOX2+ versus wild-type epidermis using the RIGER algorithm. f, Heatmap showing examples of shRNAs with higher and lower relative representation in SOX2+ versus wild-type epidermis. g, Schematic of the eIF2 pathway that initiates canonical translation. h, Representative western blot from 3 independent experiments of keratinocytes in vitro. i, In vivo CRISPR/Cas9 strategy to knockout Eif2a in wild-type and SOX2+ epidermis by in utero injection of lentiviruses containing cre and single-guide RNAs (sgRNAs). Relative Eif2a sgRNA representation was analysed by quantitative PCR (n =4 per genotype). Data are mean ±s.d.
Figure 5. eIF2A controls tumour formation
a, _HrasG12V;Tgfbr2_-null SCC keratinocytes were infected with lentiviruses containing Cas9 and sgRNAs to establish _Eif2a-_knockout (KO) and non-targeting control lines. Western blot confirms Eif2a ablation by two different sgRNAs (sg1 and sg3). 4M denotes control clone; 5A, 5B and 6D denote Eif2a knockout clones. b, Eif2a ablation abrogates tumour growth. Plotted is mean tumour volume ± s.e.m. after subcutaneous injection of 105 cells (n =16 control, n = 14 knockout clone 5A, n = 12 clones 5B and 6D). Representative tumours 25 days after injection are shown. Asterisk denotes terminated owing to tumour size. Scale bar, 1 cm. c, Limiting dilution assay. Graphs show percentage of tumour-free mice 4 weeks after injection and estimated tumour-initiating cells (TIC) (n = 24 grafts per dilution and genotype). d, Re-introducing eIF2A by pCMV-Eif2a transformation rescues _Eif2a_-knockout defective tumour initiation. Western blot confirms eIF2A restoration. Data are mean ±s.e.m. (n =16 control, n = 14 clone 5A, n =12 clone 5B, n = 16 clone 5A; pCMV::Eif2a, n = 16 clone 5B; pCMV::Eif2a). Scale bar, 1 cm.
Figure 6. eIF2A promotes translation of select cancer genes and leads to poor prognosis in human SCC
a, eIF2A controls genome-wide uORF translation. Histogram shows distribution of log2 fold changes in relative 5′ UTR translation of uORF genes in _Eif2a-_knockout compared with control SCCs. Red line, median. b, A pulsed SILAC strategy reveals eIF2A-dependent protein synthesis under 5 μM arsenite stress. A cluster of 368 of the quantified 2,045 proteins were selectively reduced in synthesis in _Eif2a-_knockout SCCs. c, eIF2A-targeted uORF genes show increased protein synthesis in 72 h pulsed SILAC in control versus _Eif2a_-knockout SCCs. Kernel density plot shows eIF2A-dependent change in heavy-labelled protein synthesis of eIF2A-targeted uORF and non-uORF genes under stress. P value, two-sample Kolmogorov–Smirnov test. d, eIF2A-targeted uORF cancer genes are preferentially translated in early tumorigenesis. SCCs were subjected to ribosome profiling and RNA-seq directly or after 5 days transplantation in vivo (n = 2). Kernel density plots show changes in translation and translational efficiency (TE) of tumours in vivo versus SCCs in vitro at day 5. eIF2A-targeted (n = 716) versus non-eIF2A-targeted uORF (n = 746) genes refer to changes in uORF usage in control versus _Eif2a-_null SCCs (a). P values, two-sample Kolmogorov–Smirnov test. s.c., subcutaneous. e, Model of the switch towards eIF2A-dependent translation during tumorigenesis. tRNA-i, initiator-tRNA. f, Kaplan–Meier analysis comparing overall (left) and disease-free (right) survival of TCGA patients with head and neck SCC, which were stratified according to EIF2A mRNA expression _z_-score >1.75 (27% of patients) versus the rest. Median survival and disease-free survival values are given.
Comment in
- Cell biology: Unconventional translation in cancer.
Pedersen MT, Jensen KB. Pedersen MT, et al. Nature. 2017 Jan 11;541(7638):471-472. doi: 10.1038/nature21115. Nature. 2017. PMID: 28117446 No abstract available.
Similar articles
- Translational control by 5'-untranslated regions of eukaryotic mRNAs.
Hinnebusch AG, Ivanov IP, Sonenberg N. Hinnebusch AG, et al. Science. 2016 Jun 17;352(6292):1413-6. doi: 10.1126/science.aad9868. Science. 2016. PMID: 27313038 Free PMC article. Review. - Epidermal expression of the translation inhibitor programmed cell death 4 suppresses tumorigenesis.
Jansen AP, Camalier CE, Colburn NH. Jansen AP, et al. Cancer Res. 2005 Jul 15;65(14):6034-41. doi: 10.1158/0008-5472.CAN-04-2119. Cancer Res. 2005. PMID: 16024603 - Translation from the 5' untranslated region shapes the integrated stress response.
Starck SR, Tsai JC, Chen K, Shodiya M, Wang L, Yahiro K, Martins-Green M, Shastri N, Walter P. Starck SR, et al. Science. 2016 Jan 29;351(6272):aad3867. doi: 10.1126/science.aad3867. Science. 2016. PMID: 26823435 Free PMC article. - Efficient translation initiation directed by the 900-nucleotide-long and GC-rich 5' untranslated region of the human retrotransposon LINE-1 mRNA is strictly cap dependent rather than internal ribosome entry site mediated.
Dmitriev SE, Andreev DE, Terenin IM, Olovnikov IA, Prassolov VS, Merrick WC, Shatsky IN. Dmitriev SE, et al. Mol Cell Biol. 2007 Jul;27(13):4685-97. doi: 10.1128/MCB.02138-06. Epub 2007 Apr 30. Mol Cell Biol. 2007. PMID: 17470553 Free PMC article. - Upstream Open Reading Frames Differentially Regulate Gene-specific Translation in the Integrated Stress Response.
Young SK, Wek RC. Young SK, et al. J Biol Chem. 2016 Aug 12;291(33):16927-35. doi: 10.1074/jbc.R116.733899. Epub 2016 Jun 29. J Biol Chem. 2016. PMID: 27358398 Free PMC article. Review.
Cited by
- The PPP1R15 Family of eIF2-alpha Phosphatase Targeting Subunits (GADD34 and CReP).
Hicks D, Giresh K, Wrischnik LA, Weiser DC. Hicks D, et al. Int J Mol Sci. 2023 Dec 10;24(24):17321. doi: 10.3390/ijms242417321. Int J Mol Sci. 2023. PMID: 38139150 Free PMC article. Review. - No country for old methods: New tools for studying microproteins.
Valdivia-Francia F, Sendoel A. Valdivia-Francia F, et al. iScience. 2024 Jan 20;27(2):108972. doi: 10.1016/j.isci.2024.108972. eCollection 2024 Feb 16. iScience. 2024. PMID: 38333695 Free PMC article. Review. - Translation of small downstream ORFs enhances translation of canonical main open reading frames.
Wu Q, Wright M, Gogol MM, Bradford WD, Zhang N, Bazzini AA. Wu Q, et al. EMBO J. 2020 Sep 1;39(17):e104763. doi: 10.15252/embj.2020104763. Epub 2020 Aug 3. EMBO J. 2020. PMID: 32744758 Free PMC article. - Non-canonical initiation factors modulate repeat-associated non-AUG translation.
Green KM, Miller SL, Malik I, Todd PK. Green KM, et al. Hum Mol Genet. 2022 Aug 17;31(15):2521-2534. doi: 10.1093/hmg/ddac021. Hum Mol Genet. 2022. PMID: 35220421 Free PMC article. - Exploring the Peptide Potential of Genomes.
Papadopoulos C, Chevrollier N, Lopes A. Papadopoulos C, et al. Methods Mol Biol. 2022;2405:63-82. doi: 10.1007/978-1-0716-1855-4_3. Methods Mol Biol. 2022. PMID: 35298808
References
- Schwanhäusser B, et al. Global quantification of mammalian gene expression control. Nature. 2011;473:337–342. - PubMed
- Mamane Y, Petroulakis E, LeBacquer O, Sonenberg N. mTOR, translation initiation and cancer. Oncogene. 2006;25:6416–6422. - PubMed
Publication types
MeSH terms
Substances
Grants and funding
- R37 AR027883/AR/NIAMS NIH HHS/United States
- T32 GM007618/GM/NIGMS NIH HHS/United States
- T32 GM007739/GM/NIGMS NIH HHS/United States
- HHMI/Howard Hughes Medical Institute/United States
LinkOut - more resources
Full Text Sources
Other Literature Sources
Medical
Molecular Biology Databases
Research Materials
