An early and late peak in microglial activation in Alzheimer's disease trajectory - PubMed (original) (raw)
An early and late peak in microglial activation in Alzheimer's disease trajectory
Zhen Fan et al. Brain. 2017.
Abstract
Amyloid-β deposition, neuroinflammation and tau tangle formation all play a significant role in Alzheimer's disease. We hypothesized that there is microglial activation early on in Alzheimer's disease trajectory, where in the initial phase, microglia may be trying to repair the damage, while later on in the disease these microglia could be ineffective and produce proinflammatory cytokines leading to progressive neuronal damage. In this longitudinal study, we have evaluated the temporal profile of microglial activation and its relationship between fibrillar amyloid load at baseline and follow-up in subjects with mild cognitive impairment, and this was compared with subjects with Alzheimer's disease. Thirty subjects (eight mild cognitive impairment, eight Alzheimer's disease and 14 controls) aged between 54 and 77 years underwent 11C-(R)PK11195, 11C-PIB positron emission tomography and magnetic resonance imaging scans. Patients were followed-up after 14 ± 4 months. Region of interest and Statistical Parametric Mapping analysis were used to determine longitudinal alterations. Single subject analysis was performed to evaluate the individualized pathological changes over time. Correlations between levels of microglial activation and amyloid deposition at a voxel level were assessed using Biological Parametric Mapping. We demonstrated that both baseline and follow-up microglial activation in the mild cognitive impairment cohort compared to controls were increased by 41% and 21%, respectively. There was a longitudinal reduction of 18% in microglial activation in mild cognitive impairment cohort over 14 months, which was associated with a mild elevation in fibrillar amyloid load. Cortical clusters of microglial activation and amyloid deposition spatially overlapped in the subjects with mild cognitive impairment. Baseline microglial activation was increased by 36% in Alzheimer's disease subjects compared with controls. Longitudinally, Alzheimer's disease subjects showed an increase in microglial activation. In conclusion, this is one of the first longitudinal positron emission tomography studies evaluating longitudinal changes in microglial activation in mild cognitive impairment and Alzheimer's disease subjects. We found there is an initial longitudinal reduction in microglial activation in subjects with mild cognitive impairment, while subjects with Alzheimer's disease showed an increase in microglial activation. This could reflect that activated microglia in mild cognitive impairment initially may adopt a protective activation phenotype, which later change to a cidal pro-inflammatory phenotype as disease progresses and amyloid clearance fails. Thus, we speculate that there might be two peaks of microglial activation in the Alzheimer's disease trajectory; an early protective peak and a later pro-inflammatory peak. If so, anti-microglial agents targeting the pro-inflammatory phenotype would be most beneficial in the later stages of the disease.
Keywords: Alzheimer’s disease; amyloid imaging; microglial activation; mild cognitive impairment; neuropathology.
© The Author (2017). Published by Oxford University Press on behalf of the Guarantors of Brain. All rights reserved. For Permissions, please email: journals.permissions@oup.com.
Figures
Figure 1
SPM analysis between baseline and follow-up microglial activation in MCI subjects. (A) Paired _t_-test SPM analysis between baseline and follow-up microglial activation in all subjects with MCI. (B) Paired _t_-test SPM analysis between baseline and follow-up microglial activation in amyloid positive subjects. (C) Paired _t_-test SPM analysis between baseline and follow up microglial activation in amyloid negative subjects. Supplementary Table 2 details the coordinates with their statistical results.
Figure 2
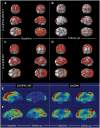
Longitudinal changes in 11C-(R)PK11195 BP and 11C-PIB in subjects with MCI compared to controls at baseline and follow-up. (A and B) Clusters of significantly increased 11C-(R)PK11195 BP in subjects with MCI compared to healthy controls at baseline and follow-up, respectively, with the same voxel threshold of P < 0.01 and extent threshold of 50 voxels. (C and D) Clusters of significantly increased 11C-PIB in subjects with MCI compared to healthy controls at baseline and follow-up (P < 0.0001 and extent of 200 voxels). Supplementary Table 3 details the coordinates with their statistical results. (E and F) 3D intensity T-map of 11C-(R)PK11195 BP and 11C-PIB RATIO for two individual subjects with MCI at baseline and follow-up. The surface plot represents significant increase in the microglial activation (left) and amyloid deposition (right) against the control group at baseline superimposed on a 3D matrix at baseline and follow-up.
Figure 3
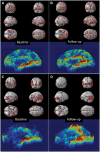
Voxel-based correlation between 11C-(R)PK11195 BP and 11C-PIB uptake. BPM-positive correlation between microglial activation and amyloid deposition superimposed on a SPM render brain image, along with 3D intensity T-map of BPM correlation in sagittal view in MCI and Alzheimer’s disease cohort. (A and B) Positive correlations between 11C-PIB RATIO and 11C-(R)PK11195 BP in subjects with MCI at baseline and follow-up, respectively, at a cluster threshold of P < 0.05 with an extent threshold of 50-voxel. (C and D) Positive correlations between 11C-PIB RATIO and 11C-(R)PK11195 BP in subjects with Alzheimer’s disease at baseline and follow-up, respectively, at a cluster threshold of P < 0.05 with an extent threshold of 50-voxel. Supplementary Table 4 details the significant clusters.
Figure 4
Hypothetical model of dual peak of microglial activation in the Alzheimer’s trajectory.Top: The hypothetical model of morphological changes in microglia in Alzheimer’s disease trajectory, where ramified microglia transform to anti-inflammatory (protective) microglial phenotype and pro-inflammatory (toxic) microglial phenotypes. Bottom: The microglial activation in relation to other biomarkers detectable using positron emission tomography where two peaks of microglial activation are present in Alzheimer’s trajectory. Modified from Jack et al. (2010).
Similar articles
- Longitudinal influence of microglial activation and amyloid on neuronal function in Alzheimer's disease.
Fan Z, Okello AA, Brooks DJ, Edison P. Fan Z, et al. Brain. 2015 Dec;138(Pt 12):3685-98. doi: 10.1093/brain/awv288. Epub 2015 Oct 27. Brain. 2015. PMID: 26510952 - Carbon 11-labeled Pittsburgh Compound B and carbon 11-labeled (R)-PK11195 positron emission tomographic imaging in Alzheimer disease.
Wiley CA, Lopresti BJ, Venneti S, Price J, Klunk WE, DeKosky ST, Mathis CA. Wiley CA, et al. Arch Neurol. 2009 Jan;66(1):60-7. doi: 10.1001/archneurol.2008.511. Arch Neurol. 2009. PMID: 19139300 Free PMC article. - Microglial activation correlates in vivo with both tau and amyloid in Alzheimer's disease.
Dani M, Wood M, Mizoguchi R, Fan Z, Walker Z, Morgan R, Hinz R, Biju M, Kuruvilla T, Brooks DJ, Edison P. Dani M, et al. Brain. 2018 Sep 1;141(9):2740-2754. doi: 10.1093/brain/awy188. Brain. 2018. PMID: 30052812 - In vivo human amyloid imaging.
Sojkova J, Resnick SM. Sojkova J, et al. Curr Alzheimer Res. 2011 Jun;8(4):366-72. doi: 10.2174/156720511795745375. Curr Alzheimer Res. 2011. PMID: 21222593 Free PMC article. Review. - Microglial modulation as a therapeutic strategy in Alzheimer's disease: Focus on microglial preconditioning approaches.
Yassaghi Y, Nazerian Y, Ghasemi M, Nazerian A, Sayehmiri F, Perry G, Gholami Pourbadie H. Yassaghi Y, et al. J Cell Mol Med. 2024 Aug;28(15):e18554. doi: 10.1111/jcmm.18554. J Cell Mol Med. 2024. PMID: 39103747 Free PMC article. Review.
Cited by
- Brain Glucose Metabolism in Health, Obesity, and Cognitive Decline-Does Insulin Have Anything to Do with It? A Narrative Review.
Rebelos E, Rinne JO, Nuutila P, Ekblad LL. Rebelos E, et al. J Clin Med. 2021 Apr 6;10(7):1532. doi: 10.3390/jcm10071532. J Clin Med. 2021. PMID: 33917464 Free PMC article. Review. - Research Progress on the Pathogenesis, Diagnosis, and Drug Therapy of Alzheimer's Disease.
Yang Y, Qiu L. Yang Y, et al. Brain Sci. 2024 Jun 9;14(6):590. doi: 10.3390/brainsci14060590. Brain Sci. 2024. PMID: 38928590 Free PMC article. Review. - Pathogenesis, therapeutic strategies and biomarker development based on "omics" analysis related to microglia in Alzheimer's disease.
Gao C, Shen X, Tan Y, Chen S. Gao C, et al. J Neuroinflammation. 2022 Sep 4;19(1):215. doi: 10.1186/s12974-022-02580-1. J Neuroinflammation. 2022. PMID: 36058959 Free PMC article. Review. - Neurite orientation dispersion and density imaging reveals white matter and hippocampal microstructure changes produced by Interleukin-6 in the TgCRND8 mouse model of amyloidosis.
Colon-Perez LM, Ibanez KR, Suarez M, Torroella K, Acuna K, Ofori E, Levites Y, Vaillancourt DE, Golde TE, Chakrabarty P, Febo M. Colon-Perez LM, et al. Neuroimage. 2019 Nov 15;202:116138. doi: 10.1016/j.neuroimage.2019.116138. Epub 2019 Aug 28. Neuroimage. 2019. PMID: 31472250 Free PMC article. - Activated microglia and neuroinflammation as a pathogenic mechanism in Leigh syndrome.
Daneshgar N, Leidinger MR, Le S, Hefti M, Prigione A, Dai DF. Daneshgar N, et al. Front Neurosci. 2023 Jan 18;16:1068498. doi: 10.3389/fnins.2022.1068498. eCollection 2022. Front Neurosci. 2023. PMID: 36741056 Free PMC article.
References
- Anderson AN, Pavese N, Edison P, Tai YF, Hammers A, Gerhard A. et al. A systematic comparison of kinetic modelling methods generating parametric maps for [(11)C]-(R)-PK11195. Neuroimage 2007; 36: 28–37. - PubMed
- Cai Z, Hussain MD, Yan LJ. Microglia, neuroinflammation, and beta-amyloid protein in Alzheimer’s disease. Int J Neurosci 2013; 124: 307–21. - PubMed
Publication types
MeSH terms
Substances
LinkOut - more resources
Full Text Sources
Other Literature Sources
Medical


