Enteroviruses infect human enteroids and induce antiviral signaling in a cell lineage-specific manner - PubMed (original) (raw)
Enteroviruses infect human enteroids and induce antiviral signaling in a cell lineage-specific manner
Coyne G Drummond et al. Proc Natl Acad Sci U S A. 2017.
Abstract
Enteroviruses are among the most common viral infectious agents of humans and are primarily transmitted by the fecal-oral route. However, the events associated with enterovirus infections of the human gastrointestinal tract remain largely unknown. Here, we used stem cell-derived enteroids from human small intestines to study enterovirus infections of the intestinal epithelium. We found that enteroids were susceptible to infection by diverse enteroviruses, including echovirus 11 (E11), coxsackievirus B (CVB), and enterovirus 71 (EV71), and that contrary to an immortalized intestinal cell line, enteroids induced antiviral and inflammatory signaling pathways in response to infection in a virus-specific manner. Furthermore, using the Notch inhibitor dibenzazepine (DBZ) to drive cellular differentiation into secretory cell lineages, we show that although goblet cells resist E11 infection, enteroendocrine cells are permissive, suggesting that enteroviruses infect specific cell populations in the human intestine. Taken together, our studies provide insights into enterovirus infections of the human intestine, which could lead to the identification of novel therapeutic targets and/or strategies to prevent or treat infections by these highly clinically relevant viruses.
Keywords: enteroendocrine cells; enteroid; enterovirus; goblet cells; innate immune.
Conflict of interest statement
The authors declare no conflict of interest.
Figures
Fig. 1.
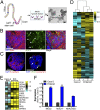
(A) Illustration depicting the strategy for enteroid culturing. Crypts are isolated from whole intestine epithelia and grown in media containing Wnt3a, Noggin, EGF, and R-spondin for 5 days to induce proliferation and differentiation. (Right) Brightfield image of enteroids after 5 days in culture. (Scale bar, 50 μm.) (B and C) Human epithelial-derived enteroids were immunostained for the goblet cell marker MUC2 (green) and actin (red) (B) or the enterocyte markers E-cadherin (red, Left) or the enteroendocrine marker CHGA (green, Right) and the Paneth cell marker Lysozyme C (red, Right) (C). (Scale bars, 50 μm.) (D) Hierarchical clustering heat map of differential gene expression profiles [based on log (RPKM) values] between two independent preparations of Caco-2 cells and three independent human enteroid cultures by RNA-seq. (E) Heat map [based on log (RPKM) values] comparing gene expression levels between Caco-2 and enteroid cultures for markers of differentiatied small intestinal epithelial cell types: enterocytes (CDX1, SI), goblet cells (MUC2), Paneth cells, (Reg3a, DefA5, DefA6), and M -cells (SPIB, GP2). (F) RT-qPCR comparison of expression levels for intestinal genes in Caco-2 cells and human enteroid cultures. Data in F are shown as mean ± SD and are normalized to Caco-2 cells. **P < 0.01; ***P < 0.001.
Fig. 2.
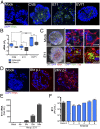
(A) Enteroids infected with CVB, E11, or EV71 for 24 hours, or mock-infected controls, were immunostained for vRNA (in green) using an antibody against dsRNA. DAPI-stained nuclei are shown in blue. (Scale bar, 50 μm.) (B) RT-qPCR for CVB, E11, or EV71 vRNA from Caco-2 cells (gray) or three independent enteroid preparations (blue). Data are shown as ΔC_t_ relative to actin. (C, Left) Images depicting the cytopathic effect in an E11-infected enteroid compared with a mock-infected control. Images are merged composites of differential interference contrast (DIC), DAPI-stained nuclei (in blue), and vRNA (in red). (C, Middle) Confocal micrographs of mock- or E11-infected enteroids immunostained for vRNA (green) and occludin (red) 24 hours following infection. Zoomed image of the white box shown in Middle at Right. (Scale bars, Left and Middle, 50 μm; Right, 15 μm.) (D) Immunofluorescent staining for viral dsRNA (red, vRNA) and DAPI-stained nuclei over a time course of E11 infection in enteroids ranging from early (8 hours) to advanced (24 hours) stages of infection. (Scale bar, 50 μm.) (E) E11 RNA levels as determined by RT-qPCR throughout a time course of infection (at the indicated hours p.i.) in an enteroid culture. (F) E11 titers (shown as plaque-forming units per milliliter) in supernatants of Caco-2 or enteroid cultures 24 hours p.i. Data in B, E, and F are shown as mean ± SD and are normalized to vRNA levels at 4 hours p.i. (E) *P < 0.05; **P < 0.01; ***P < 0.001.
Fig. S1.
(A) Immunofluorescence microscopy for vRNA (green) and CK19 (red) in enteroids infected with CVB for 24 hours. (Scale bar, 50 μm.) (B) ELISA for HMGB1, a marker for cell death, released by enteroid cultures infected for 24 hours with CVB, EV71, or E11 relative to mock-infected enteroids. **P < 0.01.
Fig. 3.
(A) Table of FPKM values for CVB, E11, or EV71 in three (CVB, EV71) or five (E11) independent enteroid preparations as determined by RNA-seq. In A and C, six independent enteroid preparations are assigned numerical identifiers (1–6) to facilitate direct comparison of transcript changes between matched preparations. (B) Venn diagram of transcripts induced by E11 or CVB infection, with only one transcript shared between viruses. (C) Heat map [based on log(RPKM) values] of highly up-regulated antiviral and proinflammatory transcripts in E11-, CVB-, or EV71-infected enteroids compared with mock-infected enteroids. (D) RT-qPCR for the indicated genes in three additional enteroid preparations (labeled 1–3) infected with E11. (E) HERC5 and CXCL11 mRNA levels as determined by RT-qPCR in Caco-2 cells and two independent enteroid preparations infected with CVB or E11 (left y axis). VRNA levels are also shown for each sample, relative to CVB levels in matched infections (right y axis). (F) ELISA for CXCL10 (shown as picograms per milliliter) from four independent enteroid preparations infected with CVB, E11, or EV71 for 24 hours compared with mock-infected controls. Data in D–F are shown as mean ± SD and are normalized to mock-infected controls (D and E left y axis). **P < 0.01; ***P < 0.001. In C, gray denotes transcripts with zero mapped reads.
Fig. S2.
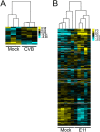
(A) Heat map [based on log(RPKM) values in Fig. 3_A_] of differentially expressed genes in enteroid samples infected with CVB compared with matched mock-infected controls. (B) Heat map of differentially expressed genes in E11-infected enteroids compared with mock controls.
Fig. S3.
(A) Gene set enrichment plots based upon GSEA of transcripts altered by E11 infection of enteroids. (B) mRNA levels for various interferons and ISGs in two E11-infected enteroid cultures, relative to mock infections. (C) CXCL10 mRNA levels, as determined by RT-qPCR, in enteroids following infection by CVB or E11 or in response to treatment with 20 μg poly(I:C), normalized to mock-infected controls.
Fig. 4.
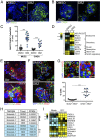
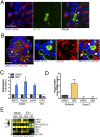
(A and B) Confocal micrographs of enteroids immunostained for MUC2 (green, A) or CHGA (B) to label cells of secretory lineage (goblet, enteroendocrine) following treatment with DBZ for 4 days or treatment with DMSO vehicle control. DAPI-stained nuclei are in blue. (Scale bars, 50 μm.) (C) Quantification of the number of MUC2- or CHGA-positive cells per enteroid (shown as a percent of total cells as determined by DAPI staining). (D) Heat map [based on log(RPKM) values] depicting expression levels for various epithelial subtype markers (as indicated) in DMSO- and DBZ-treated enteroid samples as determined by RNA-seq. (E) Confocal micrograph of enteroids infected with E11 for 24 hours and then immunostained for CHGA (green) and vRNA (red). (Bottom) Zoomed image of white boxed area shown in Top. White arrows denote CHGA- and vRNA-positive cells. (Scale bars, 20 μm.) (F) Confocal micrograph of DMSO- or DBZ-treated enteroids immunostained for MUC2 (red) and E11 vRNA (green) 24 hours p.i. DAPI-stained nuclei are shown in blue. (Scale bars, 50 μm.) (G, Top) Zoomed images of white boxed areas shown in F highlighting the lack of E11 infection in MUC2-positive cells. (Bottom) Quantification of the numbers of MUC2- or CHGA-positive cells that exhibited the presence of E11 vRNA. (H) Table of FPKM values from two independent enteroid preparations treated with DMSO or DBZ and infected with E11 for 24 hours as indicated. (I) Heat maps [based on log(RPKM) values] of differentially expressed genes induced by E11 infection in DMSO- or DBZ-treated enteroids. Data in C and G, Bottom are shown as mean ± SD, with each point representing an independent enteroid. ***P < 0.001.
Fig. S4.
(A) Immunofluorescence microscopy for E11 vRNA (red) and MUC2 (green) in enteroids infected with E11 for 24 hours. White arrows denote lack of infection in MUC2-positive cells. (Scale bar, 10 μm.) (B) Immunofluorescent confocal image of an enteroid stained for MUC2 (green) and actin (red). (Scale bar, 50 μm.) (C) Expression of markers of enterocytes (CDX1), goblet (MUC2), and Paneth cells (Reg3a and DefA6) in enteroids treated with DBZ or DMSO control, as determined by RT-qPCR. (D) Expression of Reg3A as assessed by RT-qPCR in enteroids or Caco-2 cells treated with DMSO control or DBZ. (E) Heat map [based on log(RPKM) values] of transcripts uniquely induced by E11 infection in DBZ-treated enteroids. Data in C and D are shown as mean ± SD and are normalized to DMSO-treated controls.
Fig. S5.
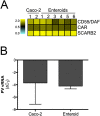
(A) Heat map [based upon log(RPKM) values] of known enterovirus receptors in Caco-2 cells or enteroids as determined by RNA-seq. (B) RT-qPCR for PV vRNA from Caco-2 cells or enteroids infected for 24 hours. Data are shown as mean ± SD Δ_C_ Q relative to actin.
Similar articles
- The TLR3/IRF1/Type III IFN Axis Facilitates Antiviral Responses against Enterovirus Infections in the Intestine.
Su R, Shereen MA, Zeng X, Liang Y, Li W, Ruan Z, Li Y, Liu W, Liu Y, Wu K, Luo Z, Wu J. Su R, et al. mBio. 2020 Nov 17;11(6):e02540-20. doi: 10.1128/mBio.02540-20. mBio. 2020. PMID: 33203755 Free PMC article. - Enteroviruses: A Gut-Wrenching Game of Entry, Detection, and Evasion.
Wells AI, Coyne CB. Wells AI, et al. Viruses. 2019 May 21;11(5):460. doi: 10.3390/v11050460. Viruses. 2019. PMID: 31117206 Free PMC article. Review. - Type III interferon signaling restricts enterovirus 71 infection of goblet cells.
Good C, Wells AI, Coyne CB. Good C, et al. Sci Adv. 2019 Mar 6;5(3):eaau4255. doi: 10.1126/sciadv.aau4255. eCollection 2019 Mar. Sci Adv. 2019. PMID: 30854425 Free PMC article. - Enterovirus Replication and Dissemination Are Differentially Controlled by Type I and III Interferons in the Gastrointestinal Tract.
Wells AI, Grimes KA, Coyne CB. Wells AI, et al. mBio. 2022 Jun 28;13(3):e0044322. doi: 10.1128/mbio.00443-22. Epub 2022 May 23. mBio. 2022. PMID: 35604122 Free PMC article. - Stem Cell-Derived Models of Viral Infections in the Gastrointestinal Tract.
Lanik WE, Mara MA, Mihi B, Coyne CB, Good M. Lanik WE, et al. Viruses. 2018 Mar 10;10(3):124. doi: 10.3390/v10030124. Viruses. 2018. PMID: 29534451 Free PMC article. Review.
Cited by
- Fusobacterium nucleatum Secretes Outer Membrane Vesicles and Promotes Intestinal Inflammation.
Engevik MA, Danhof HA, Ruan W, Engevik AC, Chang-Graham AL, Engevik KA, Shi Z, Zhao Y, Brand CK, Krystofiak ES, Venable S, Liu X, Hirschi KD, Hyser JM, Spinler JK, Britton RA, Versalovic J. Engevik MA, et al. mBio. 2021 Mar 2;12(2):e02706-20. doi: 10.1128/mBio.02706-20. mBio. 2021. PMID: 33653893 Free PMC article. - Pathoimmunological analyses of fatal E11 infection in premature infants.
Luo W, Wang L, Chen Z, Liu M, Zhao Y, Wu Y, Huang B, Wang P. Luo W, et al. Front Cell Infect Microbiol. 2024 Jul 9;14:1391824. doi: 10.3389/fcimb.2024.1391824. eCollection 2024. Front Cell Infect Microbiol. 2024. PMID: 39045132 Free PMC article. - An upstream protein-coding region in enteroviruses modulates virus infection in gut epithelial cells.
Lulla V, Dinan AM, Hosmillo M, Chaudhry Y, Sherry L, Irigoyen N, Nayak KM, Stonehouse NJ, Zilbauer M, Goodfellow I, Firth AE. Lulla V, et al. Nat Microbiol. 2019 Feb;4(2):280-292. doi: 10.1038/s41564-018-0297-1. Epub 2018 Nov 26. Nat Microbiol. 2019. PMID: 30478287 Free PMC article. - Establishment of porcine enterocyte/myofibroblast co-cultures for the growth of porcine rota- and coronaviruses.
Cui T, Theuns S, Desmarets LMB, Xie J, De Gryse GMA, Yang B, Van den Broeck W, Nauwynck HJ. Cui T, et al. Sci Rep. 2018 Oct 12;8(1):15195. doi: 10.1038/s41598-018-33305-1. Sci Rep. 2018. PMID: 30315177 Free PMC article. - Organoid Models for Infectious Disease.
Blutt SE, Estes MK. Blutt SE, et al. Annu Rev Med. 2022 Jan 27;73:167-182. doi: 10.1146/annurev-med-042320-023055. Epub 2021 Oct 13. Annu Rev Med. 2022. PMID: 34644153 Free PMC article. Review.
References
- Jaśkiewicz K, Mrozińska B. Myocarditis induced by coxsackie B3 virus in mature mice. Arch Immunol Ther Exp (Warsz) 1975;23(2):241–245. - PubMed
Publication types
MeSH terms
Substances
Grants and funding
- P30 CA047904/CA/NCI NIH HHS/United States
- R56 AI081759/AI/NIAID NIH HHS/United States
- K08 DK101608/DK/NIDDK NIH HHS/United States
- T32 AI060525/AI/NIAID NIH HHS/United States
- R01 AI081759/AI/NIAID NIH HHS/United States
LinkOut - more resources
Full Text Sources
Other Literature Sources
