Pathologically expanded peripheral T helper cell subset drives B cells in rheumatoid arthritis - PubMed (original) (raw)
. 2017 Feb 1;542(7639):110-114.
doi: 10.1038/nature20810.
Michael F Gurish 1, Jennifer L Marshall 2, Kamil Slowikowski 1 3 4 5 6, Chamith Y Fonseka 1 3 4 6 7, Yanyan Liu 1, Laura T Donlin 8 9, Lauren A Henderson 10, Kevin Wei 1, Fumitaka Mizoguchi 1, Nikola C Teslovich 1 3 4, Michael E Weinblatt 1, Elena M Massarotti 1, Jonathan S Coblyn 1, Simon M Helfgott 1, Yvonne C Lee 1, Derrick J Todd 1, Vivian P Bykerk 11 12, Susan M Goodman 11 12, Alessandra B Pernis 9 12 13, Lionel B Ivashkiv 8 9, Elizabeth W Karlson 1, Peter A Nigrovic 1 10, Andrew Filer 2, Christopher D Buckley 2, James A Lederer 14, Soumya Raychaudhuri 1 3 4 5 15 16, Michael B Brenner 1
Affiliations
- PMID: 28150777
- PMCID: PMC5349321
- DOI: 10.1038/nature20810
Pathologically expanded peripheral T helper cell subset drives B cells in rheumatoid arthritis
Deepak A Rao et al. Nature. 2017.
Abstract
CD4+ T cells are central mediators of autoimmune pathology; however, defining their key effector functions in specific autoimmune diseases remains challenging. Pathogenic CD4+ T cells within affected tissues may be identified by expression of markers of recent activation. Here we use mass cytometry to analyse activated T cells in joint tissue from patients with rheumatoid arthritis, a chronic immune-mediated arthritis that affects up to 1% of the population. This approach revealed a markedly expanded population of PD-1hiCXCR5-CD4+ T cells in synovium of patients with rheumatoid arthritis. However, these cells are not exhausted, despite high PD-1 expression. Rather, using multidimensional cytometry, transcriptomics, and functional assays, we define a population of PD-1hiCXCR5- 'peripheral helper' T (TPH) cells that express factors enabling B-cell help, including IL-21, CXCL13, ICOS, and MAF. Like PD-1hiCXCR5+ T follicular helper cells, TPH cells induce plasma cell differentiation in vitro through IL-21 secretion and SLAMF5 interaction (refs 3, 4). However, global transcriptomics highlight differences between TPH cells and T follicular helper cells, including altered expression of BCL6 and BLIMP1 and unique expression of chemokine receptors that direct migration to inflamed sites, such as CCR2, CX3CR1, and CCR5, in TPH cells. TPH cells appear to be uniquely poised to promote B-cell responses and antibody production within pathologically inflamed non-lymphoid tissues.
Figures
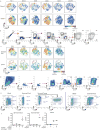
Extended Data Figure 1. Detection of PD-1hi CD4+ T cells in RA synovial tissue and fluid by mass and flow cytometry
a) viSNE plots of mass cytometry of RA synovial tissue CD4+ T cells as in Fig. 1a from 2 additional donors. b) Gating strategy to identify synovial tissue PD-1hi CD4+ T cell populations by mass cytometry. c) viSNE plots of flow cytometry of paired RA synovial fluid and blood memory CD4+ T cells. d) Gating strategy to identify synovial fluid PD-1hi memory CD4+ T cells by flow cytometry. e) Examples of gating used to sort memory CD4+ T cell populations from patient samples. f) Detection of CXCR5 mRNA by RT-PCR in sorted memory CD4+ T cell populations from synovial tissue (n=3 donors, 2 of which provided sufficient PD-1hi CXCR5+ cells for analysis), synovial fluid (n=3 donors, 1 of which provided sufficient PD-1hi CXCR5+ cells for analysis), and blood (n=2 donors). Purple boxes indicate PD-1- and PD-1hi CXCR5+ cells sorted from human tonsil as controls. Lines in (f) indicate mean for synovial or blood samples.
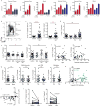
Extended Data Figure 2. PD-1hi CXCR5- CD4+ T cells are expanded in circulation of patients with active, seropositive RA and decrease with response to therapy
a) Mean expression of MHC II and ICOS in memory CD4+ T cell populations from synovial tissue (n=10), synovial fluid (n=9), and blood (n=42) from seropositive RA patients. Mean ± SD shown. b) Flow cytometric detection of PD-1 and CXCR5 expression on blood memory CD4+ T cells. c-e) Frequency of PD-1hi cells that co-express MHC II or ICOS (c), PD-1hi CXCR5+ cells (d) or cells with intermediate PD-1 expression (e) within memory CD4+ T cells from blood of patients with seropositive RA (n=42), seronegative RA (n=16), spondyloarthropathy (SpA, n=11), and non-inflammatory controls (n=35). f) Correlation between age or disease duration and blood PD-1hi CXCR5- cell frequency in seropositive RA patients (n=38). g) PD-1hi CXCR5- cell frequencies in seropositive RA patients segregated based on sex or medication usage (n=38). h) Correlation between serum anti-CCP antibody titer and blood PD-1hi CXCR5- cell frequency in all RA patients (n=53, black line, p=0.0049) or in only anti-CCP antibody+ patients (n=29, green line, p=0.48). i) Correlation between fold change in CDAI and fold change in PD-1hi CXCR5- cell frequency in patients 3 months after addition of a new RA medication (n=23; methotrexate=11, anti-TNF=4, abatacept=4, tocilizumab=2, tofacitinib=2). j) Frequency of PD-1hi T cell subpopulations in blood before and after RA treatment escalation in 18 patients with reduced disease activity after therapy. Median ± interquartile range in c,d,e; mean ± SD in a,g shown. * p<0.05, ** p<0.01, *** p<0.001, **** p<0.0001 by Mann-Whitney (c,g), Kruskal-Wallis (d,e), Wilcoxon test (j). In f,h,i p-values calculated by Spearman correlation.
Extended Data Figure 3. Blood PD-1hi CXCR5- CD4+ T cells express factors associated with B cell help
a) RT-PCR for intracellular regulators in memory CD4+ T cell populations from RA synovial fluid (n=5 or 6 donors). b) RT-PCR for cytokines (n=10 donors, 6 RA patients (black), 4 controls (grey)) and intracellular regulators (n=4 or 5 donors) in memory CD4+ T cell populations from blood. c) Cytokine and transcription factor mRNA expression in blood PD-1hi memory CD4+ T cell populations divided according to CXCR5 expression, relative to PD-1- cells (n=6 donors). d) Flow cytometric quantification of Bcl6 and Blimp-1 in blood PD-1hi memory CD4+ T cell subpopulations sorted according to chemokine receptor expression, then stimulated in vitro for 2 days with anti-CD3/CD28 beads. Representative data from 1 of 3 experiments using cells from different donors. Median ± interquartile range in a,b; mean ± SD in c,d shown. * p<0.05, ** p<0.01, *** p<0.001 by Friedman's test, compared to PD-1- MHCII- group (a,b).
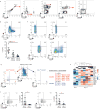
Extended Data Figure 4. Identification and characterization of circulating PD-1hi CXCR5- and PD-1hi CXCR5+ in mass cytometry and RNA-seq analyses
a) Gating of blood PD-1hi memory CD4+ T cells in mass cytometry analyses. b) Flow cytometric detection of FoxP3 and PD-1 in blood memory CD4+ T cells from RA patients (black, n=5) and controls (grey, n=3). c) Flow cytometric detection of inhibitory receptors on blood CXCR5- memory CD4+ T cells. Data from 1 of 3 RA patients with similar results. d) Sorting strategy for PD-1hi CXCR5- and PD-1hi CXCR5+ cell populations for RNA-seq. e) Hierarchical clustering T cell subpopulations sorted as in (d), with clustering based on expression of Tfh-associated genes measured by RNA-seq. f) Chemokine receptor expression on blood memory CD4+ T cells from RA patients (black) or controls (grey) by flow cytometry. Mean ± SD shown. * p<0.05, **p<0.001, *** p<0.0001 by Kruskal-Wallis test compared to PD-1- cells (b) or Wilcoxon test (f).
Extended Data Figure 5. Limited interconversion of PD-1hi CCR2+ and PD-1hi CXCR5+ T cells in vitro
a) Flow cytometry of CXCR5 and CCR2 on gated PD-1hi memory CD4+ T cells from blood. b) Expression of CXCR5 and CCR2 on indicated sorted PD-1hi T cell populations 7 days after in vitro stimulation with anti-CD3/CD28 beads. c,d) Percentage of cells from each sorted PD-1hi population that expressed CXCR5 or CCR2 on day 2 (c) or day 7 (d) after in vitro stimulation. Naive CD4+ T cells are shown as control. Mean ± SD shown (n=3 donors from 3 separate experiments).
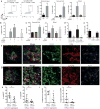
Extended Data Figure 6. SLAMF5 is required for B cell-helper function of PD-1hi CXCR5- CD4+ T cells
a) Flow cytometric quantification of SLAM, SLAMF5, and SLAMF6 expression on memory CD4+ T cells (n=10 donors; 5 RA patients, 5 controls). b) Quantification of frequency of memory B cells with plasma cell markers after co-culture with PD-1hi CXCR5+ CD4+ T cells with addition of blocking antibodies against SLAMF5 and/or SLAMF6. c) IgG quantification by ELISA in co-cultures of memory B cells with PD-1hi CXCR5- or PD-1hi CXCR5+ T cells with addition of blocking antibodies against SLAMF5 and/or SLAMF6. For b,c) 1 of 3 experiments with similar results (n=3 replicates shown). Mean ± SD shown. * p<0.05, ** p<0.01, *** p<0.001 by Kruskal-Wallis compared to PD-1- CXCR5- (a) or isotype control (b,c). d) Immunofluorescence microscopy of CD20 (green), CXCR5 (red), and PD-1 (blue), in seropositive RA synovial tissue. Arrows point to PD-1hi CXCR5- cells adjacent to B cells. Scale bar = 50 microns.
Figure 1. Expanded PD-1hi CXCR5- CD4+ T cells in joints and blood of seropositive RA patients
a) viSNE plots of mass cytometry of RA synovial tissue total CD4+ T cells. Color indicates cell expression level of labeled marker. Circle demonstrates PD-1hi cells. Arrow indicates CXCR5+ cells. b) PD-1hi T cell frequency in RA synovial tissue (n=6). c) PD-1hi CD4+ T cell frequencies in synovial fluid from seropositive RA (n=9) and seronegative inflammatory arthritides (n=19). d) PD-1hi cell frequencies in seropositive RA synovial fluid (n=9) and tissue (n=10). e) Percentage of PD-1hi CXCR5- cells within memory CD4+ T cells in seropositive RA (n=42), seronegative RA (n=16), spondyloarthropathy (SpA, n=11), and control (n=35) patient blood. f) PD-1hi frequency in blood of seropositive RA patients with low (n=14) or moderate-high (n=28) disease activity. g) PD-1hi CXCR5- CD4+ T cell and plasmablast frequencies in blood before and after RA treatment escalation (n=18). Mean ± SD in b,c,d, median ± interquartile range in e,f shown. * p<0.05, ** p<0.01, *** p<0.001, **** p<0.0001 by Mann-Whitney (c,d), Kruskal-Wallis (e,f), Wilcoxon test (g).
Figure 2. Synovial PD-1hi CXCR5- CD4+ T cells express factors associated with B cell help
a) RT-PCR for cytokines in memory CD4+ T cell populations from RA synovial fluid (n=7 donors). Median ± interquartile range. b) Cytokine production by synovial fluid memory CD4+ T cells (n=3 experiments using different donors). c) Transcription factor expression in synovial tissue memory CD4+ T cells by flow cytometry. d) Quantification of transcription factor expression in T cells from synovial fluid (blue, n=3 donors) or synovial tissue (green, n=3 donors). For b,d, mean ± SD shown. * p<0.05, ** p<0.01, *** p<0.001, **** p<0.0001 by Friedman's test compared to PD-1- MHC II- cells (a) or one-way ANOVA comparing PD-1-CXCR5-, PD-1hi CXCR5-, and PD-1- CXCR5+ (d).
Figure 3. High dimensional analyses of PD-1hi CXCR5- and PD-1hi CXCR5+ cells identify shared and distinct features
a) viSNE plots of blood memory CD4+ T cells from an RA patient. Circle indicates PD-1hi cells. b) Difference in expression of significantly altered proteins between PD-1hi populations and PD-1- CXCR5- cells (n=14 RA patients). c) Expression of indicated proteins by mass cytometry (n=7 RA patients (black) and 7 controls (grey)). d) PCA of RNA-seq transcriptomes (n=4 RA patients). e,f) Heatmap of expression of Tfh-associated genes (e) or chemokine receptors (f). g) CCR2 expression on PD-1hi CD4+ T cells by flow cytometry (blood n=20, fluid n=5, tissue n=10). Mean ± SD shown. ** p<0.001, *** p<0.0001 by Wilcoxon (c), Kruskal-Wallis test (g).
Figure 4. PD-1hi CXCR5- CD4+ T cells promote plasma cell differentiation via IL-21 and SLAMF5 interactions
a) Plasma cell frequency in T cell-B cell co-cultures using memory CD4+ T cells from indicated sources. Pooled data from 2 experiments (synovial tissue, n=3 replicates per experiment), 3 experiments (synovial fluid), or 6 experiments (blood) using different donors. b) Co-cultures as in (a) using blood T cell subpopulations. c) IgG in supernatants of co-cultures. d,e) Co-cultures with IL-21R-Ig fusion protein (d) or anti-SLAMF5/SLAMF6 antibody (e). For b-e) 1 of 3 experiments with different donors (n=3 replicates). f,g) Immunofluorescence microscopy of RA synovium showing PD-1hi CXCR5- cells (white arrow) and PD-1hi CXCR5+ cell (grey arrow). Scale bar = 50μM. h,i) Quantification of PD-1hi cells in RA synovium (n=5-8 HPF from 4 samples). Mean ± SD shown. * p<0.05, ** p<0.01, *** p<0.001 by Mann-Whitney (a[synovial tissue],d), Kruskal-Wallis compared to PD-1- CXCR5- (a[blood, synovial fluid],c,e), or Wilcoxon test (h,i).
Comment in
- Rheumatoid arthritis: New player in RA pathogenesis brought to light.
Collison J. Collison J. Nat Rev Rheumatol. 2017 Apr;13(4):195. doi: 10.1038/nrrheum.2017.19. Epub 2017 Feb 16. Nat Rev Rheumatol. 2017. PMID: 28202916 No abstract available. - Pathogenic CD4+ T cells regulating B-cell differentiation in autoimmunity: not exactly Tfh cells.
Tangye SG. Tangye SG. Immunol Cell Biol. 2017 May;95(5):419-421. doi: 10.1038/icb.2017.20. Epub 2017 Apr 18. Immunol Cell Biol. 2017. PMID: 28418020 No abstract available.
Similar articles
- [Detection of peripheral follicular helper T cells in rheumatoid arthritis].
An LM, Li J, Ji LL, Li GT, Zhang ZL. An LM, et al. Beijing Da Xue Xue Bao Yi Xue Ban. 2016 Dec 18;48(6):951-957. Beijing Da Xue Xue Bao Yi Xue Ban. 2016. PMID: 27987496 Chinese. - T Cells That Help B Cells in Chronically Inflamed Tissues.
Rao DA. Rao DA. Front Immunol. 2018 Aug 23;9:1924. doi: 10.3389/fimmu.2018.01924. eCollection 2018. Front Immunol. 2018. PMID: 30190721 Free PMC article. Review. - CXCL13-producing PD-1hiCXCR5- helper T cells in chronic inflammation.
Yoshitomi H. Yoshitomi H. Immunol Med. 2020 Dec;43(4):156-160. doi: 10.1080/25785826.2020.1781998. Epub 2020 Jun 25. Immunol Med. 2020. PMID: 32584200 Review. - CD4+CXCR5+PD-1+ T Follicular Helper Cells Play a Pivotal Role in the Development of Rheumatoid Arthritis.
Cao G, Chi S, Wang X, Sun J, Zhang Y. Cao G, et al. Med Sci Monit. 2019 Apr 25;25:3032-3040. doi: 10.12659/MSM.914868. Med Sci Monit. 2019. PMID: 31019190 Free PMC article. - PD-1+CXCR5-CD4+T cells are correlated with the severity of systemic lupus erythematosus.
Lin J, Yu Y, Ma J, Ren C, Chen W. Lin J, et al. Rheumatology (Oxford). 2019 Dec 1;58(12):2188-2192. doi: 10.1093/rheumatology/kez228. Rheumatology (Oxford). 2019. PMID: 31180450
Cited by
- Regulatory Fibroblast-Like Synoviocytes Cell Membrane Coated Nanoparticles: A Novel Targeted Therapy for Rheumatoid Arthritis.
Liu Y, Rao P, Qian H, Shi Y, Chen S, Lan J, Mu D, Chen R, Zhang X, Deng C, Liu G, Shi G. Liu Y, et al. Adv Sci (Weinh). 2023 Feb;10(4):e2204998. doi: 10.1002/advs.202204998. Epub 2022 Dec 12. Adv Sci (Weinh). 2023. PMID: 36509660 Free PMC article. - Increased Frequency of CD4+ Follicular Helper T and CD8+ Follicular T Cells in Human Lymph Node Biopsies during the Earliest Stages of Rheumatoid Arthritis.
Anang DC, Ramwadhdoebe TH, Hähnlein JS, van Kuijk B, Smits N, van Lienden KP, Maas M, Gerlag DM, Tak PP, de Vries N, van Baarsen LGM. Anang DC, et al. Cells. 2022 Mar 24;11(7):1104. doi: 10.3390/cells11071104. Cells. 2022. PMID: 35406668 Free PMC article. - Sex-based differences in association between circulating T cell subsets and disease activity in untreated early rheumatoid arthritis patients.
Aldridge J, Pandya JM, Meurs L, Andersson K, Nordström I, Theander E, Lundell AC, Rudin A. Aldridge J, et al. Arthritis Res Ther. 2018 Jul 20;20(1):150. doi: 10.1186/s13075-018-1648-2. Arthritis Res Ther. 2018. PMID: 30029616 Free PMC article. - Precision medicine in rheumatoid arthritis.
Bhamidipati K, Wei K. Bhamidipati K, et al. Best Pract Res Clin Rheumatol. 2022 Mar;36(1):101742. doi: 10.1016/j.berh.2022.101742. Epub 2022 Mar 2. Best Pract Res Clin Rheumatol. 2022. PMID: 35248489 Free PMC article. Review. - PD1hi cells associate with clusters of proliferating B-cells in marginal zone lymphoma.
Wickenden K, Nawaz N, Mamand S, Kotecha D, Wilson AL, Wagner SD, Ahearne MJ. Wickenden K, et al. Diagn Pathol. 2018 Sep 15;13(1):74. doi: 10.1186/s13000-018-0750-8. Diagn Pathol. 2018. PMID: 30219078 Free PMC article.
References
Methods References
- Bray N, P H, Melsted P, Pachter L. Near-optimal RNA-Seq quantification. arXiv. 2015;1505 02710v02712.
MeSH terms
Substances
Grants and funding
- 19791/VAC_/Versus Arthritis/United Kingdom
- R01 AR046713/AR/NIAMS NIH HHS/United States
- R01 AR048114/AR/NIAMS NIH HHS/United States
- 20088/VAC_/Versus Arthritis/United Kingdom
- R01 AR065538/AR/NIAMS NIH HHS/United States
- 19791/ARC_/Arthritis Research UK/United Kingdom
- R01 AR064850/AR/NIAMS NIH HHS/United States
- R01 AR063759/AR/NIAMS NIH HHS/United States
- U01 HG009379/HG/NHGRI NIH HHS/United States
- L40 AR065238/AR/NIAMS NIH HHS/United States
- 20088/ARC_/Arthritis Research UK/United Kingdom
- UH2 AR067691/AR/NIAMS NIH HHS/United States
- P30 AR070253/AR/NIAMS NIH HHS/United States
- K01 AR066063/AR/NIAMS NIH HHS/United States
- U19 AI111224/AI/NIAID NIH HHS/United States
- T32 AR007530/AR/NIAMS NIH HHS/United States
- U01 GM092691/GM/NIGMS NIH HHS/United States
LinkOut - more resources
Full Text Sources
Other Literature Sources
Medical
Research Materials
Miscellaneous


