Y RNA fragment in extracellular vesicles confers cardioprotection via modulation of IL-10 expression and secretion - PubMed (original) (raw)
Y RNA fragment in extracellular vesicles confers cardioprotection via modulation of IL-10 expression and secretion
Linda Cambier et al. EMBO Mol Med. 2017 Mar.
Abstract
Cardiosphere-derived cells (CDCs) reduce myocardial infarct size via secreted extracellular vesicles (CDC-EVs), including exosomes, which alter macrophage polarization. We questioned whether short non-coding RNA species of unknown function within CDC-EVs contribute to cardioprotection. The most abundant RNA species in CDC-EVs is a Y RNA fragment (EV-YF1); its relative abundance in CDC-EVs correlates with CDC potency in vivo Fluorescently labeled EV-YF1 is actively transferred from CDCs to target macrophages via CDC-EVs. Direct transfection of macrophages with EV-YF1 induced transcription and secretion of IL-10. When cocultured with rat cardiomyocytes, EV-YF1-primed macrophages were potently cytoprotective toward oxidatively stressed cardiomyocytes through induction of IL-10. In vivo, intracoronary injection of EV-YF1 following ischemia/reperfusion reduced infarct size. A fragment of Y RNA, highly enriched in CDC-EVs, alters Il10 gene expression and enhances IL-10 protein secretion. The demonstration that EV-YF1 confers cardioprotection highlights the potential importance of diverse exosomal contents of unknown function, above and beyond the usual suspects (e.g., microRNAs and proteins).
Keywords: RNA; extracellular vesicle; macrophage; stem cells.
© 2017 The Authors. Published under the terms of the CC BY 4.0 license.
Figures
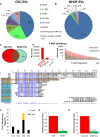
Figure 1. RNA content of CDC‐EVs (day 5)
- A, B
Pie chart depicting the percent distribution of small RNA species in CDC‐EVs (A) and NHDF‐EVs (B), collected following 5 days of serum‐free culture. - C
Venn diagram depicting the number of unique and common Y RNA sequences in CDC‐EVs and NHDF‐EVs. - D
Graphical depictions of the abundance of the common Y RNA fragments in CDC‐EVs and NHDF‐EVs according to the number of reads obtained by RNA‐seq. Left graph: top three most abundant Y RNA fragments (linear scale). Right graph: the remaining 301 Y RNA fragments (logarithmic scale). - E
Sequence alignment of each full‐length human Y RNA (hY1, hY3, hY4, and hY5) with Y RNA fragments. Highlighted here are the top nine Y RNA fragments uniquely expressed in CDC‐EVs (blue; 9/613 in C) and the top 10 commonly expressed between CDC‐EVs and NHDF‐EVs (green; 10/304 in C). The most highly expressed Y RNA fragment (EV‐YF1) is highlighted in orange. - F
Proportion of Y RNA fragments derived from the 5′‐ or 3′‐end of the four full‐length human Y RNA genes. - G, H
Relative expression of EV‐YF1 by qPCR in CDCs and NHDFs (G) and their respective EVs (H). Results depict the mean ± SEM of two independent experiments, n = 6. Groups were compared using two‐tailed, unpaired, Student's _t_‐test; (G) **P = 0.0024; (H) ****P < 0.0001.
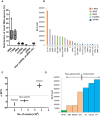
Figure 2. CDC‐EVs EV‐YF1 content correlates with CDC potency in vivo
- Graph depicting the percent distribution of small RNA species in CDC‐EVs from six different donors (as shown in Table 1). Horizontal lines represent the median value, box limits represent 75 and 25% percentile of the total values and the bars represent the maximal and minimal value.
- Graph representing the most abundant sequences expressed in OD220 CDC‐EVs. EV‐YF1: URS000072DA11; tRNA‐1: URS00006FBEE8; tRNA‐2: URS000072EF3B; tRNA‐3: URS0000758E15; 28S rRNA: URS00003692B6; tRNA‐4: URS000072CC66; 45S pre‐rRNA: URS000025EB0F; tRNA‐5: URS000072F18F; tRNA‐6: URS000072F2C3; Yc: URS000072E641; tRNA‐7: URS000072B56D; pre‐mir‐23a: URS000075EDA8; 28S rRNA 5: URS000075EC78; tRNA‐8: URS0000701715; pre‐mir‐21: URS000075E5CC; long non‐coding RNA (Mir17hg gene): URS000076343C; tRNA‐9: URS00006A0CFD; tRNA‐10: URS0000717173; pre‐mir‐12: URS00007A4AA9; tRNA‐11: URS0000750232; tRNA‐12: URS000072345A.
- Correlation between the percent change in ejection fraction (baseline 2 h post‐MI to 21 days, ΔEF%) post‐MI with CDC treatment (six different donors, n = 8 animals/donor) or placebo (n = 14 animals) and EV‐YF1 abundance in CDC‐EVs. Potent CDCs (ZCI, YKT, OD220) were delineated from non‐potent CDCs (LO88, BM030, ZKN) by positive ΔEF%. Error bars represent the SEM of the delta ejection fraction % between animals treated with placebo, non‐potent or potent CDCs, respectively.
- EV‐YF1 abundance based on RNA‐seq counts in EVs from potent (ZCI, YKT, OD220) and non‐potent CDCs (LO88, BM030, ZKN) and NHDFs.
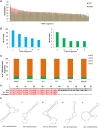
Figure 3. CDC‐EVs Y RNA fragment length, distribution, and alignment
- Graph representing the nucleic acid length of the 304 common Y RNA fragments between CDC‐EVs and NHDF‐EVs.
- Graphical depictions of the abundance of the five most abundant unique Y RNA fragments in CDC‐EVs (left) and in NHDF‐EVs (right) according to the number (Nb) of reads obtained by RNA‐seq.
- Percentage of Y RNA fragments in CDC‐EVs from different CDC donors derived from each full‐length Y RNA (hY1, hY3, hY4, hY5).
- Sequence alignment between hY4 and EV‐YF1 reveals a thymine insertion at position 16 in EV‐YF1 (score: 99.0 bits, identities 56/57; 98%).
- Predicted secondary structures of EV‐YF1 by UNAFold (dG: delta Gibbs free energy).
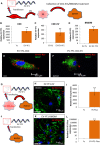
Figure 4. Cytoplasmic localization and expression of EV‐YF1‐fluo
- A
Schematic of the protocol for EV‐YF1‐fluo transfection into CDCs (OD220 donor) followed by the collection and treatment of CDC‐EVs into BMDMs. - B–D
Expression of EV‐YF1 by qPCR in CDCs (B), CDC‐EVs (C), and BMDMs (D) described in (A). Results depict the mean ± SEM of n = 3. - E, F
Representative images of EV‐YF1‐fluo‐transfected CDCs (E) and BMDMs treated with CDC‐EVs (F). Fluorescently conjugated EV‐YF1 (red, EV‐YF1‐fluo), MitoTracker Green FM (green, MitoT); DAPI (blue). - G–L
Schematic of the protocol for BMDMs treated with directly transfected CDC‐EVs (G) or transfected with EV‐YF1‐fluo (J). Immunocytochemical staining reveals punctate, cytoplasmic localization of EV‐YF1‐fluo (red) in BMDMs following treatment with directly transfected CDC‐EVs (H) or transfection with EV‐YF1‐fluo (K). BMDMs in (H and K) were stained with CD45 (green) and DAPI (blue). (I and L) EV‐YF1 expression in BMDMs following treatments described in conditions (G and J), respectively, compared to their Ys (scrambled oligoribonucleotide) control. Results depict the mean ± SEM of n = 3.
Data information: (B–D, I, L) Groups were compared using two‐tailed, unpaired, Student's _t_‐test; (B) **P = 0.0013; (C) **P = 0.0059; (D) **P = 0.0019; (I) **P = 0.002; (L) **P = 0.0034). (E, F, H, K) Scale bars: 10 μm.
Figure 5. EV‐YF1 modulates IL‐10 expression
- Gene expression profile by qPCR of BMDMs polarized toward M1 (IFNγ and LPS), M2 (IL‐4 and IL‐13) or treated with CDC‐EVs (versus untreated control BMDM, dotted line). Results depict the mean ± SEM of two independent experiments, n = 3 each. Statistical significance was determined using multiple _t_‐tests followed by Holm–Sidak's multiple corrections test; *P < 0.05.
- Gene expression profile by qPCR of BMDMs primed with EV‐YF1 or Ys (versus untreated control BMDM, dotted line). Results depict the mean ± SEM of two independent experiments, n = 3 each. Statistical significance was determined using multiple _t_‐tests followed by Holm–Sidak's multiple corrections test; *P < 0.05.
- Gene expression of Il10 in BMDMs following transfection with EV‐YF1 or Ys, as determined by qPCR. Results depict the mean ± SEM of two independent experiments, n = 6 each. Groups were compared using two‐tailed, unpaired, Student's _t_‐test; **P < 0.0044.
- Protein secretion of IL‐10 from BMDMs at 24, 48, and 72 h following transfection with EV‐YF1 or Ys, by ELISA. Results depict the mean ± SEM of an experiment representative of two independent experiments, n = 6 each. Groups were compared using one‐way ANOVA followed by Tukey's multiple comparisons test; ****P < 0.0001.
Figure 6. EV‐YF1‐primed BMDMs induce IL‐10 and protect cardiomyocytes from oxidative stress
- Schematic of in vitro protocol. NRVMs were cultured with or without 75 μM H2O2 (15 min), media was replaced with serum‐free media (SF) (20 min), and then, Ys‐ or EV‐YF1‐primed BMDMs were added in coculture [or recombinant IL‐10 (rIL‐10, 10 ng/ml) was added]. Six hours later, cells were analyzed for apoptosis. Mean of 2–4 independent experiments in four different wells/experiment.
- Representative images of the cells in (A), stained for TUNEL (green), α‐actinin (red), CD45 (white), and DAPI (blue). Scale bars: 10 μm.
- Pooled analyses of TUNEL+ cardiomyocytes (CM). Graphs depict mean ± SEM of 4 replicates. Groups were compared using one‐way ANOVA followed by Tukey's multiple comparisons test; † _P_‐values: versus H2O2 treatment (positive control); *_P_‐values: between treatment groups.
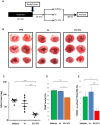
Figure 7. EV‐YF1 is cardioprotective against I/R injury in rats
- Schematic representation of in vivo I/R protocol.
- Representative TTC‐stained hearts from animals at 48 h following I/R injury.
- Quantitative measurements of TTC‐stained hearts, depicted as infarct mass (n = 5–6 rats per group). Graphs depict mean ± SEM. Groups were compared using one‐way ANOVA followed by Tukey's multiple comparisons test; vehicle versus EV‐YF1: ***P = 0.0003; Ys versus EV‐YF1: **P = 0.0014.
- Pooled analysis of CD68+ cells within the infarct tissue 48 h following I/R injury. Graphs depict mean ± SEM (n = 3 rats per group). Groups were compared using one‐way ANOVA followed by Tukey's multiple comparisons test; vehicle versus EV‐YF1: **P = 0.007; Ys versus EV‐YF1: *P = 0.0123.
- Pooled analysis of TUNEL+ cardiomyocytes (CM) within the infarct tissue 48 h following I/R injury. Graphs depict mean ± SEM (n = 3 rats per group). Groups were compared using one‐way ANOVA followed by Tukey's multiple comparisons test; vehicle versus EV‐YF1: *P = 0.0377; Ys versus EV‐YF1: **P = 0.0075.
Similar articles
- Angiotensin II-Induced End-Organ Damage in Mice Is Attenuated by Human Exosomes and by an Exosomal Y RNA Fragment.
Cambier L, Giani JF, Liu W, Ijichi T, Echavez AK, Valle J, Marbán E. Cambier L, et al. Hypertension. 2018 Aug;72(2):370-380. doi: 10.1161/HYPERTENSIONAHA.118.11239. Epub 2018 Jun 4. Hypertension. 2018. PMID: 29866742 Free PMC article. - CDC-derived extracellular vesicles reprogram inflammatory macrophages to an arginase 1-dependent proangiogenic phenotype.
Mentkowski KI, Mursleen A, Snitzer JD, Euscher LM, Lang JK. Mentkowski KI, et al. Am J Physiol Heart Circ Physiol. 2020 Jun 1;318(6):H1447-H1460. doi: 10.1152/ajpheart.00155.2020. Epub 2020 Apr 24. Am J Physiol Heart Circ Physiol. 2020. PMID: 32330087 Free PMC article. - Characterization of βARKct engineered cellular extracellular vesicles and model specific cardioprotection.
Kwon JS, Schumacher SM, Gao E, Chuprun JK, Ibetti J, Roy R, Khan M, Kishore R, Koch WJ. Kwon JS, et al. Am J Physiol Heart Circ Physiol. 2021 Apr 1;320(4):H1276-H1289. doi: 10.1152/ajpheart.00571.2020. Epub 2021 Jan 29. Am J Physiol Heart Circ Physiol. 2021. PMID: 33513081 Free PMC article. - Cardioprotective role of extracellular vesicles: A highlight on exosome beneficial effects in cardiovascular diseases.
Rezaie J, Rahbarghazi R, Pezeshki M, Mazhar M, Yekani F, Khaksar M, Shokrollahi E, Amini H, Hashemzadeh S, Sokullu SE, Tokac M. Rezaie J, et al. J Cell Physiol. 2019 Dec;234(12):21732-21745. doi: 10.1002/jcp.28894. Epub 2019 May 29. J Cell Physiol. 2019. PMID: 31140622 Review. - Cardiac Extracellular Vesicles in Normal and Infarcted Heart.
Chistiakov DA, Orekhov AN, Bobryshev YV. Chistiakov DA, et al. Int J Mol Sci. 2016 Jan 5;17(1):63. doi: 10.3390/ijms17010063. Int J Mol Sci. 2016. PMID: 26742038 Free PMC article. Review.
Cited by
- New Insights and Novel Therapeutic Potentials for Macrophages in Myocardial Infarction.
Zhang Z, Tang J, Cui X, Qin B, Zhang J, Zhang L, Zhang H, Liu G, Wang W, Zhang J. Zhang Z, et al. Inflammation. 2021 Oct;44(5):1696-1712. doi: 10.1007/s10753-021-01467-2. Epub 2021 Apr 18. Inflammation. 2021. PMID: 33866463 Free PMC article. Review. - How does an RNA selfie work? EV-associated RNA in innate immunity as self or danger.
Xiao Y, Driedonks T, Witwer KW, Wang Q, Yin H. Xiao Y, et al. J Extracell Vesicles. 2020 Jul 15;9(1):1793515. doi: 10.1080/20013078.2020.1793515. J Extracell Vesicles. 2020. PMID: 32944182 Free PMC article. Review. - Can Extracellular Vesicles as Drug Delivery Systems Be a Game Changer in Cardiac Disease?
Okamura A, Yoshioka Y, Saito Y, Ochiya T. Okamura A, et al. Pharm Res. 2023 Apr;40(4):889-908. doi: 10.1007/s11095-022-03463-z. Epub 2022 Dec 28. Pharm Res. 2023. PMID: 36577860 Free PMC article. Review. - Extracellular Vesicles and Their Emerging Roles as Cellular Messengers in Endocrinology: An Endocrine Society Scientific Statement.
Salomon C, Das S, Erdbrügger U, Kalluri R, Kiang Lim S, Olefsky JM, Rice GE, Sahoo S, Andy Tao W, Vader P, Wang Q, Weaver AM. Salomon C, et al. Endocr Rev. 2022 May 12;43(3):441-468. doi: 10.1210/endrev/bnac009. Endocr Rev. 2022. PMID: 35552682 Free PMC article. - Pediatric brain tumor cell lines exhibit miRNA-depleted, Y RNA-enriched extracellular vesicles.
Magaña SM, Peterson TE, Evans JE, Decker PA, Simon V, Eckel-Passow JE, Daniels DJ, Parney IF. Magaña SM, et al. J Neurooncol. 2022 Jan;156(2):269-279. doi: 10.1007/s11060-021-03914-4. Epub 2022 Jan 5. J Neurooncol. 2022. PMID: 34984645
References
- Asadullah K (2003) Interleukin‐10 therapy–review of a new approach. Pharmacol Rev 55: 241–269 - PubMed
- Bagchi AK, Sharma A, Dhingra S, Lehenbauer Ludke AR, Al‐Shudiefat AA, Singal PK (2013) Interleukin‐10 activates Toll‐like receptor 4 and requires MyD88 for cardiomyocyte survival. Cytokine 61: 304–314 - PubMed
- Bolger AP, Sharma R, von Haehling S, Doehner W, Oliver B, Rauchhaus M, Coats AJS, Adcock IM, Anker SD (2002) Effect of interleukin‐10 on the production of tumor necrosis factor‐alpha by peripheral blood mononuclear cells from patients with chronic heart failure. Am J Cardiol 90: 384–389 - PubMed
- Burchfield JS, Iwasaki M, Koyanagi M, Urbich C, Rosenthal N, Zeiher AM, Dimmeler S (2008) Interleukin‐10 from transplanted bone marrow mononuclear cells contributes to cardiac protection after myocardial infarction. Circ Res 103: 203–211 - PubMed
MeSH terms
Substances
LinkOut - more resources
Full Text Sources
Other Literature Sources
Medical
