Transcription Profiling of Bacillus subtilis Cells Infected with AR9, a Giant Phage Encoding Two Multisubunit RNA Polymerases - PubMed (original) (raw)
Transcription Profiling of Bacillus subtilis Cells Infected with AR9, a Giant Phage Encoding Two Multisubunit RNA Polymerases
Daria Lavysh et al. mBio. 2017.
Abstract
Bacteriophage AR9 is a recently sequenced jumbo phage that encodes two multisubunit RNA polymerases. Here we investigated the AR9 transcription strategy and the effect of AR9 infection on the transcription of its host, Bacillus subtilis Analysis of whole-genome transcription revealed early, late, and continuously expressed AR9 genes. Alignment of sequences upstream of the 5' ends of AR9 transcripts revealed consensus sequences that define early and late phage promoters. Continuously expressed AR9 genes have both early and late promoters in front of them. Early AR9 transcription is independent of protein synthesis and must be determined by virion RNA polymerase injected together with viral DNA. During infection, the overall amount of host mRNAs is significantly decreased. Analysis of relative amounts of host transcripts revealed notable differences in the levels of some mRNAs. The physiological significance of up- or downregulation of host genes for AR9 phage infection remains to be established. AR9 infection is significantly affected by rifampin, an inhibitor of host RNA polymerase transcription. The effect is likely caused by the antibiotic-induced killing of host cells, while phage genome transcription is solely performed by viral RNA polymerases.IMPORTANCE Phages regulate the timing of the expression of their own genes to coordinate processes in the infected cell and maximize the release of viral progeny. Phages also alter the levels of host transcripts. Here we present the results of a temporal analysis of the host and viral transcriptomes of Bacillus subtilis infected with a giant phage, AR9. We identify viral promoters recognized by two virus-encoded RNA polymerases that are a unique feature of the phiKZ-related group of phages to which AR9 belongs. Our results set the stage for future analyses of highly unusual RNA polymerases encoded by AR9 and other phiKZ-related phages.
Copyright © 2017 Lavysh et al.
Figures
FIG 1
General properties of the AR9 infection process. (A) AR9 one-step growth curve on B. subtilis 168. The numbers of PFU per infected cell in chloroform-treated and untreated cultures are shown. (B) Accumulation of phage AR9 DNA during infection determined by qPCR analysis of DNA extracted at different time points after phage infection. The results obtained for the AR9 gene g283 and the B. subtilis (B.s) gene yoxA in three independent reactions are shown. (C) AR9 one-step growth curve in the presence of the host RNAP inhibitor rifampin (Rif). The culture was chloroform treated prior to PFU determination. (D) AR9 one-step growth curve on a B. subtilis 168 mutant resistant to rifampin in the presence of rifampin. The culture was chloroform treated. For every one-step growth curve, each data point is an average of three biological replicates; error bars indicate standard deviations.
FIG 2
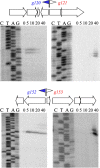
Temporal patterns of expression of selected AR9 genes. Primer extension reactions were conducted with RNA prepared from AR9-infected cells with primers annealing to regions separating the oppositely transcribed AR9 genes indicated. Time postinfection (in minutes) is indicated at the top of each gel. Early promoters and corresponding genes are blue, and late genes are red.
FIG 3
Early and late promoters of bacteriophage AR9 revealed by dRNA-Seq analysis of phage transcripts. Consensus sequences for early (A) and late (B) promoters are shown at the top. The dRNA-Seq data for two early (P087 and P104) and two late (P077 and P232) promoters are presented below. Regions at the 5′ ends of selected AR9 genes from cDNA libraries without (black) or with (red) TEX treatment are presented (the AR9 genome coordinates are shown at the bottom [A] and top [B], since corresponding early and late genes are transcribed from different strands of the genome). At the bottom, primer extension data validating the dRNA-Seq results along with the corresponding sequencing reactions are shown. Time postinfection (in minutes) is shown at the top of each gel. Below each primer extension gel, the sequence upstream of the primer extension endpoint is shown, with consensus elements highlighted in colors.
FIG 4
Global temporal patterns of AR9 genome transcription. (A) A heat map summarizing the temporal pattern of AR9 transcripts. The normalized expression levels of each AR9 gene across three time points (5, 20, and 40 min postinfection) are color coded blue for high and yellow for low expression levels. Late genes are underlined in dark gray, and continuously expressed genes are underlined in light gray. (B to D) Time courses of accumulation of individual AR9 transcripts (292 ORFs and one tRNA gene) divided into three classes are shown. The y axes show normalized gene expression levels.
FIG 5
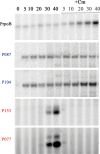
Influence of chloramphenicol on AR9 infection. Extension of primers for AR9 early genes g087 and g104 and late genes g153 and g077 and the B. subtilis rpoB gene on total RNA purified from control cells and from cells treated with 30 μg/ml chloramphenicol (Cm) added 5 min prior to infection. Times of infection (minutes) are indicated at the top.
FIG 6
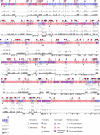
Operon organization of bacteriophage AR9 genes. Shown is a schematic representation of the AR9 genome combined with cDNAs of 5 (light gray)-, 20 (darker gray)-, and 40 (dark gray)-min cDNA libraries mapped on both strands of phage DNA. Coverage for the 5-min time point is shown within a −100-to-100 window size, and that for the 20- and 40-min time points is shown within a −200-to-200 window size. Promoters and terminators are indicated. Early operons are labeled (with numbers marking corresponding genes) below the arrows representing the genes, and late operons are labeled above the arrows representing the genes. The data used to construct this map are available in Tables S2 to S4.
FIG 7
B. subtilis 168 genes differently affected by AR9 infection. (A) Host DIGs revealed by RNA-Seq data are presented (downregulated genes are red, and upregulated genes are purple). Genes whose expression is upregulated at the middle of infection (at 20 min) and then downregulated are blue. (B) Validation of RNA-Seq data by RT-qPCR. The expression levels of five selected DIGs were determined by RT-qPCR and normalized to the expression level of the B. subtilis housekeeping gene yoxA by the ΔΔ_C_ T method (37).
Similar articles
- A non-canonical multisubunit RNA polymerase encoded by the AR9 phage recognizes the template strand of its uracil-containing promoters.
Sokolova M, Borukhov S, Lavysh D, Artamonova T, Khodorkovskii M, Severinov K. Sokolova M, et al. Nucleic Acids Res. 2017 Jun 2;45(10):5958-5967. doi: 10.1093/nar/gkx264. Nucleic Acids Res. 2017. PMID: 28402520 Free PMC article. - The genome of AR9, a giant transducing Bacillus phage encoding two multisubunit RNA polymerases.
Lavysh D, Sokolova M, Minakhin L, Yakunina M, Artamonova T, Kozyavkin S, Makarova KS, Koonin EV, Severinov K. Lavysh D, et al. Virology. 2016 Aug;495:185-96. doi: 10.1016/j.virol.2016.04.030. Epub 2016 May 26. Virology. 2016. PMID: 27236306 - Multisubunit RNA Polymerases of Jumbo Bacteriophages.
Sokolova ML, Misovetc I, V Severinov K. Sokolova ML, et al. Viruses. 2020 Sep 23;12(10):1064. doi: 10.3390/v12101064. Viruses. 2020. PMID: 32977622 Free PMC article. Review. - A non-canonical multisubunit RNA polymerase encoded by a giant bacteriophage.
Yakunina M, Artamonova T, Borukhov S, Makarova KS, Severinov K, Minakhin L. Yakunina M, et al. Nucleic Acids Res. 2015 Dec 2;43(21):10411-20. doi: 10.1093/nar/gkv1095. Epub 2015 Oct 20. Nucleic Acids Res. 2015. PMID: 26490960 Free PMC article. - Unusual relatives of the multisubunit RNA polymerase.
Forrest D. Forrest D. Biochem Soc Trans. 2019 Feb 28;47(1):219-228. doi: 10.1042/BST20180505. Epub 2018 Dec 21. Biochem Soc Trans. 2019. PMID: 30578347 Review.
Cited by
- Phage-Antibiotic Combination Treatments: Antagonistic Impacts of Antibiotics on the Pharmacodynamics of Phage Therapy?
Abedon ST. Abedon ST. Antibiotics (Basel). 2019 Oct 11;8(4):182. doi: 10.3390/antibiotics8040182. Antibiotics (Basel). 2019. PMID: 31614449 Free PMC article. Review. - A combination therapy of Phages and Antibiotics: Two is better than one.
Li X, He Y, Wang Z, Wei J, Hu T, Si J, Tao G, Zhang L, Xie L, Abdalla AE, Wang G, Li Y, Teng T. Li X, et al. Int J Biol Sci. 2021 Aug 18;17(13):3573-3582. doi: 10.7150/ijbs.60551. eCollection 2021. Int J Biol Sci. 2021. PMID: 34512166 Free PMC article. Review. - A non-canonical multisubunit RNA polymerase encoded by the AR9 phage recognizes the template strand of its uracil-containing promoters.
Sokolova M, Borukhov S, Lavysh D, Artamonova T, Khodorkovskii M, Severinov K. Sokolova M, et al. Nucleic Acids Res. 2017 Jun 2;45(10):5958-5967. doi: 10.1093/nar/gkx264. Nucleic Acids Res. 2017. PMID: 28402520 Free PMC article. - Regulatory protein SrpA controls phage infection and core cellular processes in Pseudomonas aeruginosa.
You J, Sun L, Yang X, Pan X, Huang Z, Zhang X, Gong M, Fan Z, Li L, Cui X, Jing Z, Jin S, Rao Z, Wu W, Yang H. You J, et al. Nat Commun. 2018 May 10;9(1):1846. doi: 10.1038/s41467-018-04232-6. Nat Commun. 2018. PMID: 29748556 Free PMC article. - Assessing the transcriptional landscape of Pseudomonas phage 201ϕ2-1: Uncovering the small regulatory details of a giant phage.
Poppeliers J, Focquet M, Boon M, De Mey M, Thomas J, Lavigne R. Poppeliers J, et al. Microb Biotechnol. 2024 Oct;17(10):e70037. doi: 10.1111/1751-7915.70037. Microb Biotechnol. 2024. PMID: 39460739 Free PMC article.
References
- Chevallereau A, Blasdel BG, De Smet J, Monot M, Zimmermann M, Kogadeeva M, Sauer U, Jorth P, Whiteley M, Debarbieux L, Lavigne R. 2016. Next-generation “-omics” approaches reveal a massive alteration of host RNA metabolism during bacteriophage infection of Pseudomonas aeruginosa. PLoS Genet 12:e1006134. doi:10.1371/journal.pgen.1006134. - DOI - PMC - PubMed
Publication types
MeSH terms
Substances
LinkOut - more resources
Full Text Sources
Other Literature Sources
Molecular Biology Databases


