Rapid, precise quantification of bacterial cellular dimensions across a genomic-scale knockout library - PubMed (original) (raw)
doi: 10.1186/s12915-017-0348-8.
Timothy K Lee 1, Daisuke Shiomi 3 4, Handuo Shi 1, Carolina Tropini 5 6, Russell D Monds 1 7, Alexandre Colavin 5, Gabriel Billings 8, Ilina Bhaya-Grossman 1, Michael Broxton 9, Bevan Emma Huang 10, Hironori Niki 3, Kerwyn Casey Huang 11 12
Affiliations
- PMID: 28222723
- PMCID: PMC5320674
- DOI: 10.1186/s12915-017-0348-8
Rapid, precise quantification of bacterial cellular dimensions across a genomic-scale knockout library
Tristan Ursell et al. BMC Biol. 2017.
Abstract
Background: The determination and regulation of cell morphology are critical components of cell-cycle control, fitness, and development in both single-cell and multicellular organisms. Understanding how environmental factors, chemical perturbations, and genetic differences affect cell morphology requires precise, unbiased, and validated measurements of cell-shape features.
Results: Here we introduce two software packages, Morphometrics and BlurLab, that together enable automated, computationally efficient, unbiased identification of cells and morphological features. We applied these tools to bacterial cells because the small size of these cells and the subtlety of certain morphological changes have thus far obscured correlations between bacterial morphology and genotype. We used an online resource of images of the Keio knockout library of nonessential genes in the Gram-negative bacterium Escherichia coli to demonstrate that cell width, width variability, and length significantly correlate with each other and with drug treatments, nutrient changes, and environmental conditions. Further, we combined morphological classification of genetic variants with genetic meta-analysis to reveal novel connections among gene function, fitness, and cell morphology, thus suggesting potential functions for unknown genes and differences in modes of action of antibiotics.
Conclusions: Morphometrics and BlurLab set the stage for future quantitative studies of bacterial cell shape and intracellular localization. The previously unappreciated connections between morphological parameters measured with these software packages and the cellular environment point toward novel mechanistic connections among physiological perturbations, cell fitness, and growth.
Keywords: Cell biology; Cell morphology; Cell shape; Chemical genomics; Computer vision; Imaging; Microbiology; Microscopy; Principal component analysis; Segmentation.
Figures
Fig. 1
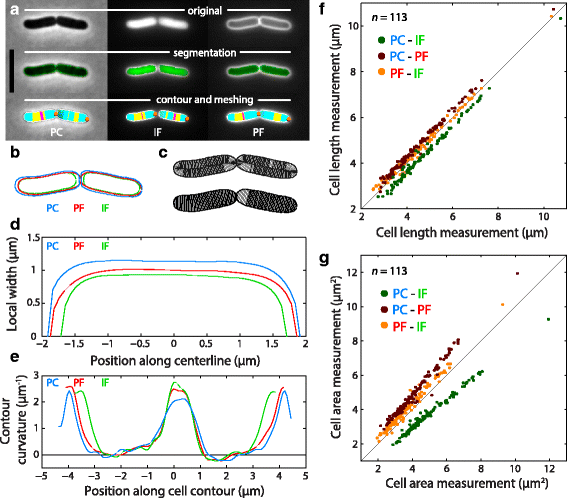
Quantitation demonstrates consistency among contour measurements from different imaging modalities, despite small differences. a E. coli cells imaged using phase contrast (PC), interior fluorescence (IF) from cytoplasmic GFP, and peripheral fluorescence (PF) from the surface marker Alexa 594-Wheat Germ Agglutinin. Top: original images; middle: segmentation output from Morphometrics; bottom: extracted contours and meshlines. The pole from which all contours are measured is marked by orange and maroon dots for the beginning and end of the contours, respectively. Meshlines are colored cyan if the cell contour has positive (outward) curvature at both endpoints, maroon if the contour has negative curvature (inward) at both endpoints, and yellow if the contour has opposite signs of curvature (indicating a region where the cell body curves). Scale bar: 5 μm. b Overlay of the PC, IF, and PF cell outlines from (a). c Branching mesh (top) and centerline mesh (bottom) of the cells in (a), using the PF contours. These meshes are used to measure width profiles along the cell. d Comparison of the single-cell width profiles from pole to pole among all three imaging modalities for the cell on the left in (a). PC contours consistently estimate larger widths than PF or IF contours. e The PC, IF, and PF contours have similar curvature profiles, with slight differences consistent with width differences in (d). f Differences in cell-length measurements among imaging modalities are consistent across a wide range of cell lengths. In the legend, the first and second modality for each color correspond to the measurements along the _y_- and _x_-axes, respectively. Black line is y = x. g In cell area measurements, differences in length between imaging modalities shown in (f) are exacerbated due to width-dependent offsets in cell widths between imaging modalities, as shown in (d)
Fig. 2
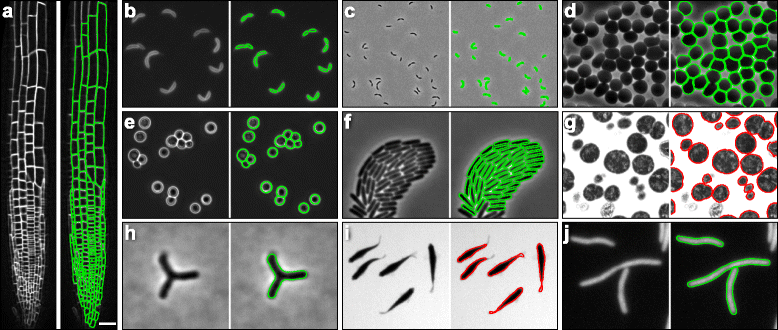
Morphometrics achieves unbiased contour extraction across a wide range of cell shapes and object types, including densely packed communities and tissues. a Contours extracted from the root-tip cells of an A. thaliana plant expressing a YFP-fusion to the membrane protein LTI6B, showing that Morphometrics is capable of segmentation of a complex tissue. Scale bar: 15 μm. b, c Contours extracted in PF mode (b) or PC mode (c) from FM4-64-labeled C. crescentus cells. d Contours extracted in PC from approximately spherical hypotonic red blood cells. e Contours extracted in PC from the budding yeast S. cerevisiae. f Contours extracted in PC from a densely packed P. aeruginosa community. g Contours extracted from transmission electron microscopy images of N. gonorrhoeae. h Contours extracted in PC from branched B. bifidum DSM20213 cells. i Contours extracted from bright-field microscopy of live zebrafish Danio rerio. j Contours extracted in IF from filamentous E. coli expressing cytoplasmic GFP
Fig. 3
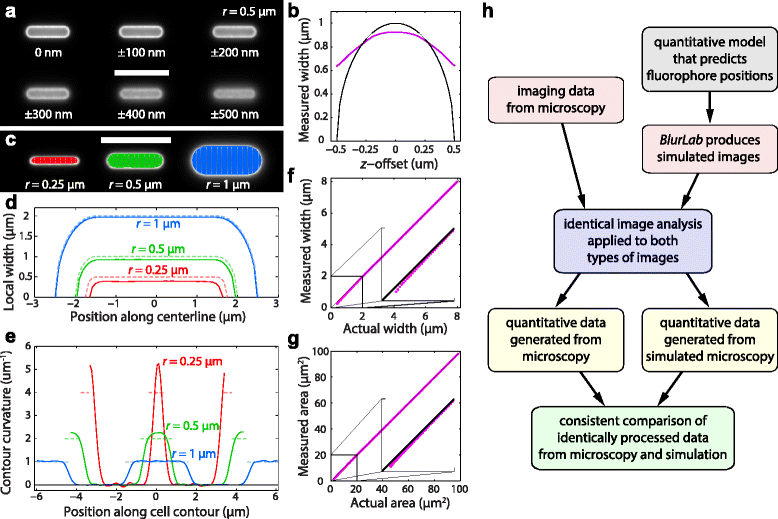
Simulated fluorescence images permit quantification of the accuracy of cell-geometry measurements. a Simulated fluorescence images of uniform surface labeling of an in silico cell with width 2_r_ = 1 μm and length 4 μm. The focal plane of each image relative to the cell midplane is indicated. Scale bar: 5 μm. b The measured width (magenta) of the middle cell in (a) at different offsets relative to the midplane, does not vary as strongly as the actual width (black) at that focal plane. c-e BlurLab permits the precise quantification of errors in geometry measurements from extracted contours and meshlines (c), width profiles (d), and curvature profiles (e) for cells of different radii r. Scale bar in (c): 5 μm. The colors of the meshlines in (c) are maintained in (d, e). Dashed curves in (d, e) are the actual values for the in silico cells. (f, g) Width (f) and area (g) display a systematic bias for narrow cells relative to the lines of equal measured and actual area (black). This bias is negligible for cells with width above ~1.5 μm. h Conceptual flow chart of the utility of BlurLab for quantitative comparison of experimental and simulated images to test the validity of an underlying model (here, measurements of cell size and geometry)
Fig. 4
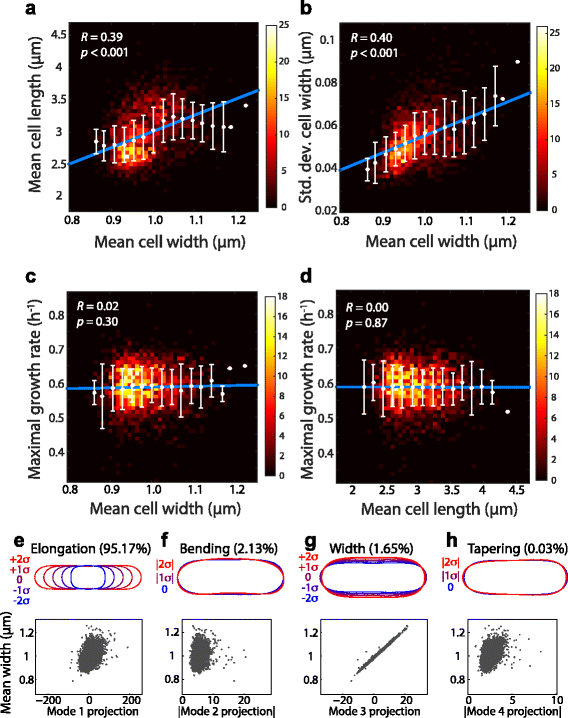
Morphological analysis of the Keio collection reveals correlations between morphological features but not with growth rate. Contours from >150 cells per Keio deletion strain were extracted from images acquired from the NBRP repository and used to compute the mean length and width and standard deviation of cell width across each population. In (a-d), white circles and error bars were obtained by binning strains by mean width or length; blue lines are the fit to binned averages. R is Pearson’s correlation coefficient. a-b Heatmaps of the number of strains with geometry parameters in each bin show that mean length (a) and standard deviation of mean width (b) are positively correlated with mean width. c-d Neither mean width (c) nor mean length (d) are correlated with maximal growth rate, as measured from microplate growth curves in [41]. e-h Top: Representations of the PCA modes around the mean shape. Modes 1–4 represent elongation, bending, width, and tapering, respectively. Bottom: scatter plots of the proportion of modes 1–4 and mean cell width of each strain demonstrate that width is correlated with variation represented by modes 1, 3, and 4
Fig. 5
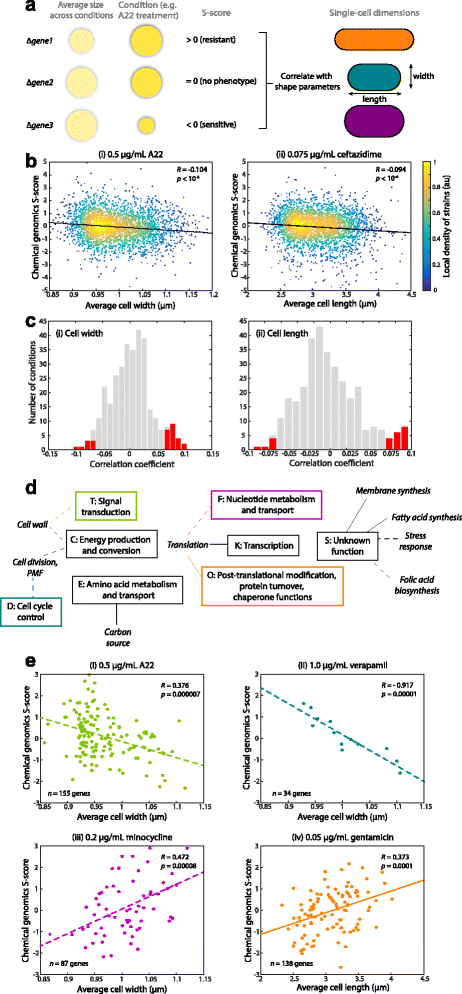
Morphological parameters predict certain chemical sensitivities. (a) Schematic of S-score interpretation and strategy for correlating with cell-shape parameters. Gene-condition pairs that result in bigger (smaller) colonies, normalized to the size of a wild-type colony in the same condition, than expected based on average size across all conditions have positive (negative) S-scores. (b) (i) After 0.5 μg/mL A22 treatment, S-scores of Keio-collection knockouts were negatively correlated with mean cell width across populations of cells of each strain, indicating that wider strains are generally more sensitive to A22. (ii) S-scores after treatment with 0.075 μg/mL ceftazidime, a cephalosporin division inhibitor, were negatively correlated with cell length, indicating that longer cells are more sensitive to ceftazidime. _p_-values computed with Student’s t-test. (c) The distribution of correlation coefficients with (i) mean cell width and (ii) length across the 324 conditions screened in [29]. Red bars highlight conditions with statistically significant correlations, Bonferroni corrected for multiple hypothesis testing. (d) Connections between Clusters of Orthologous Groups (COGs) and drugs that target particular processes. A connection is defined by a statistically significant correlation between cell width (dashed lines) or length (solid lines) and S-scores for knockouts of genes within the COG class indicated in the rectangles. (e) Examples of COG-specific correlations, with the colors of the dots and best-fit line the same as the appropriate COG rectangle in (d). _p_-values computed with Student’s _t_-test. (i) Sensitivity to 0.5 μg/mL A22 is negatively correlated with cell width in knockouts of genes related to signal transduction. (ii) Sensitivity to 1.0 μg/mL verapamil (calcium channel blocker) is negatively correlated with cell width in knockouts of genes related to the cell cycle. (iii) Sensitivity to 0.2 μg/mL minocycline (protein synthesis inhibitor) is positively correlated with cell width in knockouts of genes related to nucleotide metabolism and transport. (iv) Sensitivity to 0.05 μg/mL gentamycin (protein synthesis inhibitor) is positively correlated with cell length in knockouts of genes related to post-translational modification, protein turnover, chaperone functions
Similar articles
- Genomewide phenotypic analysis of growth, cell morphogenesis, and cell cycle events in Escherichia coli.
Campos M, Govers SK, Irnov I, Dobihal GS, Cornet F, Jacobs-Wagner C. Campos M, et al. Mol Syst Biol. 2018 Jun 25;14(6):e7573. doi: 10.15252/msb.20177573. Mol Syst Biol. 2018. PMID: 29941428 Free PMC article. - Array-based synthetic genetic screens to map bacterial pathways and functional networks in Escherichia coli.
Babu M, Gagarinova A, Emili A. Babu M, et al. Methods Mol Biol. 2011;781:99-126. doi: 10.1007/978-1-61779-276-2_7. Methods Mol Biol. 2011. PMID: 21877280 - Bacteria Getting into Shape: Genetic Determinants of E. coli Morphology.
French S, Côté JP, Stokes JM, Truant R, Brown ED. French S, et al. mBio. 2017 Mar 7;8(2):e01977-16. doi: 10.1128/mBio.01977-16. mBio. 2017. PMID: 28270582 Free PMC article. - Translational Metabolomics of Head Injury: Exploring Dysfunctional Cerebral Metabolism with Ex Vivo NMR Spectroscopy-Based Metabolite Quantification.
Wolahan SM, Hirt D, Glenn TC. Wolahan SM, et al. In: Kobeissy FH, editor. Brain Neurotrauma: Molecular, Neuropsychological, and Rehabilitation Aspects. Boca Raton (FL): CRC Press/Taylor & Francis; 2015. Chapter 25. In: Kobeissy FH, editor. Brain Neurotrauma: Molecular, Neuropsychological, and Rehabilitation Aspects. Boca Raton (FL): CRC Press/Taylor & Francis; 2015. Chapter 25. PMID: 26269925 Free Books & Documents. Review. - [Aiming for zero blindness].
Nakazawa T. Nakazawa T. Nippon Ganka Gakkai Zasshi. 2015 Mar;119(3):168-93; discussion 194. Nippon Ganka Gakkai Zasshi. 2015. PMID: 25854109 Review. Japanese.
Cited by
- The role of cell-envelope synthesis for envelope growth and cytoplasmic density in Bacillus subtilis.
Kitahara Y, Oldewurtel ER, Wilson S, Sun Y, Altabe S, de Mendoza D, Garner EC, van Teeffelen S. Kitahara Y, et al. PNAS Nexus. 2022 Jul 26;1(4):pgac134. doi: 10.1093/pnasnexus/pgac134. eCollection 2022 Sep. PNAS Nexus. 2022. PMID: 36082236 Free PMC article. - Bacterial Filamentation Drives Colony Chirality.
Aranda-Díaz A, Rodrigues C, Grote A, Sun J, Schreck C, Hallatschek O, Souslov A, Möbius W, Huang KC. Aranda-Díaz A, et al. mBio. 2021 Dec 21;12(6):e0154221. doi: 10.1128/mBio.01542-21. Epub 2021 Nov 2. mBio. 2021. PMID: 34724813 Free PMC article. - Cell envelope growth of Gram-negative bacteria proceeds independently of cell wall synthesis.
Oldewurtel ER, Kitahara Y, Cordier B, Wheeler R, Özbaykal G, Brambilla E, Boneca IG, Renner LD, van Teeffelen S. Oldewurtel ER, et al. EMBO J. 2023 Jul 17;42(14):e112168. doi: 10.15252/embj.2022112168. Epub 2023 Jun 1. EMBO J. 2023. PMID: 37260169 Free PMC article. - Precise regulation of the relative rates of surface area and volume synthesis in bacterial cells growing in dynamic environments.
Shi H, Hu Y, Odermatt PD, Gonzalez CG, Zhang L, Elias JE, Chang F, Huang KC. Shi H, et al. Nat Commun. 2021 Mar 30;12(1):1975. doi: 10.1038/s41467-021-22092-5. Nat Commun. 2021. PMID: 33785742 Free PMC article. - Comprehensive double-mutant analysis of the Bacillus subtilis envelope using double-CRISPRi.
Koo BM, Todor H, Sun J, van Gestel J, Hawkins JS, Hearne CC, Banta AB, Huang KC, Peters JM, Gross CA. Koo BM, et al. bioRxiv [Preprint]. 2024 Aug 16:2024.08.14.608006. doi: 10.1101/2024.08.14.608006. bioRxiv. 2024. PMID: 39185233 Free PMC article. Preprint.
References
MeSH terms
LinkOut - more resources
Full Text Sources
Other Literature Sources
