Extracellular Signals Induce Glycoprotein M6a Clustering of Lipid Rafts and Associated Signaling Molecules - PubMed (original) (raw)
Extracellular Signals Induce Glycoprotein M6a Clustering of Lipid Rafts and Associated Signaling Molecules
Atsuko Honda et al. J Neurosci. 2017.
Abstract
Lipid raft domains, where sphingolipids and cholesterol are enriched, concentrate signaling molecules. To examine how signaling protein complexes are clustered in rafts, we focused on the functions of glycoprotein M6a (GPM6a), which is expressed at a high concentration in developing mouse neurons. Using imaging of lipid rafts, we found that GPM6a congregated in rafts in a GPM6a palmitoylation-dependent manner, thereby contributing to lipid raft clustering. In addition, we found that signaling proteins downstream of GPM6a, such as Rufy3, Rap2, and Tiam2/STEF, accumulated in lipid rafts in a GPM6a-dependent manner and were essential for laminin-dependent polarity during neurite formation in neuronal development. In utero RNAi targeting of GPM6a resulted in abnormally polarized neurons with multiple neurites. These results demonstrate that GPM6a induces the clustering of lipid rafts, which supports the raft aggregation of its associated downstream molecules for acceleration of neuronal polarity determination. Therefore, GPM6a acts as a signal transducer that responds to extracellular signals.SIGNIFICANCE STATEMENT Lipid raft domains, where sphingolipids and cholesterol are enriched, concentrate signaling molecules. We focused on glycoprotein M6a (GPM6a), which is expressed at a high concentration in developing neurons. Using imaging of lipid rafts, we found that GPM6a congregated in rafts in a palmitoylation-dependent manner, thereby contributing to lipid raft clustering. In addition, we found that signaling proteins downstream of GPM6a accumulated in lipid rafts in a GPM6a-dependent manner and were essential for laminin-dependent polarity during neurite formation. In utero RNAi targeting of GPM6a resulted in abnormally polarized neurons with multiple neurites. These results demonstrate that GPM6a induces the clustering of lipid rafts, which supports the raft aggregation of its associated downstream molecules for acceleration of polarity determination. Therefore, GPM6a acts as a signal transducer that responds to extracellular signals.
Keywords: GPM6a; cholesterol; growth cone; lipid rafts; palmitoylation; polarity.
Copyright © 2017 the authors 0270-6474/17/374046-19$15.00/0.
Figures
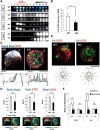
Figure 1.
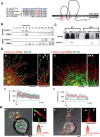
Palmitoylation of GPM6a is necessary for its enrichment in lipid rafts. A, Left, Alignment of amino acids in the first intracellular segment of mouse (Ms) and human (Homo sap) GPM6a and its homologs. Conserved cysteines that are mutated to serine in the mouse Δpal-GPM6a mutant (top) are indicated in red. Right, Diagram of mouse GPM6a, showing the location of its palmitoylation sites at C17, C18, and C21 (red). B, GPM6a is localized in cholesterol-rich DRM fractions. E14.5 mouse brain homogenates were treated with 1% Brij98 and DRMs were fractionated using sucrose gradient centrifugation. In the control, GPM6a and a DRM marker flotillin 1 were colocalized in fractions #4 to #6. Colocalization of GPM6a and flotillin 1 in these fractions was inhibited by removal of cholesterol by MβCD treatment (+M_β_CD). C, Defective palmitoylation resulted in the exclusion of GPM6a from the DRM fraction. Neuro2a cells with overexpressed WT-GPM6a (WT) or Δpal-GPM6a [mutated at C17S, C18S, and C21S (C17, 18, 21S); Δ_pal_] were lysed and fractionated into DRM or non-DRM fractions. Loss of palmitoylation inhibited the localization of GPM6a into the DRM fractions. D, E, Overexpressed GPM6a in COS-7 cells (D) and in GPM6a-KO cortical neurons (E) assembles cholesterol at the tips of GPM6a-induced filopodia via its palmitoylation. The live cells were labeled with EGFP-D4, a live-imaging marker for cholesterol-rich membrane domains. EGFP-D4 on the cell surface and the localization of overexpressed mCherry-GPM6a were observed using immunofluorescence. Da–Dc, Ea, Eb, mCherry-tagged WT-GPM6a. Dd–Df, Ec, Ed, Δpal-GPM6a. Db, De, Eb, Ed, Magnified views of the white boxes (Da and De and Ea and Ec, respectively). Shown is the quantitative distribution of the fluorescence intensities of WT-GPM6a (Dc) or Δpal-GPM6a (Df): red, D4: green). Measurements were performed within 5 μm from a filopodial tip. n = 10 for each (means ± SD). EGFP-D4 was assembled on the tip of filopodia induced only by WT-GPM6a (arrows in Db, De, Eb, Ed). In E, the diagrams depict the colocalization of D4 and WT-GPM6a but the lack of colocalization of Δpal-GPM6a and D4. Therefore, in Δpal-GPM6a-transfected cells, D4 was diffusely distributed and was not concentrated around Δpal-GPM6a. Scale bars: Da, Db, Dd, De, 10 μm; Ea-Ed, 2 μm.
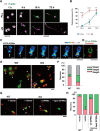
Figure 2.
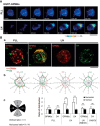
GPM6a assembles and clusters cholesterol via its palmitoylation. A, GPM6a and D4 are synchronously distributed on the membrane. Aa, Sixteen sequential images (1 min per frame) of an EGFP-D4 (green)-labeled COS-7 cell expressing mCherry-WT- or Δpal-GPM6a (red). Arrowheads indicate filopodia protruding sites. Scale bar, 5 μm. Ab, Quantitative correlation of EGFP-D4 fluorescent intensities with those of mCherry-wt- (filled diamonds) or Δpal-GPM6a (open diamonds) in Aa. The regression lines and formulas are shown. Ac, Chronological changes in the distribution area of EGFP-D4 (black) and in the correlation index between GPM6a and D4 (red). These changes were synchronized in the cells expressing mCherry-wt- GPM6a (solid line), but not in cells expressing Δpal-GPM6a (dotted line). Arrowheads indicate the time at which the filopodia protruded in Aa. B, Cell-surface distribution of WT-GPM6a or ΔPal-GPM6a expressed in COS-7 cells. To observe GPM6a on the specifically cell surface, the cells were fixed but not permeabilized and immunostained with an anti-GPM6a, and Ab with an epitope that is within the extracellular domain of GPM6a. The WT-GPM6a was specifically localized on the surface of filopodia (arrow), but ΔPal-GPM6a was more broadly distributed. Scale bar, 20 μm.
Figure 3.
Asymmetrical assembly of GPM6a induced by LN and its effects on clustering of the cholesterol-rich membrane domain. A, Time-lapse imaging of EGFP-GPM6a overexpressed in E16 cortical neurons over 2 h after plating. The fluorescence intensities of EGFP-GPM6a are shown as pseudocolors. Note that EGFP-GPM6a was asymmetrically assembled at 1 h after plating of the neurons on LN, but not on PLL. Scale bar, 20 μm. B, Correlation between the localization of GPM6a and cholesterol-rich membrane domains. Ba, mCherry-tagged WT-GPM6a (wt GPM6a; red) was overexpressed in GPM6a-KO cortical neurons and was plated on PLL or LN in the absence or presence of MβCD. Before plating, these unfixed GPM6a-overexpressing cells or the nontransfected GPM6a-KO cells were labeled with EGFP-D4 (green). At 1 h after plating the distribution of mCherry-GPM6a and EGFP-D4 was observed. Bb, Cumulative angular probability distribution of mCherry-GPM6a (red) and EGFP-D4 (green) in the cortical neurons (see Materials and Methods). Bc, Ratios of the fluorescence intensities for GPM6a and D4 in the areas of the vertical (I to II) or horizontal axes (III to IV) are shown. The section of the highest intensity was defined as 0 degrees. In Bb and Bc, asymmetric localization of mCherry-GPM6a and EGFP-D4 was specifically observed in neurons on LN and was inhibited by either the depletion of cholesterol (MβCD) or by the lack of GPM6a expression (GPM6a-KO), respectively. Scale bar, 10 μm. Data are shown as means ± SD (n = 20; two-tailed t test; vertical vs horizontal; LN-GPM6a, 2.59 ± 0.52 vs 1.10 ± 0.21; LN-D4, 2.96 ± 0.62 vs 1.08 ± 0.16). ***p < 0.001.
Figure 4.
Asymmetric localization of GPM6a at stage 1 is before that of Par3. A, LN induced the asymmetric localization of GPM6a but not of Par3 in stage 1 neurons. Immunofluorescence analysis of the localization of endogenous GPM6a (red) and Par3 (green) in cortical neurons cultured on PLL or LN 30 min after plating (stage 1). GPM6a but not Par3 was asymmetrically localized at this stage. Scale bars, 10 μm. B, C, Cumulative angular probability distribution of the immunofluorescence of GPM6a (red) and Par3 (green) that is shown in A in stage 1 cortical neurons on PLL (blue) or LN (red).
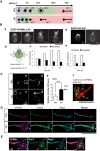
Figure 5.
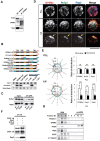
GPM6a-RUFY3-Rap2-STEF/Tiam2 forms a protein complex that is enriched in lipid rafts. A, Immunoprecipitation (IP) of the Triton X-100 extracts of growth cone (GC) fractions using an anti-GPM6a Ab. The blots were immunostained with Abs against GPM6a, Rufy3, and Rap2. The RUN domain protein Rufy3 and a small GTPase, Rap2, were coprecipitated with GPM6a, suggesting the presence of a GPM6a-Rufy3-Rap2 ternary complex in vivo. B, Identification of the Rufy3-binding region of GPM6a using GPM6a mutants. Top, To maintain the four-transmembrane domain in the mutants, chimeras of GPM6a and DM20, another member of the PLP family, were constructed. The fragments derived from GPM6a (orange) were joined with those from DM20 (blue). The amino acid numbers of GPM6a and DM20 are shown in red and blue respectively. Transmembrane domains are shown in black. (See Sato et al., 2011). Bottom, Constructs containing EGFP-tagged full-length GPM6a (aa 1–278), Δpal-GPM6a, chimeras, or a C_-terminus deletion (aa 1–237) were coexpressed with myc-Rufy3 in COS-7 cells. Lysates were immunoprecipitated with an anti-myc antibody. The input was Western blotted with an anti-myc (Rufy3, bait) or an anti-GFP antibody (input) and the immunoprecipitate (pull-down) was Western blotted using an anti-EGFP (input) and myc Abs (bait). The Rufy3-binding site of GMP6a was determined as being located within GPM6a aa 185–278. C, Characterization of Rap2 binding to Rufy3. FLAG-tagged Rap2, the GDP-binding DN form (S17N), or the GTP-binding CA form (V12G) was preincubated with EGFP-Rufy3. EGFP-Rufy3 was immunoprecipitated with an anti-EGFP Ab and coprecipitated Rap2 was detected by Western blotting with anti-FLAG. The GDP-bound form of Rap2 lost the ability to bind Rufy3. D, GPM6a, Rufy3, and Rap2 are colocalized in cortical neurons grown on LN 30 minutes after plating of cortical neurons on LN but not on PLL. Iimmunofluorescence analysis indicated that the asymmetrically assembled endogenous GPM6a (red) was colocalized with endogenous Rufy3 (green) and Rap2 (blue). Arrows indicate their cellular accumulation sites. Scale bar, 20 μm. E, Left, Cumulative angular probability distribution of fluorescence of the GPM6a (red), Rufy3 (green), and Rap2 (blue) in Figure 3_D. Right, Ratio of the fluorescence intensities of GPM6a, Rufy3, and Rap2 on the vertical or horizontal axis is shown. Asymmetric localization of each protein was specifically observed in neurons on LN. Data are shown as means ± SD (n = 20 for each; two-tailed t test, vertical vs horizontal; LN-GPM6a, 2.90 ± 0.79 vs 1.07 ± 0.20; LN-Rufy3, 2.17 ± 0.47 vs 1.03 ± 0.18; LN-Rap2, 2.70 ± 0.56 vs 1.06 ± 0.19). ***p < 0.001. F, GTP-bound Rap2 specifically interacts with the Rac1 GEF Tiam2/STEF. HA-STEF was preincubated with FLAG-Rap2 in the presence of GTPγ with FLAG. HA-STEF was immunoprecipitated using an anti-HA antibody and coprecipitated Rap2 was detected by blotting with an anti-FLAG Ab. G, The complex components downstream of GPM6a were distributed in the DRM. Mouse brains were lysed and subjected to a sucrose density gradient and collected fractions were Western blotted for the indicated proteins. The DRM marker flotillin 1 was detected in fractions #4 to #6; GPM6a, Rap2, STEF, and β1 integrin (a LN receptor) were enriched in DRMs and Rufy3 was also found in these fractions.
Figure 6.
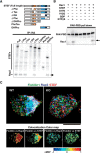
Interaction of Rap2-Tiam2/STEF activates the Rac1 GEF activity of Tiam2/STEF and these signaling proteins colocalize with flotillin1 via GPM6a. A, Rap2-binding sites in Tiam2/STEF. Top, HA-tagged mutants of Tiam2/STEF used for the Rap2 binding assay. Bottom, Determination of the Rap2-binding domain of Tiam2/STEF for Rac1 activation. Full-length or deletion mutants of HA-STEF were coexpressed with Flag-Rap2 in COS-7 cells. Cell lysates were immunoprecipitated with anti-HA antibody, followed by immunoblotting with anti-Flag and anti-HA antibodies. Flag-Rap2 that coprecipitated with HA-STEF is indicated by an arrow. B, GTP-Rap2 activated the Rac1-GEF activity of Tiam2/STEF. Myc-tagged Rac1 was preincubated with either DN (S17) or CA (V12) Rap2 and HA-STEF. Activated Rac1 was pulled down using PAK-PBD immobilized to beads and was analyzed using Western blotting (arrow). C, Representative triple immunostaining of the localization of endogenous flotillin1 (green), Rap2 (blue), and Tiam2/STEF (red) in WT or GPM6aKO cortical neurons. nMDP values (see also Fig. 7_D_ and Materials and Methods) indicate that flotillin1 colocalized with Rap2 or Tiam2/STEF in the WT neuron, but not in the GPM6aKO neuron. Scale bar, 10 μm.
Figure 7.
Loss of GPM6a disrupts the assembly of both the downstream proteins of GPM6a and the cholesterol-rich membrane domain. A, Distribution of Rap2, Rufy3, and Tiam2/STEF in the DRM fraction of WT or GPM6a-KO mouse brains as assessed using Western blotting. GM1 ganglioside was labeled using CtxB as a lipid raft marker. Concentrations are shown using pseudocolor images. B, Quantification of STEF expression in DRM fractions of WT and GPM6a-KO cells (see A). Data are shown as means ± SD % (n = 5; two-tailed t test; WT 9.776 ± 1.78 vs GPM6a-KO 5.6 ± 1.44). ***p < 0.001. C, Immunofluorescent staining of endogenous Tiam2/STEF (red), Rap2 (green), and Rufy3(blue) in WT and GPM6a-KO cortical neurons at 30 min after plating on LN (top, bar, 10 μm). The detailed fluorescent profiles of each fluorescent image along the lines I-II are shown (bottom). D, Colocalization of endogenous Rufy3 and Rap2, Rap2 and Tiam2/STEF, or Rufy3 and STEF in the WT and GPM6a-KO neurons are shown as the mean correlation index (_I_corr, top) and the color map of the nMDP (bottom). The fluorescent punctate pattern of Tiam2/STEF, Rap2, and Rufy3 staining was asymmetrically and synchronously distributed in WT neurons, but not in GPM6a-KO neurons. ***p < 0.001. E, Correlation between the clustering of EGFP-D4 labeling and the asymmetric assembly of Tiam2/STEF. Top, Either WT or GPM6a-KO cortical neurons were grown on LN for 30 min and live cells were then stained with EGFP-D4 (green). The cells were then fixed, permeabilized, and immunostained with anti-Tiam2/STEF antibodies (red). Scale bar, 10 μm. Bottom, Cumulative angular probability distribution of the fluorescence of Tiam2/STEF (red) and D4 (green) in the top panels. F, Ratio of the fluorescence intensities of Tiam2/STEF and D4 on vertical or horizontal axes is shown. The fluorescence of Tiam2/STEF and D4 show asymmetric and synchronous localization in WT, but not in GPM6a-KO cortical neurons. Data are shown as means ± SD (n = 20 for each; two-tailed t test; vertical vs horizontal; Tiam2/STEF in WT 2.89 ± 0.59 vs 1.19 ± 0.36; D4 in WT 3.85 ± 1.33 vs 1.22 ± 0.59). ***p < 0.001.
Figure 8.
Palmitoylation of GPM6a is essential for stage 1 neuronal polarity determination facilitated by LN. A, B, Comparison of the effects of LN (bottom) and PLL (top) on the time course of neuronal polarity determination. A, Neurons derived from mouse cortices were cultured on PLL or LN for 4, 16, or 72 h. The plasma membrane (magenta) and F-actin (green) were stained using DiI and phalloidin, respectively. A single neurite that eventually became an axon was observed; however, such a neuron was protruded after only 4 h on LN, but was not protruded after 4 h on PLL. Note that the neurons on LN skip the multipolar stage known as stage 2. B, Time-dependent changes in the percentage of polarized neurons on LN or PLL. Neurons with a major neurite that was at least twice as long as the other neurites were deemed polarized neurons. The proportions of polarized neurons on LN versus PLL were significantly different at all time points (****p < 0.0001 at 16 or 48 h; **p < 0.01 at 72 h). Two-way factorial ANOVA with Tukey's multiple-comparisons test; data points are means ± SD % (n = 100 from five distinct preparations). C, Time-lapse imaging over 12 h of the localization of EGFP-GPM6a expressed in mouse cortical neurons on LN. The fluorescence intensities of EGFP-GPM6a are shown as a pseudocolor. A single neurite protruded from the hot spot area of EGFP-GPM6a (arrow). EGFP-GPM6a was continuously localized at the growth cone (arrowheads). D, Growth cone (arrowhead) protruded from the GPM6a-enriched membrane area (arrow) in cortical neurons cultured for 30 min on LN. The cells were stained with the GPM6a Ab (extracellular epitope) (green) and phalloidin (red) without and with membrane permeabilization, respectively. Scale bars, 20 μm. E, F, Determination of neuronal polarity on LN was inhibited in GPM6a-KO cortical neurons. E, Representative neurons from WT or GPM6a-KO mice that were plated on LN for 4 h. Arrowheads indicate neurites. Note that the GPM6a-KO neurons had multiple neurites, but that the WT neurons had a single neurite. Fixed neurites were permeabilized and stained for F-actin using phalloidin (red) and for microtubules using tubulin βIII Ab (green). Scale bar, 20 μm. F, Percentage of neurons at stage 1, 2, or 3 in neurons from WT or GPM6a-KO mice that were plated on LN. Categorization of the stage of cortical neuron formation at 4 h after plating as stage 1 (gray), stage 2 (blue), and stage 3 neurons (red) was based upon their cell polarity (n = 50 neurons for each different group). One-way ANOVA data with Tukey's multiple-comparisons test (mean ± SD %; stage 3 neurons: LN-wt 46.2 ± 4.2 vs LN-M6aKO 18.3 ± 3.4). ****p < 0.0001. G, H, Neuronal cell polarity rescue experiment in GPM6a-KO neurons. EGFP-tagged WT-GPM6a or Δ_pal_-GPM6a was transfected into GPM6a-KO cortical neurons. G, Neurons were observed at 72 h after plating on PLL or LN. The cortical neurons were stained for F-actin using phalloidin (red) and for EGFP using anti-EGFP Ab (green). Arrows indicate axons. EGFP-tagged GPM6a rescued neurite formation, whereas the mutant GPM6a lacked the ability to rescue neurite formation in GPM6a-KO neurons. Scale bar, 20 μm. H, Cortical neurons derived from WT or GPM6a-KO mice after plating on LN were classified according to their polarity (Fig. 5_F_) and the percentage of each type is shown (n = 50 neurons for each different group; percentage of polarized neurons; values are means ± SD). We compared four groups: WT neurons + vector (EGFP), GPM6-KO neurons + vector (EGFP), GPM6a-KO neurons + EGFP-GPM6a, and GPM6a-KO neurons + EGFP-Δpal GPM6a. Data (percentages of the stage 3 neurons) were analyzed using a one-way ANOVA with Tukey's multiple-comparisons test (n = 50 neurons in each different group; percentage of polarized neuron; means ± SD; WT + vector 90.1 ± 3.3 vs GPM6a-KO + vector 25.0 ± 16.6, ***p < 0.001; GPM6a-KO + vector vs GPM6a-KO + GPM6a 77.2 ± 6.8, *p < 0.05; WT + vector vs GPM6a-KO + ΔPal-GPM6a 9.7 ± 8.7, ****p < 0.0001; GPM6a-KO + GPM6a vs GPM6a-KO + ΔPal-GPM6a, ***p < 0.001).
Figure 9.
Polarity determination of stage 1 of neuronal formation is facilitated in neurons plated on LN; GPM6a, cholesterol, and the GPM6a-downstream signaling complex are enriched at the growth cone. A, Schematic models of the neuronal polarity determination time course in neurons plated on PLL or LN. The diagrams show the representative neuron shapes at each time point. Developmental stages of the neurons were morphologically defined according to Dotti's definition (Dotti et al., 1988); i.e., stage 1: cells with no neurite (gray); stage 2, multipolar cells (green); and stage 3: polarized cells (pink). In the cells plated on PLL, the neuronal stage changed from 1 to 2 four hours after plating. The neurons continued in stage 2 for up to 48 h. Between 48 and 72 h, the stage of the neurons changed from stage 2 to stage 3. In the cells plated on LN, the neurons dramatically changed from stage 1 to stage 3 between 1 and 4 h after plating and remained in stage 3 thereafter. B, Growth cone was protruded from the GPM6a- and cholesterol-enriched membrane area. Ba, Fluorescence images of EGFP-WT GPM6a in the neuron at 1, 2, 4, or 12 h after plating on LN. Scale bar, 20 μm. Bb, Image of each neuron was divided into six areas of 60 degrees (see also the radial grid in Ba), with the protruding site, or the neurite, defined as 0 degrees. A vertical line was drawn from the protruding site. A horizontal line that intersected the vertical line at the center of the cell was also drawn. The protruding area and the area directly opposite, which were bisected by the vertical line, were defined as areas I and II. The areas bisected by the horizontal line were defined as areas III and IV. Bc, Ratios of the fluorescence intensity of EGFP-WT-GPM6a in the vertical (open bars) and horizontal (filled bars) areas were calculated. Bd, Images of GFP-D4 labeling of the neuron at 2 or 4 h after plating on laminin were divided as described in Bb. Scale bar, 20 μm. Be, Ratios of the fluorescence intensity of GFP-D4 in the vertical (open bars) or horizontal (filled bars) areas were calculated. See also Figure 2_B_ at stage 1. C, GPM6a accumulated in the growth cone at stage 3 on LN. Representative immunostained images of endogenous GPM6a in stage 3 neurons plated on PLL (Ca, Cb) or LN (Cc, Cd). Cell bodies and growth cones are indicated using asterisks and arrows, respectively. Cb, Cd, Higher-magnification images of the growth cones in the boxed areas in Ca and Cc, respectively. Scale bars: Ca, Cc, 50 μm; Cb, Cd, 20 μm. Ce, Ratio of the immunofluorescence intensity of GPM6a in the growth cone versus that of the axon. Note that GPM6a significantly accumulates in the growth cone at stage 3 in the presence of LN (n = 20). Two-tailed t test, ****p < 0.0001. Cf, Colocalization of GPM6a and cholesterol-rich membrane domains at the growth cone of neurons on LN. GPM6aKO cortical neurons overexpressing mCherry-WT-GPM6a (red) were cultured on LN for 3 d and were then stained live with EGFP-D4 (green) on LN. GC, Growth cone. Scale bar, 5 μm. D, Immunofluorescently stained endogenous GPM6a (magenta), Rufy3 (green), and Rap2 (blue) were colocalized at the peripheral (P) domain of the growth cone at stage 3 in neurons plated on LN, but not in neurons plated on PLL. The ternary complex accumulated (arrows) near the growth cone plasma membrane. Scale bar, 5 μm. E, Par3 is concentrated in the growth cone at stage 3 in GPM6a- and LN-dependent polarized neurons. Par3 (green) is colocalized with GPM6a (magenta) and Rap2 (blue), particularly in the leading edge of the growth cone (arrows; see the rightmost view, merged). Scale bar, 10 μm.
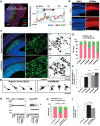
Figure 10.
GPM6a is involved in the formation of polarized axons in vivo. A, Localization of LN in the IZ of mouse embryonic brain. Left, Distribution of β2-LN (also called S-LN; red) and GFP-positive neurons (green) in a representative E16 coronal brain section. Nuclei were stained with DAPI (blue). Right, Fluorescence intensity profiles of anti-β2-LN Ab in each area in the E16 coronal brain sections in the boxed areas in the photograph are indicated. Average intensities of anti-β2-LN Ab immunofluorescence are shown. B, Immunohistochemical analysis of GPM6a in embryonic brain. GPM6a immunoreactivity (red) was mainly localized in the IMZ at stage E15 and in the cortical plate at stage E16. Nuclei are stained with DAPI (blue). C, D, RNAi of GPM6a using in utero electroporation of shRNA against GPM6a or one of two negative control shRNA plasmids (Bsm) in mice at the developmental stage of E16. C, Left, Low magnifications of representative immunofluorescent staining of morphological transitions in E16 coronal brain sections of mice. Neurons were stained with DAPI (blue) and anti-EGFP (green) to visualize the RNAi-introduced neurons more clearly. Morphological transition was impaired by GPM6a-KD. Middle, Higher magnification of the representative morphological transition focusing on the IZ that was impaired by GPM6a-KD (top, negative control, N.C., Bsm; bottom, shGPM6a#8). Arrows indicate the neurons drawn in D (see below). Right, Drawings of representative neurons in the middle panels. Scale bar, 50 μm. D, Magnified drawing of several typical neurons in the middle panels of C. E, F, Quantitative analysis of the effect of negative controls (Bsm, shNeg) and shGPM6a (#5, #7, and #8) on neuronal morphology (classified as having unipolar/bipolar or multipolar morphology) (E) and the number of neurites in the IZ (F). **p < 0.05, ****p < 0.0001 versus negative control (N.C.; Bsm) using one-way ANOVA. More than 100 EGFP-positive neurons from three to four brains were examined in each group. The data represent means ± SEM. There was rarely an effect of either of the two negative controls, the shNeg (including a nontarget sequence under the U6 promoter) and the Bsm (without shRNA-expression sequence under the U6 promoter, only restriction enzyme-targeting sequence), on the neurons. The shGPM6a#8 induced and the shGPM6a#5 had a tendency to induce multipolar cells or increase the number of neurites. G, Efficiency of each shRNA vector was examined by immunoblotting of the expression of EGFP-GPM6a transfected into COS-7 cells. The arrowhead indicates the position of GPM6a. α-tubulin was blotted as a loading control. H, I, RNAi and rescue experiment of GPM6a in vivo. The shGPM6a#8 and/or rescue-GPM6a expression vectors were electroporated into the cortex at E14, followed by fixation at E16. Quantitative analysis of RNAi and rescue effects on neuronal morphology (classified as having unipolar/bipolar or multipolar morphology) (H) and the number of neurites in the IZ (I) were measured (N.C., Bsm 85.8 ± 2.0 vs shGPM6a#8 45.4 ± 4.5, ***p < 0.001; shGPM6a#8 45.4 ± 4.5 vs shGPM6a#8 + rescue-WT-GPM6a 77.6 ± 3.6, **p < 0.005, one-way ANOVA). More than 100 EGFP-positive neurons from three to four brains were examined in each group. The data represent means ± SEM.
Figure 11.
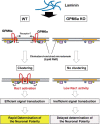
Scheme for the molecular mechanism of neuronal polarity determination in lipid raft-like membrane domains via the GPM6a protein. GPM6a (brown) is localized in cholesterol-enriched, lipid raft membrane domains (orange) through its palmitoylation (Fig. 1). Through its interaction with Rufy3 (green), GPM6a captures active Rap2 (blue) (Fig. 3_A–E_) that is bound to Rac1 GEF Tiam2/STEF (purple) (Fig. 5_F_), which contributes to stabilization of the distribution of the determinants of neuronal polarity (i.e., Tiam2/STEF, Rap2, Rufy3) in the lipid rafts (Fig. 7). Left, In WT neurons, extracellular LN induces asymmetrical assembly of GPM6a in membranes (Fig. 2_A_), perhaps through a LN-receptor such as integrin (Fig. 3_G_), resulting in extensive clustering of GPM6a in lipid rafts (Fig. 3_B_) and subsequent clustering of downstream signaling molecules of GPM6a (Figs. 5_D_, E, 8_C_, D). These proteins are synchronously assembled around the cluster of lipid rafts (Figs. 6_A_, 8_E_). Because activated Rap2 activates Tiam2/STEF, a Rac1-GEF (Fig. 6_B_, C), the assembled Rap2 and Tiam2/STEF may robustly activate Rac1 (arrow to yellow box) in this location. As a result, neuronal polarity is rapidly determined in the neurons grown on LN (Figs. 8_A_, B, D, E, 11_A_) and a single neurite is protruded from the GPM6a-assembled area (Fig. 8_C_). Right, In GPM6a-KO neurons, the downstream signaling molecules of GPM6a are dispersed within the membrane and are not concentrated in lipid rafts (Fig. 7_A_, B). LN induces neither clustering of cholesterol-enriched domains (Fig. 3_B_) nor the asymmetric localization of these proteins (Figs. 6_A_, 7_C_, D), which results in functionally inefficient signal transduction. Even if these neurons are grown on LN, the cells show a much lower ability to facilitate polarity determination (Fig. 8_E–H_).
Similar articles
- Glycoprotein M6a as a signaling transducer in neuronal lipid rafts.
Ito Y, Honda A, Igarashi M. Ito Y, et al. Neurosci Res. 2018 Mar;128:19-24. doi: 10.1016/j.neures.2017.11.002. Epub 2017 Nov 20. Neurosci Res. 2018. PMID: 29158160 Review. - Rufy3 is an adapter protein for small GTPases that activates a Rac guanine nucleotide exchange factor to control neuronal polarity.
Honda A, Usui H, Sakimura K, Igarashi M. Honda A, et al. J Biol Chem. 2017 Dec 22;292(51):20936-20946. doi: 10.1074/jbc.M117.809541. Epub 2017 Oct 31. J Biol Chem. 2017. PMID: 29089386 Free PMC article. - Neuronal glycoprotein M6a induces filopodia formation via association with cholesterol-rich lipid rafts.
Scorticati C, Formoso K, Frasch AC. Scorticati C, et al. J Neurochem. 2011 Nov;119(3):521-31. doi: 10.1111/j.1471-4159.2011.07252.x. Epub 2011 Apr 13. J Neurochem. 2011. PMID: 21426347 - Neuronal filopodium formation induced by the membrane glycoprotein M6a (Gpm6a) is facilitated by coronin-1a, Rac1, and p21-activated kinase 1 (Pak1).
Alvarez Juliá A, Frasch AC, Fuchsova B. Alvarez Juliá A, et al. J Neurochem. 2016 Apr;137(1):46-61. doi: 10.1111/jnc.13552. Epub 2016 Feb 22. J Neurochem. 2016. PMID: 26809475 - Lipid rafts as major platforms for signaling regulation in cancer.
Mollinedo F, Gajate C. Mollinedo F, et al. Adv Biol Regul. 2015 Jan;57:130-46. doi: 10.1016/j.jbior.2014.10.003. Epub 2014 Oct 27. Adv Biol Regul. 2015. PMID: 25465296 Review.
Cited by
- Phosphorylation of GAP-43 T172 is a molecular marker of growing axons in a wide range of mammals including primates.
Okada M, Kawagoe Y, Sato Y, Nozumi M, Ishikawa Y, Tamada A, Yamazaki H, Sekino Y, Kanemura Y, Shinmyo Y, Kawasaki H, Kaneko N, Sawamoto K, Fujii Y, Igarashi M. Okada M, et al. Mol Brain. 2021 Apr 8;14(1):66. doi: 10.1186/s13041-021-00755-0. Mol Brain. 2021. PMID: 33832520 Free PMC article. - Alanine Scanning Mutagenesis of the C-Terminal Cytosolic End of Gpm6a Identifies Key Residues Essential for the Formation of Filopodia.
Rosas NM, Alvarez Juliá A, Alzuri SE, Frasch AC, Fuchsova B. Rosas NM, et al. Front Mol Neurosci. 2018 Sep 4;11:314. doi: 10.3389/fnmol.2018.00314. eCollection 2018. Front Mol Neurosci. 2018. PMID: 30233315 Free PMC article. - Amphipathic Peptides Impede Lipid Domain Fusion in Phase-Separated Membranes.
Pinigin KV, Galimzyanov TR, Akimov SA. Pinigin KV, et al. Membranes (Basel). 2021 Oct 20;11(11):797. doi: 10.3390/membranes11110797. Membranes (Basel). 2021. PMID: 34832026 Free PMC article. - Glial M6B stabilizes the axonal membrane at peripheral nodes of Ranvier.
Bang ML, Vainshtein A, Yang HJ, Eshed-Eisenbach Y, Devaux J, Werner HB, Peles E. Bang ML, et al. Glia. 2018 Apr;66(4):801-812. doi: 10.1002/glia.23285. Epub 2017 Dec 28. Glia. 2018. PMID: 29282769 Free PMC article. - Methylome-wide association findings for major depressive disorder overlap in blood and brain and replicate in independent brain samples.
Aberg KA, Dean B, Shabalin AA, Chan RF, Han LKM, Zhao M, van Grootheest G, Xie LY, Milaneschi Y, Clark SL, Turecki G, Penninx BWJH, van den Oord EJCG. Aberg KA, et al. Mol Psychiatry. 2020 Jun;25(6):1344-1354. doi: 10.1038/s41380-018-0247-6. Epub 2018 Sep 21. Mol Psychiatry. 2020. PMID: 30242228 Free PMC article.
References
MeSH terms
Substances
LinkOut - more resources
Full Text Sources
Other Literature Sources
Molecular Biology Databases
